SIGHT VS. SOUND IN THE JUDGMENT OF MUSIC PERFORMANCE: EVIDENCE FROM TSUGARU SHAMISEN COMPETITIONS IN JAPAN STAGE 1 REGISTERED REPORT - PSYARXIV ...
←
→
Page content transcription
If your browser does not render page correctly, please read the page content below
1   Sight vs. sound in the judgment of music performance: Evidence from
 2   Tsugaru shamisen competitions in Japan [Stage 1 Registered Report]
 3
 4   Gakuto Chiba, Shinya Fujii, Patrick E. Savage
 5   Keio University, Fujisawa, Japan
 6
 7   *Correspondence to: live.shamisen@gmail.com; psavage@sfc.keio.ac.jp
 8
      Please note: This is a non-peer-reviewed preprint. We welcome questions, comments, citation,
      and constructive criticism, bearing in mind that this is a non-peer-reviewed draft subject to
      revision. Supplementary materials will be added in future updates, at which time the data
      repository will be made public. Please direct correspondence to live.shamisen@gmail.com and
      psavage@sfc.keio.ac.jp.

      Recommended citation: Chiba G, Fujii S, Savage PE (2021) Sight vs. sound in the judgment
      of music performance: Evidence from Tsugaru shamisen competitions in Japan [Stage 1
      Registered Report]. PsyArXiv preprint: https://doi.org/10.31234/osf.io/xky4j
 9
10   Abstract

11   Which information dominates in evaluating performance in music? Both experts and laypeople
12   consistently report believing that sound should be the most important domain when judging music
13   competitions, but experimental studies comparing video-only vs. audio-only versions of
14   performances have showed that in at least some cases visual information can play a stronger role.
15   However, whether this phenomenon applies generally to music competitions or is restricted to
16   specific repertoires or contexts is disputed. In this Registered Report, we focus on testing which
17   type of information might be most impactful in a unique cultural setting and musical tradition that
18   has historically excluded the use of and dependence on visual information. We use 27 performances
19   of “Tsugaru Jongara Bushi” from 9 categories of national competitions in performing on the
20   Tsugaru shamisen, a traditional Japanese musical instrument, to evaluate two hypotheses: 1) visuals
21   are predicted to trump sound when variation in quality is low (e.g., choosing between 1st place vs.
22   2nd place), 2) sound is predicted to trump visuals when variation in quality is high (e.g., choosing
23   between 1st/2nd place and those who did not place among the top finalists). Data from pilot
24   experiments (n = 11 participants) suggest that participants are able to correctly select the actual
25   non-placing competition participants based on short excerpts at levels above chance. In Stage 2, we
26   will collect a full sample of 97 participants in order to achieve 95% power to detect effects of at
27   least d = 0.4 using our within-subjects design. Our results leverage the characteristics of a unique
28   non-Western musical tradition not previously empirically tested with such paradigms, and may
29   have practical applications to evaluation criteria for performers, judges, and organizers of
30   competitions, concerts, and auditions.
31

                                                                                                       1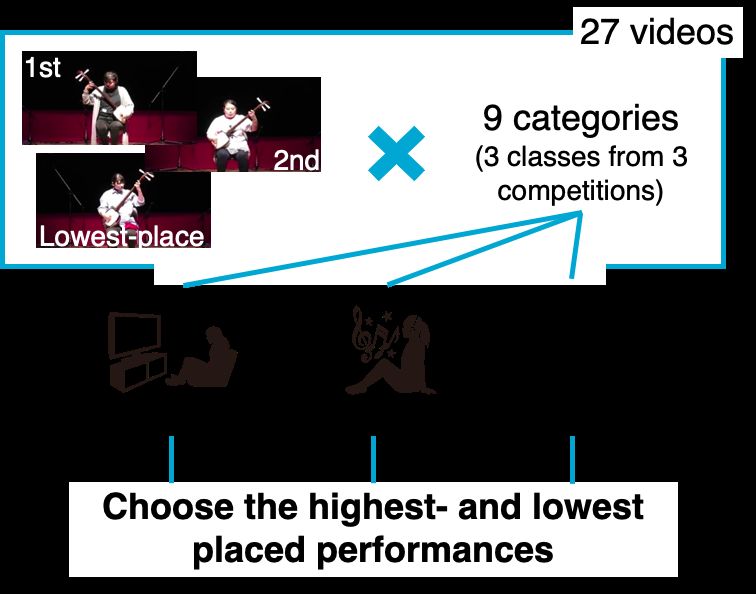
Copyright: © 2021 Chiba et al. This is an open access article distributed under the terms of the
      Creative Commons Attribution License, which permits unrestricted use, distribution, and
      reproduction in any medium, provided the original author and source are credited.
      Data and materials availability: Pilot data and videos are available at https://osf.io/p9fvs/.
      Analysis code is available at https://github.com/comp-music-lab/sight-vs-sound.git. The full
      experiment can be accessed at https://gakuto101207.github.io/.

      Funding: Funding for this study is provided by a Grant-In-Aid from the Japan Society for the
      Promotion of Science (#19KK0064), and by grants from Keio University (Keio Global Research
      Institute, Keio Research Institute at SFC, and Keio Gijuku Academic Development Fund).
      Competing interests: We declare we have no competing interests.

32
33   1. Introduction

34   People rely on multiple senses to perceive and judge many aspects of daily life, and the importance
35   of each sense depends on the situation. The social evaluation of other people can have important
36   implications and consequences, impacting a range of outcomes from hiring decisions to political
37   election results. Broadly, there has been interest in exploring what types of decision strategies may
38   lead to better outcomes (Dane & Pratt, 2007; Rusou et al., 2013; Shapiro & Spence, 1997) and the
39   conditions under which evaluations may be more influenced by one versus another channel of
40   information (Harrigan, Wilson & Rosenthal, 2004; Tolsá-Caballero & Tsay, 2021).

41   We focus on music, a field often defined primarily in auditory terms (e.g., “humanly organized
42   sound”; Blacking, 1976). Sound is consistently reported to be the most important information for
43   evaluating musical performance (Murnighan et al., 1991; Sloboda, Lamont, & Greasley, 2008). Yet
44   there is also a rich literature across fields and methodological traditions showcasing the recognition
45   that music is a multimodal phenomenon (Bergeron & Lopes, 2009; Vines et al., 2006; Leman,
46   2008). For example, visuals play an important role in evaluating musical performance, with
47   elaborate costumes, make-up, and dancing characteristic of both traditional and contemporary
48   music performance (Nettl, 2015). The popular international song competition is called
49   “Eurovision”, not “Eurosound” (cf. Haan et al., 2005).

50   Not only do visuals have the power to affect how it is that we hear the most basic aspects of musical
51   sound (Thompson & Russo, 2007), visuals can also have societal consequences for hiring practices
52   and issues of equity. In a seminal paper that has spurred policy changes, economists found that after
53   the implementation of blind auditions by orchestral organizations, significantly more female
54   musicians were hired (Goldin & Rouse, 2000). These findings underline how much the presence
55   of visuals altered evaluations made of musicians and their performances.

56   Experimental evidence demonstrating cross-domain effects of visual information on auditory
57   perception in music has accumulated over the past few decades and continue to spur interest across
58   fields (Wapnick et al., 1998; Bradley et al., 2006; Schutz et al., 2007; Goebl et al., 2009; Platz &
59   Kopiez 2012, 2013; Tsay, 2013, 2014). Although the findings regarding cross-modal influences
60   from work in music are consistent with those of evaluations made across a range of domains beyond

                                                                                                         2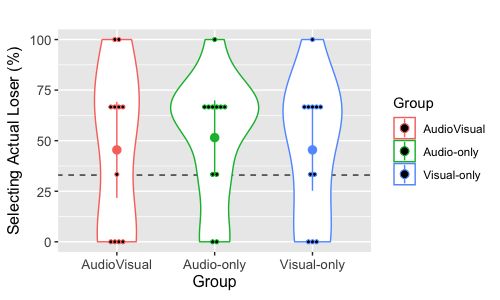
61   music (Campanella & Belin, 2007; Collignon et al., 2008; de Gelder et al.,1999; McGurk &
62   MacDonald, 1976), there is debate about the relative effects of the roles of visuals vs. sound in
63   music competitions and how general such effects may be. For example, two studies of solo piano
64   competitions came to contrasting conclusions regarding the roles of sight vs. sound: Tsay (2013)
65   argued that “people actually depend primarily on visual information when making judgments about
66   music performance”, while Mehr et al. (2018) concluded from direct and conceptual replications
67   of Tsay’s study that “the sight-over-sound effect holds only under limited conditions”. Yet
68   reanalysis of Mehr et al.’s data suggests alternative possible interpretations (see Fig. S1 and
69   Appendix for details), and the generalizability of sight vs. sound effects beyond specific Western
70   classical traditions remains untested despite being arguably a question of even greater importance
71   (Jacoby et al., 2020).

72   1.1 Study aims and hypotheses:

73   To examine the role of visuals and sound in a musical tradition in which significantly different
74   characteristics may be prioritized, we depart from the bulk of prior research using Western classical
75   music and study participants familiar with such norms (Henrich et al., 2010; Jacoby et al., 2020),
76   and instead focus on the Tsugaru shamisen, a traditional Japanese musical instrument.

77   Tsugaru shamisen has a long history of persecution and discrimination in Japan as an instrument
78   traditionally played by blind folk musicians called “Bosama” (Daijo, 1995). In recent decades,
79   Tsugaru shamisen has become highly popular, with thousands of performers competing annually
80   in dozens of regional, national, and even international competitions (Hughes, 2008). Tsugaru
81   shamisen was even featured in the popular 2016 animated movie “Kubo and the Two Strings”.
82   Contemporary Tsugaru shamisen performance is no longer restricted by disability status, but
83   musicians retain traditions of oral transmission, performing while closing their eyes and focusing
84   on sound.

85   Indeed, this tradition should be noted for how the lack of sight in its original performers is not just
86   an ordinary part of its origin story. In fact, blindness has even come to be seen as indicative of a
87   more authentic musician:
88           “Chikuzan’s popularity among the educated young was due as much to his blindness as to
89           his musicianship and his skill as a storyteller. The shamisen is traditionally an instrument
90           of the blind, and Chikuzan's blindness was solid evidence that he was the ‘real thing’.”
91           (Booth 1995, 71)

92   Given the historical development of a tradition that uniquely excludes the role of visual information
93   in practice, musical development, and performance–and actually may privilege the characteristic
94   of blindness in evaluation, which is not typically observed in most other musical traditions–Tsugaru
95   shamisen competitions represents a distinct opportunity to explore the impact of different channels
96   of information with a large sample of performances that have been recorded and already judged.

97   Hypotheses

                                                                                                          3
98 Based on previous findings from solo piano competitions comparing low-variance (1st-3rd place)
99 and high-variance (1st and low-placing) conditions (Tsay, 2013; Mehr et al., 2018; cf. Appendix for
100 more details), we made the following predictions for Tsugaru shamisen competitions:
101 H1: We predict that visuals will dominate the judgment of Tsugaru shamisen performance among
102 upper ranks (e.g., 1st vs. 2nd place), due to low variance trials with relatively little differences in
103 performance quality.
104 H2: We predict that visuals will dominate the judgment of Tsugaru shamisen performance between
105 upper and lower ranks (e.g., 1st or 2nd place vs. 8th place or lower), where there are high variance
106 trials with relatively greater differences in performance quality.
107 The null hypothesis for each of these predictions is that neither visuals nor sound dominates
108 judgments. Such a result may be due to the characteristics of the Tsugaru shamisen performance
109 tradition, which depart from most other musical traditions in emphasizing its historical roots in
110 blind performing traditions. Support for the null hypothesis would be evaluated through
111 equivalence testing (Lakens, 2017) in the event that our predictions are not statistically significant
112 (see Methods).
113 2. Method
114 We built upon standard designs of testing predictions of behaviors (Ambady & Rosenthal, 1993;
115 Ballew & Todorov, 2007; Rule & Ambady, 2008; Todorov et al., 2005; Tsay, 2013; Tsay, 2014;
116 Tsay 2021) in a within-subjects experiment to maximize statistical power and interpretability.
117 Based on the literature on thin slices of behaviors (Amabile, Krabbenhoft, & Hogan, 2006; Ambady,
118 Bernieri, & Richeson, 2000; Ambady & Rosenthal, 1993) and similar studies of visuals vs. sound
119 in music competition evaluation (Tsay, 2013; Mehr et al. 2018), we selected brief 6s excerpts of
120 1st-place, 2nd-place, and lowest-placing performers from 9 different national Tsugaru shamisen
121 competition categories (Table 1). For the 6 categories that did not rank performers beyond a certain
122 place, we randomly selected one of the non-placing performances (estimated average placing across
123 all lowest-placing performances: 20th).
Table 1 Overview of the experimental stimuli selected: 27 performances from 9 national
Tsugaru shamisen competitions (see https://osf.io/pj65d/ for detailed metadata)
competition Biwako competition Michinoku competition Hirosaki competition
classes Junior
Boys high
General General General Personal Seniors Youth
and Seniors school
(women) (women) (men) B C C
girls and high
school
1st place 1 1 1 1 1 1 1 1 1
42nd place 2 2 2 2 2 2 2 2 2
Lowest 21~47 13 21~42 11~12 8 9 8~43 8~31 9~57
place
124 We use a within-subjects design in which experimental participants all rated 3 audio-only, 3 video-
125 only, and 3 audiovisual competitions, the choice and order of which were randomly assigned. The
126 full pilot experiment can be accessed at https://gakuto101207.github.io/ (see Fig. 1 for an overview)
127 [NB: the pilot experiment was based on a slightly earlier design that consistently used the 7th-place
128 performer in all competitions, but we plan to change this to the lowest-placed performer as
129 described above in the full experiment to maximize differences in quality to better test the
130 hypotheses.]
131
132 Figure 1. Overview of the experimental paradigm for rating 27 performances from 9 competition categories
133 based on 6s excerpts of audio-only, video-only, or audiovisual information.
134 2.1 Independent variable
135 The independent variable is the stimulus domain (Audio-only, Visual-only and AudioVisual).
136 Participants will be randomly assigned 9 tasks, 3 from each of these types. In the Audio-only
137 condition, only the sounds of “Tsugaru Jongara Bushi” by the three players are heard in succession,
5138 with no visual input. In the Visual-only condition, only the three players are displayed on the video
139 screen in succession, with no auditory input. In the AudioVisual condition, three performance
140 videos with sound are presented. In these three conditions, participants are asked to evaluate all
141 performances. “Tsugaru Jongara Bushi” is chosen because it is the most famous song among
142 Tsugaru shamisen players, and it is a compulsory component of all competitions, which allows us
143 to collect a large number of comparable samples from limited performance videos.
144 2.2 Dependent variables
145 The two dependent variables will be the percentage of participants correctly choosing 1) the 1st-
146 placed performer, and 2) the lowest-placed performer. After judging 3 performers who are
147 displayed in random order, participants will select who they believe was the highest- and lowest-
148 ranking performer. After being presented with 9 such tasks, participants then provide demographic
149 information including gender, age, and musical experience.
150 2.3 Statistical analysis
151 To test our predictions, we will follow previous analyses of similar paradigms (Tsay, 2013; Mehr
152 et al., 2018) by performing paired t-tests of both dependent variables between the two key
153 conditions (audio-only and visual-only; the audiovisual condition is used as a control for
154 interpreting data, but is not specifically relevant for hypothesis testing). Because we are testing two
155 predictions, we will use a Bonferroni correction to maintain an overall Type-1 Error alpha level
156 of .05 (i.e., the critical significance p-value for each t-test will be set to .025). If the analysis shows
157 that one or both measures are not significantly greater in the predicted direction, we will then use
158 equivalence testing (Lakens, 2017) to determine whether the dependent variables can be considered
159 to be significantly equivalent (i.e., differences are small enough to be effectively non-existent).
160 These equivalence tests will assume the same alpha level and smallest effect size of interest
161 parameters as our primary analyses (i.e., alpha = .025, range of effect sizes considered equivalent;
162 d = -0.4 to 0.4).
163 2.4 Power analysis
164 A priori power analysis requires estimating the effect size before collecting data, which is
165 notoriously difficult. In this paper, we calculate power analyses assuming an effect size of 0.4 as
166 an approximation of the “smallest effect size of interest” (Lakens, 2017). To achieve power of 95%
167 given an alpha level of 0.025 (see above for rationale), the two-tailed nature of the hypotheses, and
168 our within-subject design, we will require data from at least 97 participants.
169 2.5 Sample choice
170 The number of the uploaded videos in Tsugaru shamisen competitions is small, and the public
171 availability of videos is also limited. Among them, we selected the three Tsugaru Shamisen
172 National appropriately clear. The national competitions include many categories; we focus on the
173 performances of “Tsugaru Jongara Bushi,” which is most famous in Japan, choose 9 categories of
174 the national competitions and three performers (1st, 2nd and lowest place) in each category.
175 Regarding the lowest-placed performer, we will randomly choose from the rankings of the lower-
176 place performers in the national competitions because these rankings are not open to the public.
6177 The number and distribution of stimuli is comparable to similar studies of solo piano music
178 competitions (Tsay, 2013; Mehr et al., 2018).
179 2.6 Participants
180 Participants will be native Japanese speakers 18 and older who have no hearing or visual disabilities
181 and who have read and consented to the online experiment. They will be recruited from Keio
182 University and the surrounding communities through a combination of social media, printed flyers,
183 and word-of-mouth advertisements. Participants will be reimbursed Keio University’s standard rate
184 (currently ¥1,050, approximately US$10). We ask them to respond to basic demographic items
185 (e.g., Age, Gender, Native Tongue, musical instrument experience) after the experiment, and the
186 online experiment will take approximately 15 minutes for completion.
187 2.7 Video editing method
188 To edit the video, GC used a video editing software called DaVinci Resolve. The Tsugaru shamisen
189 tournament video included the tournament, category name, performer name, etc., so we masked
190 these details. We also magnified the video to allow better viewing of the performers' movements,
191 and adjusted the focus of footage such that performers would be in the center of the screen. We
192 also corrected for extraneous noises to maintain appropriate sound quality. Experimental stimuli
193 excerpts and full original videos can be viewed at https://osf.io/p9fvs.
194 2.8 Pilot data
195 Pilot experiments (n = 11 participants) were collected before we updated the stimuli to increase the
196 variance of trials. Figure 3 shows pilot data for the percentage selected as the actual winner and
197 non-winner in the three conditions (Audio-only, Visual-only, AudioVisual). Differences between
198 the audio-only and visual-only conditions are currently too small to be able to draw meaningful
199 conclusions regarding our hypotheses from this small pilot, though they seem suggestive that at
200 least when selecting the lowest-placing performer, participants appear to be able to achieve this at
201 levels above chance (33%, indicated by the dashed line in Fig. 3). This functions as a positive
202 control to suggest that our experimental paradigm should be able to collect meaningful data to allow
203 us to evaluate whether our hypotheses are supported.
204
205 Figure 2. Violin plots of the importance of information when the participants (n = 11) evaluate the videos
206 under Audio-only, Visual-only and Audio Visual conditions of the Tsugaru Shamisen National Competitions
207 in a pilot experiment. Violin plots on the left show how often participants correctly selected the performer
7208 placing highest, and violin plots on the right show how often participants correctly selected the performer
209 placing lowest. Small dots indicate individual participant data points, large dots indicate mean values, and
210 error bars indicate 95% confidence intervals.
Table 2 | Registered Report design planner
Question Hypothesis Sampling Analysis plan Interpretat
plan ion given
(e.g. power outcome
analysis)
Which type of H1: Visuals dominate Power Paired-sample t-test Visuals or
information, if the judgment of analysis: n = of rate selecting sound
any, has greater Tsugaru Shamisen 97 actual winner in does/does
impact on the performance between participants audio-only vs. video- not domi
evaluation of upper ranks (e.g., 1st (d ≥ 0.4, β only conditions (α nate when
Tsugaru Shamisen vs. 2nd place), due = .95) = .025). Equivalence judging
performance in to the low variance in testing if non- between
music? trials. significant (α = .025, upper and
-0.4 > d ≤ 0.4) lower
ranks.
(Same as above) H2: Sound dominates (Same as Same as above, but
the judgment of above) for rate correctly
Tsugaru Shamisen selecting the lowest-
performance between placed performer.
upper and lower ranks
(e.g., 1st or 2nd place
vs. 8th place or lower),
due to the high
variance in trials.
211 Ethics:
212 We have approval of the Keio University Shonan Fujisawa Campus Institutional Review Board to
213 PES (approval #298). All pilot participants provided informed consent and all future participants
214 will provide informed consent.
215 Data/code availability:
216 Pilot data and videos are available at https://osf.io/p9fvs/
217 Analysis code is available at https://github.com/comp-music-lab/sight-vs-sound.git
218 The full experiment can be accessed at https://gakuto101207.github.io/
219 Authors’ contributions:
220 Conceptualization: Gakuto Chiba, Patrick E. Savage, Shinya Fujii
8221 Investigation: Gakuto Chiba [collected pilot data]
222 Analysis: Gakuto Chiba, Patrick E. Savage
223 Writing –original draft: Gakuto Chiba, Patrick E. Savage
224 Writing –reviewing/editing: Shinya Fujii
225 Project administration/supervision/funding acquisition: Patrick E. Savage
226 Competing interests. We declare we have no competing interests.
227 Acknowledgments. We thank Chia-Jung Tsay for extensive feedback on earlier versions of the
228 manuscript.
229 Funding. Funding for this study is provided by a Grant-In-Aid from the Japan Society for the
230 Promotion of Science (#19KK0064), and by grants from Keio University (Keio Global Research
231 Institute, Keio Research Institute at SFC, and Keio Gijuku Academic Development Fund).
232 References
233 Ambady, N., Bernieri, F. J., & Richeson, J. A. (2000). Toward a histology of social behavior:
234 Judgmental accuracy from thin slices of the behavioral stream. In M. P. Zanna (Ed.), Advances in
235 experimental social psychology, 32, 201-272. San Diego, CA: Academic Press.
236 Ambady, N., Krabbenhoft, M. A., & Hogan, D. (2006). The 30-second sale: Using thin slice
237 judgments to evaluate sales effectiveness. Journal of Consumer Psychology, 16(1), 4-13.
238 Ambady, N., Rosenthal, R. (1993). Half a minute: Predicting teacher evaluations from thin slices
239 of nonverbal behavior and physical attractiveness. Journal of Personality and Social Psychology,
240 64(3), 431-441.
241 Ballew, C. C., Todorov, A. (2007). Predicting political elections from rapid and unreflective face
242 judgments. Proceedings of the National Academy of Sciences, 104(46), 17948-17953.
243 Bergeron, V., Lopes, D. M. (2009). Hearing and seeing musical expression. Philosophy and
244 Phenomenological Research, 78(1), 1-16.
245 Booth, A. (1995). Looking for the Lost: Journeys Through a Vanishing Japan. New York:
246 Kodansha America.
247 Campanella, S., Belin, P. (2007). Integrating face and voice in person perception. Trends in
248 cognitive sciences, 11(12), 535-543.
249 Collignon, O., et al. (2008). Audio-visual integration of emotion expression. Brain research, 1242,
250 126-135.
251 de Gelder, B., Böcker. K, B., Tuomainen, J., Hensen, M., Vroomen, J. (1999). The combined
252 perception of emotion from voice and face: Early interaction revealed by human electric brain
253 responses. Neuroscience Letters, 260(2), 133-136.
254 Dane, E., Pratt, M. G. (2007). Exploring Intuition and Its Role in Managerial Decision Making.
255 The Academy of Management Review, 32(1), 33-54. https://doi.org/10.2307/20159279
256 Ginsburgh, V. A., Van Ours, J. C. (2003). Expert opinion and compensation: Evidence from a
257 musical competition. American Economic Review, 93(1), 289-296.
9258 Goebl, W., Palmer, C. (2009). Synchronization of timing and motion among performing musicians,
259 Music Perception, 26(5), 427-438. https://doi.org/10.1525/mp.2009.26.5.427
260 Goldin, C., Rouse, C. (2000). Orchestrating impartiality: The impact of “blind” auditions on female
261 musicians. American Economic Review, 90(4), 715-741.
262 Haan, M. A., Dijkstra, S. G., & Dijkstra, P. T. (2005). Expert judgment versus public opinion:
263 Evidence from the Eurovision song contest. Journal of Cultural Economics, 29(1), 59-78.
264 https://doi.org/10.1007/s10824-005-6830-0
265 Harrigan, J. A., Wilson, K., & Rosenthal, R. (2004). Detecting state and trait anxiety from auditory
266 and visual cues: A meta-analysis. Personality and Social Psychology Bulletin, 30(1), 56-66.
267 Henrich, J., Heine, S. J., & Norenzayan, A. (2010). The weirdest people in the world? Behavioral
268 and Brain Sciences, 33(2-3), 61-135. https://doi.org/10.1017/S0140525X0999152X
269 Hughes, D. W. (2008). Folk music: from local to national to global. In A. M. Tokita & D. W.
270 Hughes (Eds.), The Ashgate Research Companion to Japanese Music, 281-302. Ashgate.
271 Jacoby, N., Margulis, E. H., Clayton, M., Hannon, E., Honing, H., Iversen, J., Klein, T. R., Mehr,
272 S. A., Pearson, L., Peretz, I., Perlman, M., Polak, R., Ravignani, A., Savage, P. E., Steingo, G.,
273 Stevens, C., Trainor, L., Trehub, S., Veal, M., & Wald-Fuhrmann, M. (2020). Cross-cultural work
274 in music cognition: Methodologies, pitfalls, and practices. Music Perception, 37(3), 185-195.
275 https://doi.org/10.1525/mp.2020.37.3.185
276 Daijo, K., (1995). 津軽三味線の誕生 : 民俗芸能の生成と隆盛. 新曜社.
277 Lakens, D. (2017). Equivalence tests: A practical primer for t tests, correlations, and meta-analyses.
278 Social Psychological and Personality Science, 8(4), 355-362.
279 https://doi.org/10.1177/1948550617697177
280 Leman, M. (2008). Embodied music cognition and mediation technology. MIT Press.
281 McGurk, H., & MacDonald, J. (1976). Hearing lips and seeing voices. Nature, 264(5588), 746-748.
282 Mehr, S. A., Scannell, D. A., & Winner, E. (2018). Sight-over-sound judgments of music
283 performances are replicable effects with limited interpretability. PLOS ONE, 13(9), e0202075.
284 https://doi.org/10.1371/journal.pone.0202075
285 Murnighan, K., Conlon, D. (1991). The dynamics of intense work groups: A study of British string
286 quartets, Administrative Science Quarterly, 36(2), 165-186.
287 Nettl, B. (2015). The study of ethnomusicology: Thirty-three discussions, (3rd ed.). University of
288 Illinois Press.
289 Platz, F., Kopiez R. (2012). When the eye listens: A meta-analysis of how audio-visual presentation
290 enhances the appreciation of music performance, Music Perception, 30(1), 71-83.
291 https://doi.org/10.1525/mp.2012.30.1.71
292 Platz, F., Kopiez, R. (2013). When the first impression counts: Music performers, audience, and
293 the evaluation of stage entrance behavior, Musicae Scientiae, 17(2), 167-197.
294 Rule, N. O., Ambady, N. (2008). The face of success: Inferences from chief executive officers’
295 appearance predict company profits. Psychological Science, 19(2), 109-111.
10296 Rusou, Z., Zakay, D., & Usher, M. (2013). Pitting intuitive and analytical thinking against each
297 other: The case of transitivity. Psychonomic Bulletin & Review, 20(3), 608-614.
298 https://doi.org/10.3758/s13423-013-0382-7
299 Schutz, M., Lipscomb, S. (2007). Hearing gestures, seeing music: Vision influences perceived tone
300 duration. Perception, 36(6), 888-897. https://doi.org/10.1068/p5635
301 Shapiro, S., & Spence, M. T. (1997). Managerial intuition: A conceptual and operational
302 framework. Business Horizons, 40(1), 63-68. https://doi.org/10.1016/S0007-6813(97)90027-6
303 Sloboda, J. A., Lamont, A., Greasley, A. E. (2008). The Oxford Handbook of Music Psychology,
304 eds Hallam S, Cross I, Thaut M (Oxford Univ Press, Oxford), 431-440.
305 Thompson, W. F., Russo, F. A. (2007). Facing the music. Psychological Science, 18(9), 756-757.
306 Todorov, A., Mandisodza, A. N., Goren, A., & Hall, C. C. (2005). Inferences of competence from
307 faces predict election outcomes. Science, 308(5728), 1623-1626.
308 Tolsá-Caballero, N., & Tsay, C. (2021). Blinded by our sight: Understanding the prominence of
309 visual information in judgments of competence and performance. Current opinion in
310 psychology, 43, 219-225. Advance online publication.
311 https://doi.org/10.1016/j.copsyc.2021.07.003
312 Tsay, C. (2013). Sight over sound in the judgment of music performance. Proceedings of the
313 National Academy of Sciences, pmid:23959902.
314 Tsay, C. (2014). The vision heuristic: Judging music ensembles by sight alone. Organizational
315 Behavior and Human Decision Processes, 124(1), 24-33.
316 Tsay, C. (2021). Visuals dominate investor decisions about entrepreneurial pitches. Academy of
317 Management Discoveries, 7(3), 1-23.
318 Vines, B. W., Krumhansl, C. L., Wanderley, M. M., & Levitin, D. J. (2006). Cross-modal
319 interactions in the perception of musical performance. Cognition, 101(1), 80-113.
320 https://doi.org/10.1016/j.cognition.2005.09.003
321 Wapnick, J., Mazza, J. K., & Darrow, A. A. (1998). Effects of performer attractiveness, stage
322 behavior, and dress on violin performance evaluation. Journal of Research in Music Education,
323 46(4), 510-521. doi: 10.2307/3345347.
324
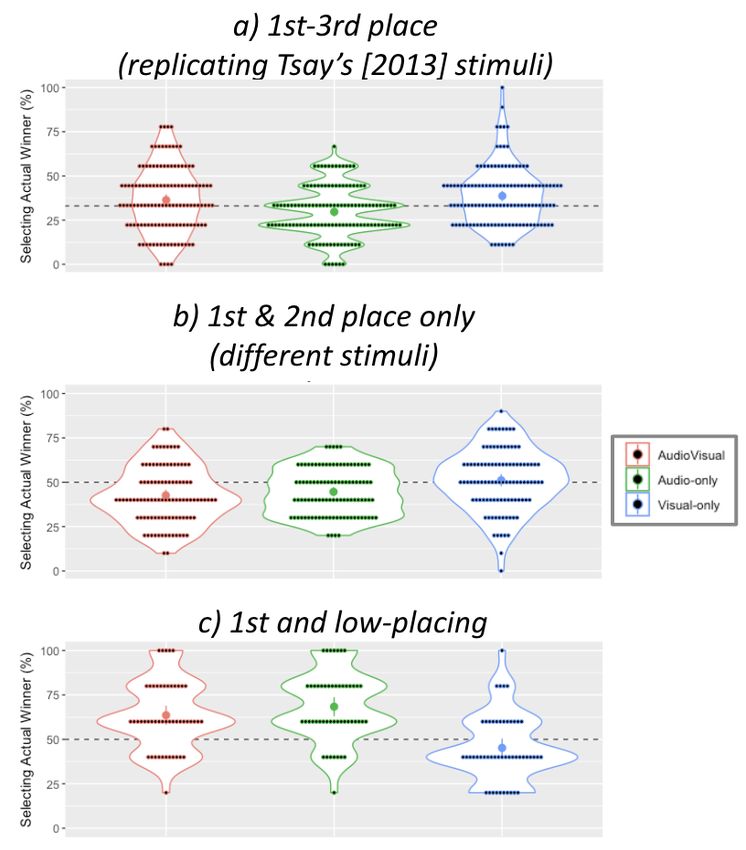
325 Appendix: Reanalysis and reinterpretation of Mehr et al. (2018) data S1.1. Aesthetics and
326 Evolution
327 Tsay (2013) found that, when choosing between 6-second excerpts of the 1st, 2nd, and 3rd-place
328 performers in classical piano competitions, participants were able to choose correctly 46% of the
329 time when watching silent videos without audio, compared to only 28% accuracy when listening
330 to audio only without video (Tsay 2013 Experiment 3).
331 Mehr et al. (2018) conducted a direct replication using the same stimuli as Tsay (2013) Experiment
332 3, which they successfully replicated albeit with slightly weaker results (39% accuracy with video-
333 only vs. 30% with sound-only; data plotted in Fig. S1a). Mehr et al. also conducted two conceptual
11334 replications using different stimuli, which they argued represented a “failure to replicate” Tsay’s
335 findings. However, Mehr et al. did not actually plot their data and relied only on selected statistical
336 comparisons to argue that their results represented a “failure to replicate” Tsay’s. Specifically, they
337 interpret the fact that video-only accuracy was not significantly above chance (50% in their
338 modified design using only 1st and 2nd-place performances, rather than 33% in the original design
339 using 1st-3rd place) as failure to replicate sight-over-sound effects. Yet when their data are
340 visualized, it is clear that their Study 2 results (51% accuracy with video-only vs. 45% with audio-
341 only) are qualitatively very similar to their Study 1 results (39% vs. 30%, respectively; Fig. S1b).
342 Throughout their analyses, Mehr et al. only reported inferential statistics are one-sample t-tests
343 comparing accuracy in each condition to chance, and do not report the statistics more theoretically
344 relevant for sight-over-sound effects - namely the two-sample t-tests reported previously by Tsay
345 (2013). When Mehr et al.’s data are reanalyzed using two-sample t-tests, both Study 1 and Study 2
346 replicate Tsay’s finding of greater accuracy with video-only vs. audio-only (Study 1: t = -4.5, df =
347 243, p = 9.9 x 10⁻⁶; Study 2: t = -3.0, df = 185, p (two-tailed) = 0.003). Thus, Mehr et al.’s claim
348 that Study 2 failed to replicate Tsay’s findings is inaccurate.
349 On the other hand, Mehr et al.’s claim that Study 3 failed to conceptually replicate Tsay is better
350 supported by their data. Specifically, when differences in performance quality were made clearer
351 by comparing the winning performer with lower-ranked performers rather than 2nd place
352 performers, higher accuracy was found with audio-only (68%) than video-only (45%; Fig. S1c; t =
353 6.1, df = 98, p = 2.6 x 10⁻⁸). Mehr et al.’s claim that “sight does not necessarily trump sound in the
354 judgment of music performance” is thus clearly supported. However, this may be partially
355 consistent with Experiment S3 in Tsay (2013), which found practically no difference in accuracy
356 between video-only and audio-only performances when using stimuli from youth (pre-college)
357 competitions where differences in quality are greater than found in professional competitions
358 (Experiment S3-1: video-only 70% vs. audio-only 69%; Experiment S3-2: video-only 56% vs.
359 audio-only 53%).
12360
361 Figure S1. Violin plots visualizing Mehr et al.’s (2018) previous experimental results of sight vs. sound
362 effects in judging piano performances (data were not visualized in the original publication). Panels a-c
363 correspond to Studies 1-3 (see Appendix text for details). Dots indicate individual participants (a: n=375
364 participants; b: n=300 participants; c: n=150 participants), large dots indicate means and bars indicate 95%
365 confidence intervals. The colour legend indicates whether the 6-second excerpts participants played were
366 audiovisual, audio-only, or visual-only. The y-axis indicates the percent of performers correctly choosing the
367 winning performer. Dashed lines indicate chance levels (33% when choosing between 3 performers, 50%
368 when choosing between only 2).
13You can also read