SPATIAL SPILLOVER EFFECTS OF MEGA-CITY LOCKDOWN DUE TO COVID-19 OUTBREAK - MUNICH PERSONAL REPEC ARCHIVE
←
→
Page content transcription
If your browser does not render page correctly, please read the page content below
Munich Personal RePEc Archive

Spatial Spillover Effects of Mega-City
Lockdown Due to Covid-19 Outbreak

Celebioglu, Fatih

Non-Affiliated Researcher

11 May 2020

Online at https://mpra.ub.uni-muenchen.de/100333/
MPRA Paper No. 100333, posted 15 May 2020 05:22 UTC
Spatial Spillover Effects of Mega-City Lockdown Due to Covid-19 Outbreak

                                                   Fatih CELEBIOGLU1

       Abstract
       With the Covid-19 outbreak, academic studies have been started to calculate the
       economic effects of the outbreak. Since it is not possible to determine when
       epidemics/pandemics (or large magnitude earthquakes, etc.) occur, their negative
       economic effects cannot be precisely predicted. Decreasing consumption and supply
       at the same time, breaking the supply chain, closing businesses and increasing
       unemployment are rapidly disrupting economic conditions.
       The measures are mostly related to issues at the macroeconomic level. If a full curfew
       is imposed throughout the country, economists are working on how it will have an
       impact on the economy of the whole country. However, the analysis of the effects at
       the regional level is discussed secondarily. The aim of this study is to simulate the
       effects of an economic lock-down that might take place in two important mega cities
       such as Istanbul and Izmir.
       As a result of this analysis made using spatial econometrics tools; in the event of a
       lockdown (or earthquake) in mega cities such as İstanbul and/or İzmir, there will be
       major economic difficulties that will spread wave by wave to the neighboring cities
       and then eventually to the whole country.

       Key words: Covid-19, Mega-city, Lockdown, Spatial Econometrics, Spillover Effects
       JEL Codes: R11, R12, O20

1. Introduction
Covid-19 pandemic is affecting all the countries in the world. WHO (2020) declared that as of May
01, 2020, the total number of confirmed globally cases of COVID-19 reached 3.175.207, whereas the
total number of deaths was 224.172.
With the emergence of the Covid-19 outbreak in Wuhan (China) and its rapid spread to throughout
the world, governments in all countries implemented curfews and took measures to restrict
economic activities. As a result, economic growth is expected to decline and unemployment will
increase rapidly.
Although the outbreak began in December 2019, it was declared by the World Health Organization
(WHO) as a pandemic on March 11, 2020. After a short time after the first cases seen in Turkey on
March 10, 2020, the measures were increased. Curfew was imposed on people aged over 65 and
under 20. Despite much controversy, the curfew was not fully implemented. Outbreak in Turkey was
more effective in metropolitan cities where the population density is high. The data2 of the Ministry
of Health show that İstanbul and İzmir3 lead the way.

  Fatih ÇELEBİOĞLU, Ph.D., Associate Professor, Non-Affiliated Researcher,
1

  Cell: +90 (505) 907-2811, E-mail: fcelebioglu@hotmail.com
2
  Although the Ministry of Health did not regularly publish data at the provincial level, it was announced by the Minister
that Istanbul and Izmir were in the first two places. Please see: https://tr.euronews.com/2020/04/03/turkiye-de-en-cok-
koronavirus-covid-19-vakasinin-goruldugu-10-kent
3
  Please see the map that shows geographically all provinces of Turkey in the appendix.
Why does the Turkish government not willing to implement a long-term curfew in metropolitan cities instead of a short-term and limited curfew? The most important reason is that these cities are Turkey's economic centers. Any sort of economic lock-down in these cities, due to an outbreak or other reasons (for example, the large magnitude Istanbul earthquake that has been expected for years), will result in huge losses of province level gross domestic income for the rest of the country. Because of these cities have a great purchasing power from other cities for their own production and consumption; they are the source of income for other cities. The main purpose of the paper is to explain the spatial spillover economic effects of mega-city lockdown due to Covid-19 outbreak in Turkey. 2. Literature Since the Covid-19 outbreak began to spread around the world, many economists quickly began to publish studies analyzing the economic effects of the epidemic. The vast majority of these studies focus on scenarios, the possible macroeconomic effects, and commodity prices as a result of the Covid-19 outbreak (McKibbin and Fernando, 2020/a and 2020/b; Arezki and Nguyen, 2020; Fernandes, 2020; Ozili and Arun, 2020). On the other hand, Baldwin and Tomiura (2020) analyze the problems arising in national and international trade in goods and services due to the epidemic. Beck (2020) works on global financial side and Toda (2020) studies on stock pricing and labor supply shock based on asset pricing model. Voth (2020) focuses on relations between trade and travel in the time of epidemics. Elgin et al. (2020) develops Covid-19 Economic Stimulus Index (CESI). Lustig and Mariscal (2020) compare the economic effects of the outbreak to the 2008 global crisis. Sumner et al. (2020) focus on the estimates of the impact of COVID-19 on global poverty. Atkeson (2020) works on economic impact of Covid-19 in the US economy. Guerrieri et al. (2020) want to response about whether or not negative supply shocks cause demand shortages. Guliyev (2020) examines the factors affecting COVID-19 together with the spatial effects, and use spatial panel data models to determine the relationship among the variables including their spatial effects. Using spatial panel models, he analyses the relationship between confirmed cases of COVID- 19, deaths thereof, and recovered cases due to treatment. Although there are studies (Huang et al., 2020; Kang et al., 2020) analyzing the spatial spread of Covid-19, there are no publications addressing the spatial economic effects of the epidemic. One of the rare studies based on city/province was on Tokyo. Inoue and Todo (2020) focus on the economic effects of a possible lockdown of Tokyo to prevent spread of COVID-19. Applying an agent- based model to the actual supply chains of nearly 1.6 million firms in Japan, they simulate what would happen to production activities outside Tokyo when production activities that are not essential to citizens' survival in Tokyo were to shut down for a certain period. They find that when Tokyo is locked down for a month, the indirect effect on other regions would be twice as large as the direct effect on Tokyo, leading to a total production loss of 27 trillion yen in Japan, or 5.3% of its annual GDP. Although the production shut down in Tokyo accounts for 21% of the total production in Japan, the lockdown would result in a reduction of the daily production in Japan by 86% in a month. Although limited in number, some analyses on this subject were made on Turkey. Özatay and Sak (2020/a) work on managing the economic consequences (especially tourism, unemployment and SMEs) of COVID-19. Açıkgöz and Günay (2020) explain potential impacts of the Covid-19 pandemic on the Turkish Economy and try to put forth possible economic and political scenarios for the post- pandemic world. Özatay and Sak (2020/b) try to answer how national income and economic growth would be affected, if the epidemic lasted long. According to their calculations, for a six-month epidemic, Turkish economy needs support up to 19 percent of GDP. If the duration of the outbreak increases to nine months, this value becomes 27 percent. Taymaz (2020) examines the impacts of the Covid-19 measures the on Turkish economy using by input-output analysis. He makes estimation about the sectors whose activities are restricted and not restricted based on economic relations between the
sectors. Relations between Covid-19 cases and the city sizes in Turkey were examined by Yigit (2020).
Özatay and Sak (2020/c) focus on the cost of it to the economy, if a curfew is imposed due to COVID-
19.
Akcigit and Akgunduz (2020) present some evidence on the size and likely consequences of the sharp
decline in demand that followed the beginning of the Covid-19 pandemic in Turkey. They use daily
data on province-level credit card spending to estimate the size of the demand shock in each Turkish
province. Their results show that the demand shock was sizeable, particularly in large cities like
Istanbul. Assuming that the demand shock will last three months, they find an annual decline in total
firm sales of 10% with considerable variation across provinces.
As can be seen in these studies, many economists focus on the effects of the epidemic at the
macroeconomic level (inflation, GDP, growth rate, unemployment rate, current accounts, budget
deficit etc.). However, there is not enough work on what regional economic impact will occur if
mega-cities are locked down due to the epidemic. This study aims to fill the gap in this field.
3. Importance of İstanbul and İzmir
Turkey is a country with large regional disparity (Gezici and Hewings, 2004; Celebioglu and Dall’erba,
2010). In particular, the west of Turkey is in a better situation than other regions in terms of
economic development. This situation of Western Anatolia can be clearly seen from all kinds of
economic and social data. Especially Marmara and Aegean region are different from the others.
Marmara region is the economic, financial and industrial epicenter of Turkey. Revenues are higher in
these regions due to the population density, the development of trade and industrial sectors, and the
impact of tourism (Celebioglu, 2010). According to the Socio-Economic Development Index (SEGE,
2017), Istanbul ranks first and İzmir is third among the most developed provinces.
According to Turkish Statistical Institute - TURKSTAT (2020), population of provinces (first 10) in
Turkey, can be seen on Table 1. As seen in Table 1, İstanbul is the most populous city. The second city
is capital of Turkey, Ankara and İzmir is in the third rank.

                     Table 1: Population Numbers of Provinces in Turkey (2019)
                         Provinces                   Population Numbers
                         İstanbul                                15 519 267
                         Ankara                                   5 639 076
                         İzmir                                    4 367 251
                         Bursa                                    3 056 120
                         Antalya                                  2 511 700
                         Adana                                    2 237 940
                         Konya                                    2 232 374
                         Şanlıurfa                                2 073 614
                         Gaziantep                                2 069 364
                         Kocaeli                                  1 953 035
                                      Source: TURKSTAT (2020)

Turkish Exporters Assembly-TİM (2020) dataset explains that the most powerful exporter city is
İstanbul in 2019 in Turkey. İzmir is the fourth city in Turkey.
Table 2: Export Numbers of Provinces in Turkey (2019)
Provinces Export Numbers (thousand dollars)
İstanbul 70 101 911
Kocaeli 15 240 493
Bursa 14 987 146
İzmir 9 770 278
Ankara 8 303 474
Gaziantep 7 471 843
Sakarya 5 177 176
Manisa 4 450 434
Denizli 3 185 780
Hatay 2 841 678
Kayseri 2 050 133
Konya 2 013 869
Adana 1 918 852
Mersin 1 797 162
Source: TİM (2020)
İstanbul can be considered as the economic capital of Turkey. Factors such as population, commercial
and financial data, industrial production, and intercontinental location support this claim. Although
İstanbul has a special status, the status of İzmir, Turkey's 3rd-biggest metropolitan city, is similar to
İstanbul.
4. Data
Province based gross domestic products (year 2018) dataset4 comes from Turkish Statistical Institute
of Turkey. We use LN of provincial GDP (see at tables as LN_G).
Inter-city trade dataset5 (year 2017) of İstanbul and İzmir comes from Entrepreneurial Information
System of the Ministry of Industry and Technology. We consider the ratio of the purchases of
Istanbul and Izmir from each province within the total purchases (see at tables as IST_BUY and
IZ_BUY).
We have some limitations about the datasets. The institutions have not published the new versions
of datasets after 2017 and 2018. However, the datasets we used as the economic weight of the
provinces will not change in a short time. We use GeoDa Program to analyze spatial effects.
5. Methodology
In this section, we will explain spatial neighbors and spatial weight matrix, spatial autocorrelation,
Moran’s I value and bases of spatial econometric analysis.
5.1. Spatial Weight Matrix and Spatial Neighbors
Following Anselin (1988), spatial weight matrix is the necessary tool to impose a neighborhood
structure on a spatial dataset. As usual in the spatial statistics literature, neighbors are defined by a
binary relationship (0 for non-neighbors, 1 for neighbors). We have used two basic approaches for
defining neighborhood: contiguity (shared borders) and distance. Contiguity-based weights matrices
include rook and queen. Areas are neighbors under the rook criterion if they share a common
border, not vertices. Distance-based weight matrices include distance bands and k nearest neighbors.
Based on these two concepts, we tried all the neighborhood criteria of Queen, Rook, Distance 200
km, Distance 250 km and Distance 300 km. Since we found the best results in a distance 250 km
neighborhood, we decided to use the “distance 250 km” weight matrix which defines as neighbors all
4
Please see on the website: http://www.tuik.gov.tr/UstMenu.do?metod=temelist
5
Please see on the website: https://gbs.sanayi.gov.tr/AnaSayfa.aspxthe provinces located within a great circle distance with a cutoff of 250 km. Distance metric is based
on ARCDISTANCE (km).
{ (1)
where is great circle distance between centroids of region i and j. The weight matrices are based
on the centroid distances, , between each pair of spatial units i and j.
5.2 Moran’s I for Global Spatial Autocorrelation
Anselin and Berra (1998) describe spatial autocorrelation as coincidence of value similarity with
locational similarity. In other words, high or low values for a random variable tend to cluster in space
(positive spatial autocorrelation), or locations tend to be surrounded by neighbors with very
dissimilar values (negative spatial autocorrelation). Positive spatial autocorrelation
operationalizes Tobler's First Law of Geography whereby closer areas are more similar in value than
distant ones. Negative spatial autocorrelation exists when high values correlate with low neighboring
values and vice versa.
Spatial autocorrelation refers to the correlation of a variable with itself in space. It can be positive
(when high values correlate with high neighboring values or when low values correlate with low
neighboring values) or negative (spatial outliers for high–low or low–high values). Note that positive
spatial autocorrelation can be associated with a small negative value (e.g., −0.01) since the mean in
finite samples is not centered on 1. Spatial autocorrelation analysis includes tests and visualization of
both global (test for clustering) and local (test for clusters) Moran’s I statistic (Anselin et al. 2006).
Global spatial autocorrelation is a measure of overall clustering and it is measured here by Moran’s I.
It captures the extent of overall clustering that exists in a dataset. It is assessed by means of a test of
a null hypothesis of random location. Rejection of this null hypothesis suggests a spatial pattern or
spatial structure, which provides more insights into data distribution, that what a quartile map or box
plot does. For each variable, it measures the degree of linear association between its value at one
location and the spatially weighted average of neighboring values (Anselin et al. 2007; Anselin 1995)
and is formalized as follows:
∑ ∑ ̇
∑ ∑
(2)
Where ̇ is the (row-standardized) degree of connection between the spatial units i and j and is
the variable of interest in region i at year t (measured as a deviation from the mean value for that
year). Values of I larger (smaller) than the expected value E(I ) = −1/(n − 1) indicate positive (negative)
spatial autocorrelation.
5.3. Spatial Econometric Analysis
We explain spatial econometrics dimensions of economic lockdown of İstanbul and İzmir due to
Covid-19 or large magnitude earthquake. For this reason, spatial lag and spatial error models are
tested for the variables.
Spatial autocorrelation analysis is completed by means of composing spatial weights. Evaluation of
spatial autocorrelation is applied to ordinary least-squares regression. Maximum likelihood analysis is
used to measure spatial error and lag models (Anselin et al. 2006; Altay and Çelebioğlu, 2015) are the
two main types of spatial regression models.
According to the spatial lag model, the degree of dependent variable “a” at a region “X” is affected
by the degree of that same dependent variable at the bordering region “Y”. Beside the dependent
variable y in place i is affected by the independent variables in both place i and j. This is a statisticalexpression of “spatial spillover”. For instance, the rate of unemployment in a region may be affected
by the rate of unemployment at a bordering region. Following Anselin (2003), incorporates spatial
effects by including a spatially lagged dependent variable as an additional predictor:
(3)
where is spatially lagged dependent variable for weights matrix W , x is a matrix of observations
on explanatory variables, is a vector of error terms, is the spatial coefficient. If there is no spatial
dependence, and y does not depend on neighboring y values, = 0.
Figure: Spatial Lag Model (on left) and Spatial Error Model (on right)
Source: Spatial Structures in the Social Sciences, GeoDa: Spatial Regression,
https://s4.ad.brown.edu/Resources/Tutorial/Modul2/GeoDa3FINAL.pdf , Date Accessed: February
20, 2020.
Incorporates spatial effects through error term;
(4)
(5)
Where is the vector of error terms, spatially weighted using the weight matrix ( W ), is the spatial
error coefficient and is a vector of uncorrelated error terms. If there is no spatial correlation
between the errors, then =0.
The model then changes to:
(6)
According to (Anselin, 2005), spatial regression model selection begins considering the standard (i.e.,
not the robust forms) LM-Error and LM-Lag test statistics. If neither rejects the null hypothesis, stick
with the OLS results. It is likely that in this case, the Moran’s I test statistic will not reject the null
hypothesis either. If one of the LM test statistics rejects the null hypothesis, and the other does not,
then the decision is straightforward as well: estimate the alternative spatial regression model that
matches the test statistic that rejects the null. If LM-Error rejects the null, but LM-lag does not,
estimate a spatial error model, and vice versa. When both LM test statistics reject the null
hypothesis, proceed to the bottom part of the graph and consider the robust forms of the test
statistics. Typically, only one of them will be significant or one will be orders of magnitude more
significant than the other (e.g., p < 0.00000 compared to p < 0.03). In that case, the decision is
simple: estimate the spatial regression model matching the (most) significant statistic. In the rare
instance that both would be highly significant, go with the model with the largest value for the test
statistic.6. Findings
If a lockdown takes place in Istanbul and Izmir due to Covid-19, these mega-cities cannot purchase
goods and services from other provinces. In this case, a decrease will occur in the incomes of the
provinces other than these two mega cities. We can see this in OLS estimates. First, we can look at
the OLS estimates of Istanbul. In OLS regressions, the level of significance of independent variables in
regressions (p = 0.000) is quite high.
As seen in Table 3, the purchases (also including intra-İstanbul purchases) made by Istanbul from the
provinces within one year contribute 6.9% to the gross domestic product of those provinces. The
opposite can also be said. In other words, if the economy of Istanbul experiences a lockdown, the
gross domestic product of other provinces decreases by 6.9%.
Table 3: OLS Regression Results for İSTANBUL
----------
SUMMARY OF OUTPUT: ORDINARY LEAST SQUARES ESTIMATION
Data set : turkey81
Dependent Variable : LN_G Number of Observations: 81
Mean dependent var : 16.7372 Number of Variables : 2
S.D. dependent var : 1.10316 Degrees of Freedom : 79
R-squared : 0.242657 F-statistic : 25.312
Adjusted R-squared : 0.233070 Prob(F-statistic) :2.99171e-006
Sum squared residual: 74.6542 Log likelihood : -111.63
Sigma-square : 0.94499 Akaike info criterion : 227.26
S.E. of regression : 0.972106 Schwarz criterion : 232.049
Sigma-square ML : 0.921657
S.E of regression ML: 0.96003
-----------------------------------------------------------------------------
Variable Coefficient Std.Error t-Statistic Probability
-----------------------------------------------------------------------------
CONSTANT 16.6507 0.10937 152.242 0.00000
IST_BUY 0.0699846 0.0139104 5.03111 0.00000
-----------------------------------------------------------------------------
REGRESSION DIAGNOSTICS
MULTICOLLINEARITY CONDITION NUMBER 1.171648
TEST ON NORMALITY OF ERRORS
TEST DF VALUE PROB
Jarque-Bera 2 2.7328 0.25502
DIAGNOSTICS FOR HETEROSKEDASTICITY
RANDOM COEFFICIENTS
TEST DF VALUE PROB
Breusch-Pagan test 1 0.0868 0.76822
Koenker-Bassett test 1 0.0911 0.76275
============================== END OF REPORT ================================
According to Table 4, the purchases of goods and services from İzmir (including intra-Izmir purchases)
affect the gross domestic product of the provinces by 9%. Therefore, a lockdown process that İzmir
will experience can decrease the gross domestic product level of other provinces by 9%.Table 4: OLS Regression Results for İZMİR
----------
SUMMARY OF OUTPUT: ORDINARY LEAST SQUARES ESTIMATION
Data set : turkey81
Dependent Variable : LN_G Number of Observations: 81
Mean dependent var : 16.7372 Number of Variables : 2
S.D. dependent var : 1.10316 Degrees of Freedom : 79
R-squared : 0.254035 F-statistic : 26.9031
Adjusted R-squared : 0.244592 Prob(F-statistic) :1.61114e-006
Sum squared residual: 73.5326 Log likelihood : -111.017
Sigma-square : 0.930793 Akaike info criterion : 226.034
S.E. of regression : 0.964776 Schwarz criterion : 230.823
Sigma-square ML : 0.90781
S.E of regression ML: 0.952791
-----------------------------------------------------------------------------
Variable Coefficient Std.Error t-Statistic Probability
-----------------------------------------------------------------------------
CONSTANT 16.6257 0.109331 152.067 0.00000
IZ_BUY 0.090333 0.0174159 5.18682 0.00000
-----------------------------------------------------------------------------
REGRESSION DIAGNOSTICS
MULTICOLLINEARITY CONDITION NUMBER 1.220419
TEST ON NORMALITY OF ERRORS
TEST DF VALUE PROB
Jarque-Bera 2 1.8250 0.40152
DIAGNOSTICS FOR HETEROSKEDASTICITY
RANDOM COEFFICIENTS
TEST DF VALUE PROB
Breusch-Pagan test 1 2.9717 0.08473
Koenker-Bassett test 1 3.2450 0.07164
============================== END OF REPORT ================================
Although İzmir has a smaller economic volume than Istanbul, it has a greater impact on other
provinces through its acquisitions. The main reason for this can be attributed to the fact that intra-
Istanbul purchases are larger than intra-Izmir purchases.Table 5: OLS Regression Results with Weight Matrix (Dis_250) for İstanbul
----------
SUMMARY OF OUTPUT: ORDINARY LEAST SQUARES ESTIMATION
Data set : turkey81
Dependent Variable : LN_G Number of Observations: 81
Mean dependent var : 16.7372 Number of Variables : 2
S.D. dependent var : 1.10316 Degrees of Freedom : 79
R-squared : 0.242657 F-statistic : 25.312
Adjusted R-squared : 0.233070 Prob(F-statistic) :2.99171e-006
Sum squared residual: 74.6542 Log likelihood : -111.63
Sigma-square : 0.94499 Akaike info criterion : 227.26
S.E. of regression : 0.972106 Schwarz criterion : 232.049
Sigma-square ML : 0.921657
S.E of regression ML: 0.96003
-----------------------------------------------------------------------------
Variable Coefficient Std.Error t-Statistic Probability
-----------------------------------------------------------------------------
CONSTANT 16.6507 0.10937 152.242 0.00000
IST_BUY 0.0699846 0.0139104 5.03111 0.00000
-----------------------------------------------------------------------------
REGRESSION DIAGNOSTICS
MULTICOLLINEARITY CONDITION NUMBER 1.171648
TEST ON NORMALITY OF ERRORS
TEST DF VALUE PROB
Jarque-Bera 2 2.7328 0.25502
DIAGNOSTICS FOR HETEROSKEDASTICITY
RANDOM COEFFICIENTS
TEST DF VALUE PROB
Breusch-Pagan test 1 0.0868 0.76822
Koenker-Bassett test 1 0.0911 0.76275
DIAGNOSTICS FOR SPATIAL DEPENDENCE
FOR WEIGHT MATRIX : dis_250
(row-standardized weights)
TEST MI/DF VALUE PROB
Moran's I (error) 0.2051 5.3850 0.00000
Lagrange Multiplier (lag) 1 22.8481 0.00000
Robust LM (lag) 1 3.2364 0.07202
Lagrange Multiplier (error) 1 19.6255 0.00001
Robust LM (error) 1 0.0138 0.90635
Lagrange Multiplier (SARMA) 2 22.8620 0.00001
============================== END OF REPORT ================================
When Tables 5 and 6 are examined, it is seen that Spatial Lag Model comes to the fore as a result of
both regression analysis. Because the level of significance (p = 0.00002) of Lagrange Multiplier-LAG is
higher than that of Lagrange Multiplier-ERROR (p = 0.00062). For this reason, Spatial Lag Model is run
for both İstanbul and İzmir.Table 6: OLS Regression Results with Weight Matrix (Dis_250) for İzmir
----------
SUMMARY OF OUTPUT: ORDINARY LEAST SQUARES ESTIMATION
Data set : turkey81
Dependent Variable : LN_G Number of Observations: 81
Mean dependent var : 16.7372 Number of Variables : 2
S.D. dependent var : 1.10316 Degrees of Freedom : 79
R-squared : 0.254035 F-statistic : 26.9031
Adjusted R-squared : 0.244592 Prob(F-statistic) :1.61114e-006
Sum squared residual: 73.5326 Log likelihood : -111.017
Sigma-square : 0.930793 Akaike info criterion : 226.034
S.E. of regression : 0.964776 Schwarz criterion : 230.823
Sigma-square ML : 0.90781
S.E of regression ML: 0.952791
-----------------------------------------------------------------------------
Variable Coefficient Std.Error t-Statistic Probability
-----------------------------------------------------------------------------
CONSTANT 16.6257 0.109331 152.067 0.00000
IZ_BUY 0.090333 0.0174159 5.18682 0.00000
-----------------------------------------------------------------------------
REGRESSION DIAGNOSTICS
MULTICOLLINEARITY CONDITION NUMBER 1.220419
TEST ON NORMALITY OF ERRORS
TEST DF VALUE PROB
Jarque-Bera 2 1.8250 0.40152
DIAGNOSTICS FOR HETEROSKEDASTICITY
RANDOM COEFFICIENTS
TEST DF VALUE PROB
Breusch-Pagan test 1 2.9717 0.08473
Koenker-Bassett test 1 3.2450 0.07164
DIAGNOSTICS FOR SPATIAL DEPENDENCE
FOR WEIGHT MATRIX : dis_250
(row-standardized weights)
TEST MI/DF VALUE PROB
Moran's I (error) 0.1585 4.2486 0.00002
Lagrange Multiplier (lag) 1 18.1909 0.00002
Robust LM (lag) 1 7.8794 0.00500
Lagrange Multiplier (error) 1 11.7170 0.00062
Robust LM (error) 1 1.4055 0.23580
Lagrange Multiplier (SARMA) 2 19.5964 0.00006
============================== END OF REPORT ================================
For İstanbul and İzmir, Table 7 and 8 show Spatial Lag Model results. Table 7 displays that the Lag
coefficient (Rho)’s value is 0.509996 and it is highly significant (p=0.00156). This means that when
İstanbul's GDP and its purchases increase by one unit, the gross domestic product in the neighboring
provinces increases by 0.50%. If we say the opposite, when the GDP and purchases of Istanbul
decrease by one unit, the gross domestic product in the neighboring provinces will decrease by
0.50%.
As mentioned above, in the non-spatial OLS regression, the average contribution of Istanbul's
purchases to the gross domestic product in 81 provinces were almost 0.07.Table 7: Spatial Lag Model Results with Weight Matrix (Dis_250) for İstanbul
----------
SUMMARY OF OUTPUT: SPATIAL LAG MODEL - MAXIMUM LIKELIHOOD ESTIMATION
Data set : turkey81
Spatial Weight : dis_250
Dependent Variable : LN_G Number of Observations: 81
Mean dependent var : 16.7372 Number of Variables : 3
S.D. dependent var : 1.10316 Degrees of Freedom : 78
Lag coeff. (Rho) : 0.509996
R-squared : 0.355546 Log likelihood : -106.142
Sq. Correlation : - Akaike info criterion : 218.283
Sigma-square : 0.784275 Schwarz criterion : 225.467
S.E of regression : 0.885593
-----------------------------------------------------------------------------
Variable Coefficient Std.Error z-value Probability
-----------------------------------------------------------------------------
W_LN_G 0.509996 0.161258 3.16261 0.00156
CONSTANT 8.11352 2.69906 3.00605 0.00265
IST_BUY 0.0659439 0.0126923 5.19557 0.00000
-----------------------------------------------------------------------------
REGRESSION DIAGNOSTICS
DIAGNOSTICS FOR HETEROSKEDASTICITY
RANDOM COEFFICIENTS
TEST DF VALUE PROB
Breusch-Pagan test 1 0.0852 0.77040
DIAGNOSTICS FOR SPATIAL DEPENDENCE
SPATIAL LAG DEPENDENCE FOR WEIGHT MATRIX : dis_250
TEST DF VALUE PROB
Likelihood Ratio Test 1 10.9765 0.00092
============================== END OF REPORT ================================
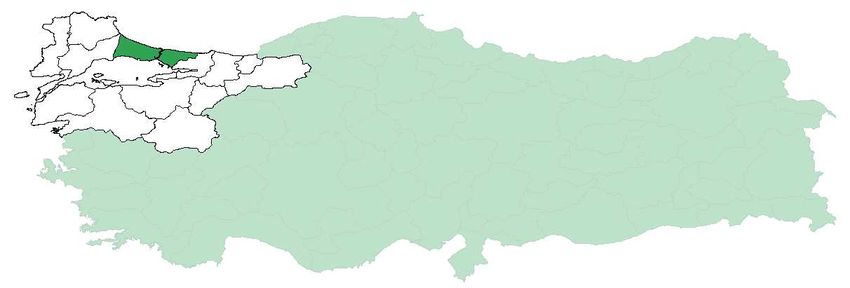
The neighboring provinces of İstanbul (see the Connectivity Map 1) mostly consist of crowded
industrial and touristic cities (Kocaeli, Bursa, Adapazarı, Tekirdağ, Balıkesir, Bilecik etc.). There is a
strong interaction among its neighbors and İstanbul. A lockdown to be implemented in İstanbul will
have huge negative economic impacts on the neighbors of this mega-city.
Connectivity Map 1: Neighbors of İstanbul (250 km)Table 8: Spatial Lag Model Results with Weight Matrix (Dis_250) for İzmir
----------
SUMMARY OF OUTPUT: SPATIAL LAG MODEL - MAXIMUM LIKELIHOOD ESTIMATION
Data set : turkey81
Spatial Weight : dis_250
Dependent Variable : LN_G Number of Observations: 81
Mean dependent var : 16.7372 Number of Variables : 3
S.D. dependent var : 1.10316 Degrees of Freedom : 78
Lag coeff. (Rho) : 0.461356
R-squared : 0.343793 Log likelihood : -106.655
Sq. Correlation : - Akaike info criterion : 219.311
Sigma-square : 0.798578 Schwarz criterion : 226.494
S.E of regression : 0.893632
-----------------------------------------------------------------------------
Variable Coefficient Std.Error z-value Probability
-----------------------------------------------------------------------------
W_LN_G 0.461356 0.172402 2.67604 0.00745
CONSTANT 8.90815 2.88155 3.09144 0.00199
IZ_BUY 0.0822562 0.0161626 5.08931 0.00000
-----------------------------------------------------------------------------
REGRESSION DIAGNOSTICS
DIAGNOSTICS FOR HETEROSKEDASTICITY
RANDOM COEFFICIENTS
TEST DF VALUE PROB
Breusch-Pagan test 1 4.0914 0.04310
DIAGNOSTICS FOR SPATIAL DEPENDENCE
SPATIAL LAG DEPENDENCE FOR WEIGHT MATRIX : dis_250
TEST DF VALUE PROB
Likelihood Ratio Test 1 8.7228 0.00314
============================== END OF REPORT ================================
Table 8 gives that Lag coefficient (Rho)’s value is 0.461356 and it is highly significant (p=0.00745).
This means that when İzmir's GDP and its purchases increase by one unit, the gross domestic product
in the neighboring provinces increases by 0.46%. If we say the opposite, when the GDP and
purchases of İzmir decrease by one unit, the gross domestic product in the neighboring provinces will
decrease by 0.46%.
As was told above, in OLS regression without spatial weights, the average contribution of Istanbul's
purchases to the gross domestic product in 81 provinces was only 0.09.
The neighboring provinces of İzmir (see the Connectivity Map 2) mostly consist of crowded industrial,
agricultural, touristic cities (Manisa, Bursa, Aydın, Muğla, Balıkesir, Denizli, Uşak etc.). There is a
strong interaction among its neighbors and İzmir. A lockdown to be implemented in İzmir will have
huge negative economic impacts on the neighbors of this mega-city.
Connectivity Map 2: Neighbors of İzmir (250 km)7. Conclusions
The Covid-19 epidemic both threatens people's lives and harms the economies of countries to an
unprecedented degree. Many economists try to calculate the size of the negative economic effects
and the burden of the measures taken. This study is intended to calculate what negative spatial
spillover economic effects may take place in a mega-city lockdowns due to an epidemic or other
reasons (for example, a large magnitude earthquake), unlike studies at the macroeconomic level.
Economic lockdown of a mega city with high production and consumption capacities will cause a
great economic loss not only to itself but also to its neighbors. With the decrease of the gross
domestic product of the cities, per capita income will decrease, unemployment will increase and
other problems will come along.
But the problems are not just about mega-cities and their neighbors. The damage caused by the
lockdown of a mega city will go beyond what we have calculated. Because, when supply chain is
broken, the damage will spread to the whole country starting from the neighbors of Istanbul and
Izmir. The speed of this spread in the country will also be very high.
When we consider Turkey's economic and regional conditions, the spillover economic costs of locking
a mega city is very high. But whatever the price, when/if necessary, public authorities should not
hesitate to lock a mega city or the whole country to protect human life since the price of a person's
life cannot be measured with money.
In the short term, apart from the financial steps and regulations that will be taken to cover the costs
of locking mega cities, another aspect of the issue comes up in the long term. In this point, another
dimension of the issue is related to regional economic inequalities and imbalances which have been
going on for many years in Turkey. Successful results have not been achieved in terms of reducing
the migration from the Eastern cities to the cities in the West and the economic development of
Eastern and South Eastern Anatolia.
Western Anatolian cities are more developed in terms of factors such as employment, production
and consumption capacity, qualified employees, etc. These dynamics pose a big problem both for the
rapid spread of the epidemic diseases and in the case of a potential lockdown. If regional inequalities
are reduced, potential negative effects of a lockdown will be much less.
In this context, more efforts should be made to eliminate regional inequalities and imbalances in
order to deal more effectively with similar potential threats that might arise in the coming years.
References
Açıkgöz Ö. and Günay A. (2020), “the Early Impact of the Covid-19 Pandemic on the Global and
Turkish Economy”, TUBITAK - Turkish Journal of Medical Sciences, Issue: 50, pp. 520-526,
doi:10.3906/sag-2004-6.
Akcigit U. and Akgunduz Y.E. (2020) “Geographic Propogation of Covid-19 Driven Demand Shocks in
Turkey”,https://static1.squarespace.com/static/5ea248ab088c8a2eba15d2d1/t/5eaa67134f
2f3e5a01d4fdd1/1588225812804/covid19_propogation.pdf , Date Accessed: May 01, 2020.
Altay H. & Çelebioğlu F. (2015) “The Impacts of Political Terrorism on Gross Domestic Product in
Eurasia: A Spatial Data Analysis”, Eurasian Journal of Business and Economics, 8(15), 21-37.
Anselin L. (1988) Spatial Econometrics: Methods and Models, Kluwer, Dordrecht.
Anselin L (1995) Local Indicator of Spatial Association–LISA, Geogr Anal, 27, 93–115.
Anselin, L. and Bera, A.K. (1998) Spatial Dependence in Linear Regression Models with an
Introduction to Spatial Econometrics, In: Handbook of Applied Economic Statistics, (Statistics:
A Series of Textbooks and Monographs), Editors: Aman Ullah and David E.A. Giles, 1st Edition,
CRC Press, pp. 237-289
Anselin L. (2003) Spatial Econometrics, In the book: A Companion to Theoretical Econometrics,
Editor: Badi H. Baltagi, Blackwell Publishing Ltd., DOI:10.1002/9780470996249.Anselin L. (2005) Exploring Spatial Data with GeoDa: A Workbook, Spatial Analysis Laboratory,
University of Illinois, Urbana-Champaign, http://sal.uiuc.edu/ and Revised Version at Center
for Spatially Integrated Social Science, http://www.csiss.org/, March 6, 2005.
Anselin L., Syabri I., Kho Y. (2006) “GoDA: An introduction to Spatial Data Analysis”, Geographical
Analysis, 38, 5-22.
Anselin L, Sridharan S, Gholston S (2007) Using Exploratory Spatial Data Analysis to Leverage Social
Indicator Databases: the Discovery of Interesting Patterns, Soc Indic Res, 82, 287–309.
Arezki R. and Nguyen H. (2020) “Novel Coronavirus Hurts the Middle East and North Africa through
Many Channels”, In Book: Economics in the Time of COVID-19 (Edited by Richard Baldwin and
Beatrice Weder di Mauro), CEPR Press, London, UK, pp.53-58.
Atkeson A. (2020) “What Will Be the Economic Impact of Covid-19 in the US? Rough Estimates of
Disease Scenarios”, Working Paper 26867, http://www.nber.org/papers/w26867, Date
Accessed: March 29, 2020.
Baldwin R. and Tomiura E. (2020) “Thinking Ahead About the Trade Impact of COVID-19”, ”, In Book:
Economics in the Time of COVID-19 (Edited by Richard Baldwin and Beatrice Weder di
Mauro), CEPR Press, London, UK, pp.59-71.
Beck T. (2020) “Finance in the Times of Coronavirus”, In Book: Economics in the Time of COVID-19
(Edited by Richard Baldwin and Beatrice Weder di Mauro), CEPR Press, London, UK, pp.73-76.
Celebioglu F. and Dall’erba S. (2010), “Spatial Disparities across the Regions of Turkey: An Exploratory
Spatial Data Analysis”, the Annals of Regional Science, Vol: 45(2), 379-400.
Celebioglu F. (2010) "Regional Disparity and Clusters in Turkey: A Lisa (Local Indicators of Spatial
Association) Analysis”, Dumlupınar University Journal of Social Sciences, 28, 35-48
Elgin, C., Basbug, G. and Yalaman, A. (2020) “Economic Policy Responses to a Pandemic: Developing
the COVID-19 Economic Stimulus Index”, In Book: Covid Economics: Vetted and Real Time
Papers, CEPR Press, London, UK, Issue 3, 40-54.
Entrepreneurial Information System of the Ministry of Industry and Technology,
https://gbs.sanayi.gov.tr/AnaSayfa.aspx , Date Accessed: April 25, 2020.
Export Numbers of Provinces, Turkish Exporters Assembly-TİM (2020),
https://www.tim.org.tr/en/export-export-figures , Date Accessed: April 25, 2020.
Fernandes N. (2020) “Economic Effects of Coronavirus Outbreak (COVID-19) on the World Economy”,
https://ssrn.com/abstract=3557504, Date Accessed: April 19, 2020.
Gezici F. and Hewings G.J.D. (2004) “Regional Convergence and the Economic Performance of
Peripheral Areas in Turkey”, Review of Urban & Regional Development Studies, Vol. 16, No.
2, pp.113-132.
Guliyev H. (2020) “Determining the Spatial Effects of COVID-19 Using the Spatial Panel Data Model”,
Spatial Statistics 38, 100443, https://doi.org/10.1016/j.spasta.2020.100443.
Guerrieri V., Lorenzoni G., Straub L. and Werning I. (2020) “Macroeconomic Implications of COVID-
19: Can Negative Supply Shocks Cause Demand Shortages?”, NBER Working Paper No. 26918,
April 2020, http://www.nber.org/papers/w26918 , Date Accessed: April 28, 2020.
Huang R., Liu M. and Ding Y. (2020) Spatial-Temporal Distribution of COVID-19 in China and Its
Prediction: A data-Driven Modeling Analysis”, the Journal of Infection in Developing
Countries, 14(3), pp.246-253, doi:10.3855/jidc.12585
https://tr.euronews.com/2020/04/03/turkiye-de-en-cok-koronavirus-covid-19-vakasinin-goruldugu-
10-kent, Date Accessed: April 25, 2020.
Inoue H. and Todo Y. (2020) “The Propagation of the Economic Impact through Supply Chains: The
Case of a Mega-City Lockdown against the Spread of COVID-19”,
https://ssrn.com/abstract=3564898, Date Accessed: April 20, 2020.Kang D., Choi H, Kim JH. and Choi J. (2020) “Spatial Epidemic Dynamics of the COVID-19 Outbreak in
China”, International Journal of Infectious Diseases, 94,pp. 96–102,
https://doi.org/10.1016/j.ijid.2020.03.076.
Lustig N. and Mariscal J. (2020) “How COVID-19 Could be Like the Global Financial Crisis (or Worse)”,
In Book: Mitigating the COVID Economic Crisis: Act Fast and Do Whatever It Takes (Edited by
Richard Baldwin and Beatrice Weder di Mauro), CEPR Press, London, UK, pp.185-190.
McKibbin W. and Fernando R. (2020/a) “The Economic Impact of COVID-19”, In Book: Economics in
the Time of COVID-19 (Edited by Richard Baldwin and Beatrice Weder di Mauro), CEPR Press,
London, UK, pp.45-51.
McKibbin W. and Fernando R. (2020/b) “The Global Macroeconomic Impacts of COVID-19: Seven
Scenarios”, CAMA Working Paper 19/2020, February 2020,
https://ssrn.com/abstract=3547729, Date Accessed: March 23, 2020.
Ozili P. and Arun T. (2020) “Spillover of COVID-19: Impact on the Global Economy”,
https://ssrn.com/abstract=3562570, Date Accessed: April 22, 2020.
Özatay F. And Sak G. (2020/a) “What Can We Do to Manage the Economic Consequences of COVID-
19?”, Economic Policy Research Foundation of Turkey (TEPAV), Policy Note: N202006,
April2020, https://www.tepav.org.tr , Date Accessed: April 24, 2020.
Özatay F. And Sak G. (2020/b) “COVID-19 Salgını Bir Değil, Bir Kaç Çeyrek Sürerse Ne Olur?”,
Economic Policy Research Foundation of Turkey (TEPAV), Policy Note: N202015, April2020,
https://www.tepav.org.tr , Date Accessed: April 23, 2020.
Özatay F. And Sak G. (2020/c) “ What If Turkey Imposes a Curfew Due To COVID-19”, Economic Policy
Research Foundation of Turkey (TEPAV), Policy Note: N202008, April2020,
https://www.tepav.org.tr , Date Accessed: April 24, 2020.
Population of Provinces by Years 2000-2019, Turkish Statistical Institute –TURKSTAT (2020),
http://www.turkstat.gov.tr/PreTablo.do?alt_id=1059 , Date Accessed: April 14, 2020.
Province based Gross Domestic Products, Turkish Statistical Institute –TURKSTAT,
http://www.tuik.gov.tr/UstMenu.do?metod=temelist , Date Accessed: April 15, 2020.
SEGE (2017) İllerin ve Bölgelerin Sosyo-Ekonomik Gelişmişlik Sıralaması Araştırması Raporu, (Edited
By: Salih ACAR, Dr. Leyla BİLEN KAZANCIK, Mustafa Caner MEYDAN, Mustafa IŞIK), Sanayi ve
Teknoloji Bakanlığı Kalkınma Ajansları Genel Müdürlüğü, Report Number: 3, Ankara, 2017.
Spatial Structures in the Social Sciences, GeoDa: Spatial Regression,
https://s4.ad.brown.edu/Resources/Tutorial/Modul2/GeoDa3FINAL.pdf, Date Accessed:
February 20, 2020.
Sumner A., Hoy C. and Ortiz-Juarez E. (2020) Estimates of the impact of COVID-19 on Global Poverty,
United Nations University, WIDER Working Paper 2020/43, April 2020,
https://doi.org/10.35188/UNU-WIDER/2020/800-9
Taymaz E. (2020) “Türkiye için bir ex ante politika etki analizi”, https://sarkac.org/2020/04/covid19-
tedbirlerinin-turkiye-ekonomisine-etkisi-cozum-onerileri/ , Date Accessed: April 08, 2020.
Toda A.A. (2020) Susceptible-Infected-Recovered (SIR) Dynamics of COVID-19 and Economic Impact,
arXiv:2003.11221v2 [q-bio.PE], 26 Mar 2020.
Voth J. (2020) “Trade and Travel in the Time of Epidemics”, In Book: Economics in the Time of COVID-
19 (Edited by Richard Baldwin and Beatrice Weder di Mauro), CEPR Press, London, UK, pp.93-
96.
WHO (2020) Situation Report – 102, https://www.who.int/emergencies/diseases/novel-coronavirus-
2019/situation-reports/, Date of Accessed: May 01, 2020.
Yigit A. (2020) “Are Covid-19 Cases Independent of the City Sizes?” MPRA Paper No. 99697,
https://mpra.ub.uni-muenchen.de/99697/ , Date Accessed: April 23, 2020.Appendix: Map for Locations and Names of the Provinces (totally 81) in Turkey
You can also read