Obtaining the Municipal GDP in Hidalgo. Regional polarization and economic imbalances.
←
→
Page content transcription
If your browser does not render page correctly, please read the page content below
https://repository.uaeh.edu.mx/revistas/index.php/jas/issue/archive
 Journal of Administrative Science
 Biannual Publication, Vol. 2, No. 4 (2021) 11-22
 ISSN: 2683-2119

 Obtaining the Municipal GDP in Hidalgo. Regional polarization and economic
 imbalances.
 Obtención del PIB municipal en Hidalgo. Polarización regional y desequilibrios económicos.

 Maximiliano Gracia Hernández1

Abstract:

Using economic indicators at municipal level is a nearly impossible task. National Institute of Statistics and Geography, Mexico, does
not offer statistics on municipal GDP. For this reason, the aim of this work was to obtain data disaggregated at the local level. The
main contribution of the research was to calculate the GDP in the 84 municipalities of the state of Hidalgo. The methodology proposed
by Luis Unikel was used to achieve this. This methodology argues that it is feasible, to obtain an index of personnel occupied by
municipality and, with it, to obtain a consistent series of panel data by municipalities. The Research prove with calculated estimates
and data for all municipalities.
Keywords:
Hidalgo economy; Gross Domestic Product; Municipal indicators; Polarization economic; Development opportunities.

Resumen:

Utilizar indicadores económicos a nivel municipal es una tarea casi imposible. El Instituto Nacional de Estadística y Geografía de
México no ofrece estadísticas sobre el PIB municipal. Por ello, el objetivo de este trabajo fue obtener datos desagregados a nivel local.
El principal aporte de la investigación fue calcular el PIB en los 84 municipios del estado de Hidalgo. Para ello se utilizó la
metodología propuesta por Luis Unikel. Esta metodología sostiene que es factible, obtener un índice de personal ocupado por
municipio y, con él, obtener una serie consistente de datos panel por municipios. La investigación prueba con estimaciones calculadas
y datos para todos los municipios.
Palabras Clave:
Economía de Hidalgo; Producto Interno Bruto; Indicadores municipales; Polarización económica; Oportunidades de desarrollo.

 of statistics, for example, of Gross Domestic Product at
 Introduction the municipal level, so it is almost impossible to assess
For those of us who reflect and research regional the municipal economic scenario in Mexico and answer
development issues in Mexico, we are concerned about the question: how are we in economic matters within
finding statistics and economic indicators that allow us to Mexican municipalities?
evaluate the economies of Mexican municipalities. As Sustained economic growth in a region, municipality or
they argument Corona F., (2019): …in order to produce locality provides the basis for steady and sustained social
economic information at the municipal level with welfare. Some variables considered as basic to increase
appropriate timing and sectorial breakdown —which social welfare are: the increase in GDP; increase in per
allows decision makers to generate economic-policies. capita income; technological changes; sustainable
 exploitation of natural resources; improving the quality of
While there are different geographical and social education and health; greater and better infrastructure;
indicators for diagnosing and assessing the environment, investment in research and development; development of
we also observe in the Mexican economic sphere the lack new innovations; etcetera.

1
 Colegio del Estado de Hidalgo. http://orcid.org/0000-0003-3174-8006
Correspondence with the author maximiliano@elcolegiodehidalgo.edu.mx ; graciamaximiliano@hotmail.com
________________________________________________________________________________________________________________

Received: 01/12/2020, Accepted: 01/09/2020, Published: 05/01/2021
 11
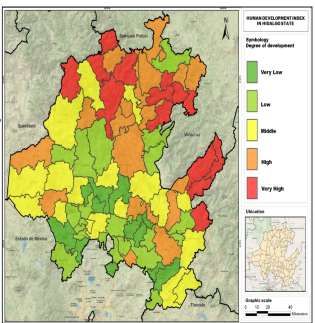
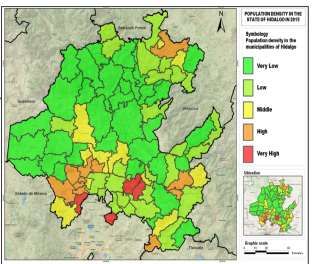
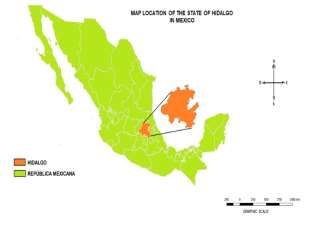
Biannual Publication, Journal of Administrative Science, Vol. 2, No. 4 (2021) 11-22

The objective of the research aims to obtain municipal Hidalgo is one of 31 states that, along with Mexico City,
GDP in the municipalities of the State of Hidalgo, a form Mexico's 32 federal entities. The state of Hidalgo has
Mexican region located in the center of the country. The 84 municipalities, its capital and most populated city is
study object is Hidalgo, because it is the place where is Pachuca de Soto. The state is located in the central-
located the research institution. eastern region of Mexico, has an area of 20,813 km2,
The initial concern to carry out the work was to determine because its geographical dimension Hidalgo ranks 26th in
the causes existing in the municipal and regional the Mexican republic, representing 1.06% of the national
polarization within the State of Hidalgo. Phenomenon that territory. As seen on map 1, Hidalgo adjoins to the north
is observed empirically in the municipalities, but without with the states of San Luis Potosí and Veracruz, to the
having indicators that allow scientifically to check what is east with the state of Puebla, to the south with the states
happening there. of Tlaxcala and Mexico, and to the west with the state of
The methodology used for the calculation of Hidalgo's Querétaro
municipal GDP was quantitative, INEGI statistics were
used and INEGI's 2014 Economic Census was The state of Hidalgo is composed of 84 municipalities and
considered as the basis. 3,474 localities (Sedesol, 2018), which are composed of
We make an approach to the discovery of indicators, different physical conditions; relief features; economy;
using information from the primary, secondary and tertiary social and cultural issues.
economic sectors at the municipal level. The methodology
used is accurate, because it is close to that used by the Sociodemographic characterization
National Institute of Statistics and Informatics of Mexico
(INEGI). According to the last available count (INEGI, 2015) the
The objective was to obtain and analyze the GDP state of Hidalgo has a population of 2´858,359; 2.4% of
generated in each of the 84 municipalities of Hidalgo. It is the country's total population. Of that population,
important to note that the original contribution of the 1'489,334 are women, and 1'369,025 are men. The
research lies in obtaining GDP in the municipalities of population distribution is: 52% urban and 48% rural.
Hidalgo and is that in Mexico there is no official data that The cities of the state considered as most important for
calculate this indicator. Disaggregated municipal GDP in their economic and social dynamism are: Pachuca de
Hidalgo represented a breakthrough to economic Soto, Tulancingo de Bravo, Tula de Allende, Tizayuca,
knowledge in that region. Exist the human development Tepeji del Río, Actopan, Apan, Huejutla de Reyes,
index at the municipal level, however, it is not a variable Ixmiquilpan and, Huichapan. With the exception of
that shows the GDP generated in a region. Huejutla, all designated municipalities are located in the
The work is divided into five sections, the first briefly south-central part of the state.
shows the characterization and physical,
sociodemographic, human development and As seen in map 2, in the southern part of the state there
infrastructure diagnosis in the state of Hidalgo, Mexico. is a high degree of concentration with more than 70% of
The second section presents the methodology used to the total population, which is equivalent to 2'000,851; in
obtain municipal GDP. The third one shows the results contrast, in the northern part there is a medium and low
obtained and the discussion generated; the fourth section population density per km2, in these municipalities only
demonstrates the existence of a strong economic 30% of the Hidalgo population is located.
polarization in the 84 municipalities of the state of Hidalgo.
The fifth section offers a reflection on the challenges and
 Characterization of human development
opportunities of the state of Hidalgo.
Reflecting on the importance of studies and research on
local and municipal issues is fundamental in economic The Human Development Index (HDI) for the state of
science, and that is that regional development needs new Hidalgo is high, 0.723 (UNDP, 2015), to note that the
strategies to attract investment; generate business municipalities of Tepehuacán de Guerrero, Xochiatipan,
competitiveness; identify and implement efficient and Yahualica, Huehuetla and Acaxochitlan have a low HDI,
effective public policy strategies; implement systemic particularly Tepehuacan, Calnali and the Mission are
competitiveness actions and improve the quality of life of municipalities that show the lowest HDI, as shown in map
people living in the areas farther away from the main 3, all municipalities with the lowest HDI are located in the
economic centers of Hidalgo. northern part of the feature. In contrast to the above, 19
 municipalities located in the southern part of the state
 have the highest HDI. Specifically, it is detected that
 Characterization of the state of Hidalgo
 Mineral de la Reforma, Pachuca de Soto, Mineral del

 12
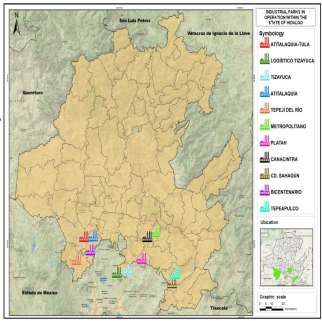
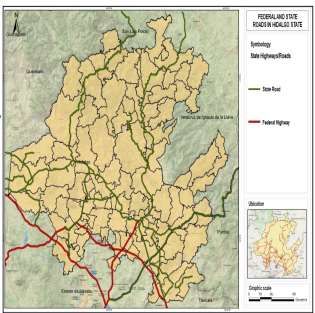
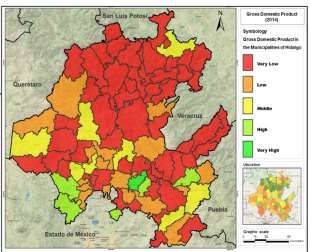
Biannual Publication, Journal of Administrative Science, Vol. 2, No. 4 (2021) 11-22

Monte and Tizayuca, are the municipalities with the estimator of municipal GDP. It is important to show that
highest state HDI (COESPO, 2010). this disaggregation has a set of important formative
 assumptions that are not necessarily true, as is the fact
Road Infrastructure Characterization that the average and marginal product of the work is
 constant, and that the aggregate production function is of
The state of Hidalgo has a road length of 11,573 km; type Leontief; however, even with these limitations, the
864.7 km of railways, a national airport and two airfields. efficiency of the estimates generated in this research is
As seen in map 4, there is a polarization in road shown, which, by obtaining the sum of the municipal GDP
infrastructure, the northern part of the state has low- of each of the 84 municipalities of the state, is almost
quality roads, in contrast, the southern part of the state is accurately close to the GDP data of Hidalgo calculated by
federal and quota road passage with adequate conditions, INEGI for the year 2013 and published in the economic
in addition most of the they are four-lane. censuses of 2014.

Industrial characterization Formula 1 was used to achieve the objective:

As detected on map 5, there is a strong polarization in

 1) PIBM = (∑ ) +
Hidalgo in the location of industrial parks, all located in the
southern part of the state, particularly in the municipalities
of Tepeapulco, Mineral de la Reforma, Villa de Where, POij-population occupied by economic activity
Tezontepec, Atitalaquía, Atotonilco de Tula, Tizayuca y, and municipality; POEi-state-occupied population by
Tepejí del Rio. This is a key part of polarized economic economic activity; VABEi-gross state value added by
growth. The generation of jobs originates mainly in the economic activity; GROSS domestic product by economic
southern part of the state, this generates migration from activity and municipality; IPNi- net income taxes by
the municipalities in which the industry does not arrive. economic activity. I=1,2,3,4. . . n (Economic Activity
 Sector). J=1,2,3,4. . . n (municipality number).
 Research methodology
 Results and discussion
Determining the GDP contribution of each of the 84
municipalities of Hidalgo is an urgent and necessary task, This section refers to essentially quantitative data on the
and is that today, in the process of competition and economy of the state of Hidalgo, the purpose is to have a
globalization, they compete are the regions and dimensioning of reality, which reflects the nature,
municipalities, therefore an original contribution of this peculiarity and links that originate from economic
research is framed in the determination of the GDP of the activities and processes, based on the results obtained
84 municipalities of Hidalgos, these statistics are not so with the methodology used.
far calculated and therefore implies a challenge to their
determination for those who work and investigate Main municipalities for contribution to state
economic issues of local development.
 GDP
There are some studies and methodologies that try to
 Based on the application of the methodology indicated
obtain GDP at the municipal level, works such as:
 above and, based on the use of the 2014 economic
Aguilera, M. Et al (2020); Rojas, S., Hugo Roberto (2012).
 censuses, the results shown in map 6 were obtained. It
To obtain the disaggregated data at the municipal level,
 shows the contribution of the municipalities to GDP of
this research is based on Unikel et. al (1976), this
 Hidalgo state. Stands out Pachuca de Soto, a municipality
methodology argues that it is feasible, with a few training
 with a high contribution to the GDP generated, follows in
assumptions, to obtain an index of personnel occupied by
 importance for contributing to the GDP of the state
municipality and, with it, to obtain a consistent series of
 Tulancingo de Bravo; Mineral de la Reforma, Tizayuca,
panel data by municipalities, which can be an efficient
 Tula de Allende and Tepeji del Rio. All the above
indicator of a physical volume index, on which the state
 mentioned municipalities are located in the southern part
value added can be interpolated, in order to separate the
 of the state. In contrast, there are municipalities whose
component from the state value added, in order to
 contribution to the GDP generated are of the lowest:
separate the component municipal participation within the
 Eloxochitlán, Juárez Hidalgo, Xochicoatlán, Pacula,
state. With this element, it is feasible to separate the
 Nicolás Flores and La Misión, the municipalities
municipal share in the formation of state GDP. Which will
be the panel data series that will contain an efficient

 13
Biannual Publication, Journal of Administrative Science, Vol. 2, No. 4 (2021) 11-22

mentioned above are located in the northern region of the with the least contribution to the state's GDP generated
state. only 7.9% of the total GDP

Huejutla de Reyes is the only municipality located in the Pachuca, a leading municipality in the state
northern region of the state with a GDP above the state economy
average, the rest of the municipalities located in the
northern part of the state show low or very low economic Pachuca de Soto maintains a very high share within the
growth. state economy, providing 13.6% of state GDP. The
 municipality is characterized by its strength in the services
Important to note that the proximity to Mexico City and the sector, it contributed to municipal GDP 27,648 million
industrial zone of the state of Mexico does not necessarily pesos, which is equivalent to 78.41% of municipal GDP.
guarantee high levels of growth, and it is that, if you look Pachuca is a municipality of services and represents a
at map 6, of the eleven municipalities adjoining the state leading economy in Hidalgo, its economic growth is a
of Mexico, only three of them show high levels of growth, great determinant of the GDP generated in Hidalgo, this
the rest offer low or very low economic growth. In addition, municipality is the only one to generate more than 13% of
it is worth noting that, of the seven neighboring the state GDP.
municipalities with the state of Querétaro, none of them
offers high economic growth, in the case of Huichapan is The municipality has very interesting and important
shown an average growth, Tecozautla and Zimapán offer competitive advantages for the state economy, for
low growth; the rest of the municipalities have very low example, young population with good educational level,
growth. Based on the above, the lack of industrial chains strategic location; public safety; universities and research
of the municipalities of Hidalgo, adjoining other states that centers, the largest offer of services and infrastructure,
show high economic growth, can be inferred; an good business environment, strategic geographical
opportunity that has so far not been exploited to generate location, etc. Variables that partly allow it to have
economic osmosis in each of the Hidalgo´s regions. economic importance within the state.

As seen in map 6, there are six municipalities that have The municipality of Pachuca de Soto contributed to the
high and very high GDP, highlight Pachuca de Soto, GDP of the state more than the rest of the 83
Mineral de la Reforma, Tizayuca, Tepeji, Tula de Allende municipalities. In 2014, Pachuca de Soto contributed to
and Tulancingo, all located in the southern part of the GDP 27,648 million pesos, followed in importance
state; in contrast, almost all municipalities located in the Tulancingo de Bravo with 18,461 million pesos and
northern part of the state show a low or very low Mineral de la Reforma with 17.281 million pesos.
contribution to state. Pachuca de Soto represents the largest economy of the
 State, however, the challenges are broad, for example, it
When considering GDP by municipalities in the state of is necessary to generate greater innovative projects that
Hidalgo, we realized the strong polarization existing in will strengthen the project called: "Pachuca, city of
GDP generation: Pachuca de Soto, Tulancingo de Bravo, knowledge and culture"; attracting companies,
Mineral de la Reforma, Tizayuca, Tula de Allende and commercial relations with foreigners, strengthening and
Tepeji del Rio de Ocampo were the municipalities with the implementing ecological zones for the city, etc.
greatest contribution to GDP during 2014, contributed
40.1% to the state's. The rest of the GDP is contributed
 Tulancingo de Bravo. Second municipality in
by the remaining 78 municipalities.
 economic importance
Of the six municipalities mentioned above: Mineral de la
Reforma; Tizayuca; Tula de Allende and Tepeji del Rio Tulancingo contributed 7.13% to state GDP; the main
have industrial parks, this shows a relationship between economic sector is the tertiary sector, which contributes
industrial infrastructure and contribution to the GDP of the 68% to the economy; is followed in importance by
state. secondary with 30.72%.
If we consider the GDP generated by the main fifteen Tulancingo has eleven tianguis, two Diconsa stores, and
municipalities (out of a total of 84), these generated 60.5 eight Liconsa dairy; four public markets, a slaughterhouse
percent of the state, in addition to considering that all of and a Wholesale Market, this allows a good distribution of
them (with the exception of Huejutla, Ixmiquilpan and food for the whole region as it is a municipality near the
Huichapan) are located in the south of the State. In Sierra Gorda, which provides food to the Wholesale
contrast to the above, it is found that the 30 municipalities Market located in that municipality.

 14
Biannual Publication, Journal of Administrative Science, Vol. 2, No. 4 (2021) 11-22

The PEA of the municipality amounts to 66,937 people, of In Tizayuca there is an industrial park within which there
whom 61,894 are occupied and 5,043 are unoccupied. are different types of industries, highlight the dairy
Tulancingo's economy is based on the tertiary sector, industry; concrete railway sleepers, resins and chemicals,
however, the secondary sector has strengths, particularly luminous profiles, paints and solvents, integral kitchens,
with its textile and clothing industry. Tulancingo plastics and die-cuttings, commercial furniture and
contributes 16.5% to the state's GDP, highlighted for its equipment, structures, ceramics, clothing, glass
contribution to state, the secondary sector with 6.4% and packaging, asphalt emulsions, soaps, pumps, water
the tertiary with 7.8%. proofers and hardware.
 Tizayuca represents an important region in industrial
Mineral de la Reforma. Third municipality for matters, it is one of the main municipalities attracting
economic importance. industries; the experience of its workforce brings about
 50,000 workers to its industrial zone; close to the state of
 Mexico and Mexico City: the communications
This municipality contributes 6.68% to the GDP of the
 infrastructure there installed and the industrial park built
state; is important in the municipal economy to tertiary
 ex profeso for the development of manufactures are
sector, which contributes 79% and the secondary sector
 important elements for the origin and municipal
20.8%.
 development. However, the competitive and comparative
The municipality has an industrial park in which different
 advantages mentioned above keep it as the sixth state
types of industries are located, particularly manufactures.
 economy.
As far as trade is concerned, there are 10 tianguis, and
thirteen Liconsa stores; four markets and a municipal
slaughterhouse. Sixth municipal economy: Tepeji del Rio de
According to figures from the INEGI Economic Census, Ocampo
the municipality's PEA amounted to 68,314 people, of
whom 56,230 are occupied and 12,084 unoccupied. It is The municipality participates in the contribution to state
a municipality adjoining the capital of the state, is part of GDP 3.97%, has importance in the municipal economy
the metropolitan area of Pachuca, and is important for the the secondary sector, which generates 50.86% for the
industrial park there installed. economy, and the tertiary sector 48.02%.
 This municipality stands out for its strength in the
Tula de Allende: Fourth municipality for manufacturing industry, however, it has not been able to
 take advantage of its geographical location and, is that the
contribution to GDP.
 Municipality of Tepeji del Río is located in the south west
 area of the State, represents an obligatory step to reach
Its share of state GDP is 4.32%. The tertiary sector, which
 the north of the country through the important Mexico-
contributes 57% and 40.98% to the Hidalgo economy, is
 Querétaro highway, which crosses the municipality and
important in the municipal economy. In the municipality
 connects with two of the most important industrial areas
there are industries of transformation, extractives,
 of the country: the industrial zone of Querétaro and the of
construction, and maquiladoras.
 State of Mexico; it is also important its strategical location,
The most important industries are: the Francisco Pérez
 close to the largest market in the country. However, the
Ríos Thermoelectric Plant and the Petróleos Mexicanos
 comparative advantages of its geographical location have
Miguel Hidalgo refinery, the Tula, the Cruz Azul
 not been used to improve its economic environment.
Cementera Factory and the Tolteca.
As for the oil industry, the Miguel Hidalgo refinery is
installed. It is one of the main municipalities that Economic polarization in Hidalgo
contribute to the secondary sector of the state economy
 In contrast to the municipalities previously analyzed;
 highlight Eloxochitlán; Juarez Hidalgo; Pacula; Nicolás
Fifth municipality in economic importance:
 Flores; Xochicoatlán; and La Mision, municipalities with
Tizayuca the least contribution to state GDP, however, have a high
. degree of marginalization, which can be explained by
The municipality contributes 4.40% to the state GDP, the three variables: municipal public expenditure; remittances
tertiary sector has importance in the economy of the received and undeclared income.
municipality, contributes 61.76% and the secondary
sector 37.80%. It has four tianguis, two Diconsa stores a) Eloxochitan. The municipality contributes 0.04%
and 10 Liconsa dairy shops; plus three public markets, to the state GDP, as would be logical in this type
and a slaughterhouse. of municipalities, none of its sectors has

 15
Biannual Publication, Journal of Administrative Science, Vol. 2, No. 4 (2021) 11-22

 importance in the state economy. The degree of population of 15 years or more without
 marginalization in Eloxochitlán is average, which elementary education (28.29 municipal versus
 is explained from four variables compared to the 18.13 state); 2) Homes with some level of
 state average: 1) population of 15 years or more overcrowding (35.54 municipal vs. 28.17 state);
 without elementary education (30.95 in the 3) Income with up to two minimum wages (69.2
 municipality against 18.13 in the state); 2) municipal vs. 46.22 state); 4) marginalization rate
 Homes with some level of overcrowding (30.46 (0.08004 municipal vs. 0.4955 state) (CONAPO,
 municipal vs. 28.17 state); 3) Income with up to 2015).
 two minimum wages (70.5 municipal vs. 46.22
 state); 4) marginalization rate (0.06158 municipal
 vs. 0.4955 state) (CONAPO, 2015). f) The municipality of La Misión contributes 0.17%
 to the state GDP, presents a high degree of
 marginalization, this is explained from four
b) The municipality of Juárez Hidalgo participates in variables compared to the state average: 1)
 state GDP with 0.06%, the degree of population of 15 years or more without
 marginalization in Juárez Hidalgo is average, elementary education (42.63 municipal versus
 which is explained from four variables compared 18.13 state); 2) Homes with some level of
 to the state average: 1) population of 15 years or overcrowding (35.16 municipal vs. 28.17 state);
 more without elementary education (34.88 3) Income with up to two minimum wages (61.13
 municipal versus 18.13 state); 2) Homes with municipal vs. 46.22 state); 4) marginalization rate
 some level of overcrowding (27.58 municipality
 (1,03465 municipal vs. 0.4955 state) (CONAPO,
 vs 28.17 state); 3) Income with up to two
 2015).
 minimum wages (59.17 municipal vs. 46.22
 state); 4) marginalization rate (-0.02514
 municipal vs. 0.4955 state) (CONAPO, 2015). As shown in map 6, the municipalities with the lowest
 contribution to the state's GDP are: Eloxochitlán, Juárez
c) Pacula participates with 0.14% of state GDP, has Hidalgo, Xochicoatlán, Pacula, Nicolás Flores, and La
 a high degree of marginalization, which is Misión. The characteristic among them, in addition to their
 explained from four variables compared to the low contribution to GDP, is the neighborhood with a
 state average: 1) population aged 15 years or common border (with the exception of Pacula and La
 over without elementary education (38.82 Mission).
 municipal versus 18.13 state); 2) Homes with
 some level of overcrowding (32.12 municipal vs. As noted in Table 1, not necessarily a low degree of
 28.17 state); 3) Income with up to two minimum contribution to the GDP of the state generates a high
 wages (54.66 municipal vs. 46.22 state); 4) degree of marginalization, it is the case of Eloxochitlán;
 marginalization rate (0.38061 municipal vs. Juárez Hidalgo and Xochicoatlán, is probably the result of
 0.4955 state) (CONAPO, 2015). the supports and social development programs received
 by the government; remittances from abroad and the
 commitment of its people to development.
d) Nicolás Flores participates in the contribution to
 state GDP with 0.14%. It has a high degree of The information presented confirms the strong economic
 marginalization, which is explained from four inequalities between municipalities. The difference in
 variables compared to the state average: 1) GDP between the poorest municipality, Eloxochitlán, and
 population 15 years or older without elementary the richest, Pachuca de Soto, is expressed by a difference
 education (29.33 municipal versus 18.13 state); of 313 times.
 2) Homes with some level of overcrowding (27.4 How have well-evolving municipalities base their growth?
 municipal vs. 28.17 state); 3) Income with up to The answer lies in the strength of the secondary and
 two minimum wages (69.57 municipal vs. 46.22 tertiary sector, particularly construction, manufacturing,
 state); 4) marginalization rate (0.32113 municipal transport, communications, warehousing and financial
 vs. 0.4955 state) (CONAPO, 2015). services. Given the multiplier effects it has on the rest of
 the production sectors, construction has been a nodal
 part.
e) The municipality of Xochicoatlán contributes
 Sector analysis shows the state's approach. It is noted
 0.13% to the state GDP, has an average degree
 that the tertiary sector represents the main economic
 of marginalization, which is explained from four
 activity generating 61.67% of the state's GDP, the
 variables compared to the state average: 1)

 16
Biannual Publication, Journal of Administrative Science, Vol. 2, No. 4 (2021) 11-22

secondary sector contributes 34.12% and the primary make it a region with easy connectivity to other major
sector 4.20%. cities of the country.
In 71 municipalities the tertiary sector stands out and in
thirteen municipalities stands out for its contribution to By region and municipalities, for example, there is the
municipal GDP the secondary sector. That is why we possibility of creating a dairy basin in the municipality of
confirm Hidalgo as a state with greater strengthening Tizayuca. In Huasteca there are producers of fruits and
within the tertiary sector, this represents an economic risk vegetables, which can be organized to generate
as this sector is a generator of low added value and, productive chains and with it give added value to the
therefore, of state GDP with strength and consistency in products that are planted and harvested there.
the long term. Hidalgo has important companies within the mechanical
If we consider the GDP per municipal capita, based on the metal branch, stands out internationally renowned
data generated by this research, a strong polarization is companies such as: Dina-Camiones, Bombardier
detected between the 84 municipalities of the state, the Transportation, Gunderson-Concarril. Companies that
10 municipalities with the highest GDP per capita are: can be provided with services and supplies through small
Zapotlán de Juárez (132,073); Pachuca (127,116); and medium-sized firms.
Actopan (124,784); Atitalaquia (118,678); Tepejí del Río The existence of cement companies in the state (Cemex
(117,560); Progreso de Obregón (116,168); Santiago and Cruz Azul), make the entity the first in Mexico by the
Tulantepec (115,799); Mineral de La Reforma (115,075); number of cement plants installed. In addition to this,
Tulancingo de Bravo (114,616); Mineral del Monte Hidalgo is characterized by being a mining economy, it
(114,334). In contrast to the above, the municipalities with has companies like Real del Monte y Pachuca and the
the lowest levels of GDP per capita within the state are: company Minera Autlan.
Xochiatipan (28,982); Yahualica (31,844); Tepehuacan In the textile and clothing industry, particularly in the
de Guerrero (35,072); Tianguistengo (39,150), Calnali Municipality of Tulancingo, this industry is important in
(41,227); Eloxochitlán (42,222); Huehuetla (42,545); La which bedding, clothing, cotton yarn and synthetic fibers,
Misión (42,569); Xochicoatlán (43,916).above, the flat fabrics, etc. are produced. Based on Hidalgo's
municipalities with the lowest levels of GDP per capita historical career within this industry, there is currently the
within the state are: Xochiatipan (28,982); Yahualica National Center for Textile-Dress Innovation, located in
(31,844); Tepehuacan de Guerrero (35,072); Ciudad del Conocimiento y la Cultura (The City of
Tianguistengo (39,150), Calnali (41,227); Eloxochitlán Knowledge and Culture).
(42,222); Huehuetla (42,545); La Mision (42,569); Emphasize the construction in the municipality of Apan of
Xochicoatlán (43,916). a bottler of the Modelo group, with an investment of 14
 billion pesos and the creation of 1,200 direct jobs.
Figure II shows the five municipalities with the highest Emphasize the competitive and comparative advantage
GDP per capita, in contrast to the five municipalities with that several municipalities of Hidalgo have at tourist offer,
the lowest GDP per capita, we can see that the difference highlight the archaeological areas, the water parks, the
between the highest and lowest is 103 thousand pesos. adventure tourism, the mining and fishing districts, the
 magical villages, etc., all they are located at different
 points of the state and are a fundamental element in
 Challenges and opportunities
 detonating economic growth within the different Regions
 of Hidalgo.
This section aims to detect the main potentials, limitations
and problems that exist to detonate the growth and
economic development of the Territory of Hidalgo State. Final Reflections
Hidalgo is a state with great challenges, but also with
huge opportunities, for example, its strategic position Beyond the determination of the municipal growth
makes it a privileged region, the entity is located a few indicators obtained in this research, a polarization
kilometers from the main trading center of the country, the between the state's municipalities is observed in Hidalgo.
city of Mexico; major industrial cities near the state capital, This could be the result of different factors within which
for example: Mexico City at 91.9 km; Tlalnepantla at 95.5 they stand out: rugged physical conditions in the northern
km.; Naucalpan at 99.4 km.; Puebla at 148 km.; Toluca at part of the state, in contrast to the plains and wide valleys
172 km.; Querétaro is 224 km from the property. of the southern part of the state; regional and municipal
Polytechnic and technology universities are available; polarization in existing infrastructure, particularly in
research centers; young and skilled labor, et cetera. communications, industries and services.
Hidalgo is a state with excellent connectivity to the main Polarized regions imply a continuation of existing
ports of the country, has highways and federal roads that fragmentation. This leads to regions with high growth

 17
Biannual Publication, Journal of Administrative Science, Vol. 2, No. 4 (2021) 11-22

versus regions showing mediocre growth and
development.
INEGI (2014) evidence the polarization between the south
and north of the state of Hidalgo, some of them are
unemployment; emigration; low-quality educational
offering; insufficient health centers; poor communications
infrastructure; high marginalization rates; etcetera. Based
on the above, there is the origin and conditions for the
existence of regional imbalances in the state.
The objective of the research, although it was to obtain
the municipal GDP of Hidalgo, this did not limit the
concern to affirm the need to break with the polarization
existing in the state, for this a number of public policy
strategies are required, infrastructure, which breaks the
negative spiral of poverty, marginalization and
underdevelopment in the different municipalities of
Hidalgo.

Haga clic o pulse aquí para escribir
texto.

 Annex 1

 Map 1. Location of the state of Hidalgo in
 Mexico

 Source: Own elaboration based on Digital Map of
 Mexico, INEGI (2018). Using the ArcGIS program

 18
Biannual Publication, Journal of Administrative Science, Vol. 2, No. 4 (2021) 11-22

Map 2. Population density in the
municipalities of Hidalgo.

Source: Own elaboration with population and
housing count 2015 data.
INEGI (2015). Using the ArcGIS program

 19
Biannual Publication, Journal of Administrative Science, Vol. 2, No. 4 (2021) 11-22

Map 3. Human Development Index in Hidalgo Map 4. Federal and state roads in Hidalgo
State state

 Source: Own elaboration based on Secretary of
 Communications and Transport (2017). General
 direction of roads. Using the ArcGIS program
Source: Own elaboration with data from municipal
(2010). Using the ArcGIS program

 20
Biannual Publication, Journal of Administrative Science, Vol. 2, No. 4 (2021) 11-22

Map 5. Location of industrial parks in Hidalgo
state
 Source: Elaboration based on own indicators
 generated from Economic Census, INEGI (2014).
 Using the ArcGIS program

 Figure 2:
 GDP per municipal capita in Hidalgo
 Municipalities with higher and lower
 indicator

 140000
 120000
 43,916
 42,569
 42,546
 42,223
 41,227
 39,151
 35,073
 100000

 31,266
 30,845
 28,982
 132,074
 127,117
 124,784
 118,679
 117,560
 116,169
 115,800
 115,075
 114,616
 114,334

 80000
 60000
 40000
 20000
 0

 Más bajos Más altos
Source: Own elaboration based on Economic and
State Information, Secretariat of the Economy
(S/F). Using the ArcGIS program. Source: Own elaboration based on data
 generated in the research and Intercensal survey
Map 6. Gross Domestic Product in the INEGI (2015).
Municipalities of Hidalgo (2014)

 Referencias
 [1] Aguilera, M. Et al (2020) ¿Cambia la productividad en el territorio? Una
 propuesta metodológica para la estimación del PIB urbano en la

 21
Biannual Publication, Journal of Administrative Science, Vol. 2, No. 4 (2021) 11-22

 economía española, in Investigaciones Regionales ISSN 1695-7253, http://www.sedesol.gob.mx/work/models/SEDESOL/Programas_Socia
 Nº. 47, págs. 79-95 les/OpcionesProductivas/MapaTematico/CoberturaNacional201
[2] COLEH 2014. "Hidalgo Territorial Planning Plan" (Plan de [19] SIAP, (Agri-Food and Fisheries Information Service 2015. "Sowing
 Ordenamiento Territorial de Hidalgo), Working Paper s/n, Hidalgo and Harvesting" National summary by state, [online]
 State College, Hidalgo, Mexico http://infosiap.siap.gob.mx:8080/agricola_siap_gobmx/AvanceNacion
 alCultivo.do
[3] COESPO (State Population Council) 2010. "Municipal Human
 Development Index of Hidalgo" (Índice de desarrollo Humano [20] Unikel L. et al. 1978. Mexico's urban development: diagnostics and
 Municipal), Hidalgo, México, [online] future implications,[online] http://www.cervantesvirtual.com/obra/el-
 http://poblacion.hidalgo.gob.mx/?p=1528 desarrollo-urbano-de-mexico-diagnostico-e-implicaciones-futuras-
 924525/
[4] CONAPO (National Population Council) 2015. "Hidalgo Index and
 Degree of Marginalization", [online]
 http://poblacion.hidalgo.gob.mx/?p=1409
[5] Corona, F., Jesús López (2019), Obteniendo indicadores de actividad
 económica municipal basados en información representativa de los
 Censos Económicos, Revista Realidad, datos y espacio, INEGI, Vol. 10,
 Núm. 2, mayo-agosto.
[6] Moreno L. (2013) Cálculo del PIB Municipal para el Estado de Sonora.
 Revista Auditoría Gubernamental No. 32 (julio-septiembre).
[7] INEGI (National Institute of Statistical Geography and Computer
 Science) 2018. "Digital Map of Mexico" [online]
 http://gaia.inegi.org.mx/mdm6/?v=bGF0OjIzLjMyMDA4LGxvbjotM
 TAxLjUwMDAwLHo6MSxsOmMxMTFzZXJ2aWNpb3N8dGMxMT
 FzZXJ2aWNpb3M
[8] INEGI (a) (National Institute of Statistical Geography and Computer
 Science) 2016. "Mexico in numbers", [online]
 https://www.inegi.org.mx/app/areasgeograficas/?ag=13.
[9] INEGI, (National Institute of Statistical Geography and Computer
 Science) 2016. "GDP federal entity", [online]
 http://www.inegi.org.mx/est/contenidos/proyectos/cn/pibe/
[10] INEGI (National Institute of Statistical Geography and Computer
 Science) 2015. "Main Results of the 2015 Hidalgo Intercensal Survey",
 [online]
 http://internet.contenidos.inegi.org.mx/contenidos/Productos/prod_ser
 v/contenidos/espanol/bvinegi/productos/nueva_estruc/inter_censal/esta
 dos2015/702825079789.pdf
[11] INEGI (National Institute of Statistical Geography and Computer
 Science) 2014. Economic Census, [online] Available:
 http://www.inegi.org.mx/est/contenidos/proyectos/ce/ce2014/default.a
 spx
[12] INEGI (National Institute of Statistical Geography and Computer
 Science) 2014. Estructura económica de Hidalgo.
[13] Rojas, S., Hugo Roberto (2012). Una década de participación del
 Producto Interno Bruto de Puerto Vallarta al estado de Jalisco, 2000-
 2009, revista Investigación y Ciencia, vol. 20, núm. 54, enero-abril, pp.
 30-39
[14] UNDP (United Nations Development Programme) 2015. "Human
 Development Index for Federal Entities, Mexico 2015", [online]
 http://www.mx.undp.org/content/dam/mexico/docs/Publicaciones/Publ
 icacionesReduccionPobreza/InformesDesarrolloHumano/PNUD_bolet
 inIDH%20final.pdf
[15] SCT (Secretary of Communications and Transport) 2017. "National
 Road Conservation Program 2017" [online]
 http://www.sct.gob.mx/carreteras/direccion-general-de-conservacion-
 de-carreteras/avance-del-programa-de-obra-2017/hidalgo/
[16] SE (Secretary of Economy) 2018. "PROMÉXICO Investment and
 Commerce", [online]
 http://mim.promexico.gob.mx/work/models/mim/Documentos/PDF/mi
 m/FE_HGO_vf.pdf
[17] SE (Secretary of Economy) S/F. "Economic and State Information.
 Hidalgo", [online]
 https://www.gob.mx/cms/uploads/attachment/file/124836/hidalgo.pdf
[18] SEDESOL (Secretariat for Social Development) 2018. "National State
 Directorate-General Management of Productive Options", [online]

 22
You can also read


