Stage 2 Registered Report: Anomalous perception in a Ganzfeld condition - A meta-analysis of more than 40 years investigation version 1; peer ...
←
→
Page content transcription
If your browser does not render page correctly, please read the page content below
F1000Research 2021, 10:234 Last updated: 08 SEP 2021

RESEARCH ARTICLE

Stage 2 Registered Report: Anomalous perception in a
Ganzfeld condition - A meta-analysis of more than 40 years
investigation [version 1; peer review: awaiting peer review]
Patrizio E. Tressoldi              1,   Lance Storm2
1Studium Patavinum, University of Padua, Padova, Italy
2School of Psychology, University of Adelaide, Adelaide, Australia

v1   First published: 24 Mar 2021, 10:234                                 Open Peer Review
     https://doi.org/10.12688/f1000research.51746.1
     Latest published: 24 Mar 2021, 10:234
     https://doi.org/10.12688/f1000research.51746.1                       Reviewer Status AWAITING PEER REVIEW

                                                                          Any reports and responses or comments on the

Abstract                                                                  article can be found at the end of the article.
This meta-analysis is an investigation into anomalous perception (i.e.,
conscious identification of information without any conventional
sensorial means). The technique used for eliciting an effect is the
ganzfeld condition (a form of sensory homogenization that eliminates
distracting peripheral noise). The database consists of studies
published between January 1974 and December 2020 inclusive.
The overall effect size estimated both with a frequentist and a
Bayesian random-effect model, were in close agreement yielding an
effect size of .088 (.04-.13). This result passed four publication bias
tests and seems not contaminated by questionable research practices.

Trend analysis carried out with a cumulative meta-analysis and a
meta-regression model with Year of publication as covariate, did not
indicate sign of decline of this effect size.
The moderators analyses show that selected participants outcomes
were almost three-times those obtained by non-selected participants
and that tasks that simulate telepathic communication show a two-
fold effect size with respect to tasks requiring the participants to
guess a target.
The Stage 1 Registered Report can be accessed here:
https://doi.org/10.12688/f1000research.24868.3

Keywords
Rgistered Report, meta-analysis, ganzfeld, anomalous perception

                                                                                                                    Page 1 of 14
F1000Research 2021, 10:234 Last updated: 08 SEP 2021
Corresponding author: Patrizio E. Tressoldi (patrizio.tressoldi@unipd.it)
Author roles: Tressoldi PE: Conceptualization, Data Curation, Formal Analysis, Investigation, Methodology, Project Administration,
Software, Writing – Original Draft Preparation; Storm L: Conceptualization, Data Curation, Methodology, Project Administration,
Supervision, Validation, Writing – Review & Editing
Competing interests: No competing interests were disclosed.
Grant information: The author(s) declared that no grants were involved in supporting this work.
Copyright: © 2021 Tressoldi PE and Storm L. This is an open access article distributed under the terms of the Creative Commons
Attribution License, which permits unrestricted use, distribution, and reproduction in any medium, provided the original work is properly
cited.
How to cite this article: Tressoldi PE and Storm L. Stage 2 Registered Report: Anomalous perception in a Ganzfeld condition - A
meta-analysis of more than 40 years investigation [version 1; peer review: awaiting peer review] F1000Research 2021, 10:234
https://doi.org/10.12688/f1000research.51746.1
First published: 24 Mar 2021, 10:234 https://doi.org/10.12688/f1000research.51746.1
Page 2 of 14F1000Research 2021, 10:234 Last updated: 08 SEP 2021
Introduction
The possibility of identifying pictures or video clips without conventional (sensorial) means, in a ganzfeld environment,
is a decades old controversy, dating back to the pioneering investigation of Charles Honorton, William Braud and Adrian
Parker between 1974 and 1975 (Parker, 2017).
In the ganzfeld, a German term meaning ‘whole field’, participants are immersed in an homogeneous sensorial field were
peripheral visual information is masked out by red light diffused by translucent hemispheres (often split halves of ping-
pong balls or special glasses) placed over the eyes, while a relaxing rhythmic sound, or white or pink noise, is fed through
headphones to shield out peripheral auditory information. Once participants are sensorially isolated from external visual
and auditory stimulation, they are in a favourable condition for producing inner mental contents about a randomly-
selected target hidden amongst decoys. The mentation they produce can either be used by the participant to guide his/her
target selection, or it can be used to assist in an independent judging process.
In the prototypical procedure, participants are tested in a room isolated from external sounds and visual information. After
they make themselves comfortable in a reclining armchair, they receive instructions related to their task during the
ganzfeld condition. Even if there are different verbatim versions, the instructions describe what they should do mentally
in order to detect the information related to the target and how to filter out the mental contents not related to it. This
information will be described aloud and recorded for playback before or during the target identification phase. After the
relaxation phase, which can range from 5 to 15 minutes, they are exposed to the ganzfeld condition for a period ranging
from 15 to 30 minutes. During this phase, participants describe verbally all images, feelings, emotions, they deem related
to the target usually a picture or a short video-clip of real objects or events.
Once the ganzfeld phase is completed, participants are presented with different choices (e.g., the target plus three decoys)
of the same format, e.g., picture or videoclip, and they must choose which one is the target (binary decision).
Alternatively, they may be asked to rate all four (e.g., from 0 to 100), to indicate the strength of relationship between
the information detected during the ganzfeld phase and the images or video clips contents.
A variant of the judgment phase is to send the recording of the information retrieved during the ganzfeld phase to an
external judge for independent ratings of the target. In order to prevent voluntary or involuntary leakage of information
about the target by the experimenters, the research assistant who interacts with the participants must be blind to the target
identity until the participants’ rating task is over.
The choice of the target and the decoys is usually made using automatic random procedures, and scores are automatically
fed onto a scoring sheet.
There are three different ganzfeld conditions:
• Type 1: the target is chosen after the judgment phase;
• Type 2: the target is chosen before the ganzfeld phase;
• Type 3: the target is chosen before the ganzfeld phase and presented to a partner of the participant isolated in a
separate and distant room. From an historical perspective, this last type is considered the typical condition.
These differences are related to some theoretical and perceptual concepts we will discuss later. It is important to note that
type of task makes no difference to the participant who only engages in target identification after the ganzfeld phase.
Review of the Ganzfeld Meta-Analyses
It is interesting to note that most of the cumulative findings (meta-analyses) of this line of investigation were periodically
published in the mainstream journal Psychological Bulletin.
Honorton (1985) undertook one of the first meta-analyses of the many ganzfeld studies completed by the mid-1980s. In
total, 28 studies yielded a collective hit rate (correct identification) of 38%, where mean chance expectation (MCE) was
25%. Various flaws in his approach were pointed out by Hyman (1985), but in their joint-communiqué they agree that
“there is an overall significant effect in this database that cannot reasonably be explained by selective reporting or
multiple analysis” (Hyman & Honorton, 1986, p. 351).
Page 3 of 14F1000Research 2021, 10:234 Last updated: 08 SEP 2021
A second major meta-analysis on a set of ‘autoganzfeld’ studies was performed by Bem & Honorton (1994). These
studies followed the guidelines laid down by Hyman & Honorton (1986). Moreover the autoganzfeld procedure avoids
methodological flaws by using a computer-controlled target randomization, selection, and judging technique. They
overall reported hit rate of 32.2% exceeded again the mean chance expectation.
Milton & Wiseman (1999) meta-analysed further 30 studies collected for the period 1987 to 1997; reporting an overall
nonsignificant standardized effect size of 0.013. However, Jessica Utts (personal communication, December 11, 2009)
using the exact binomial test on trial counts only (N = 1198; Hits = 327), found a significant hit rate of 27% (p = 0.036).
Storm & Ertel (2001) comparing Milton & Wiseman’s (1999) database with Bem & Honorton’s (1994) one, found the
two did not differ significantly. Furthermore Storm and Ertel went on to compile a 79-study database, which had a
statistically significant average standardized effect size of 0.138.
Storm et al. (2010), meta-analysed a database of 29 ganzfeld studies published during the period 1997 to 2008, yielding
an average standardized effect size of 0.14. Rouder et al. (2013) reassessing Storm et al.’s (2010) meta-analysis with a
Bayesian approach, found evidence for the existence of an anomalous perception in the original dataset observing a Bayes
Factor of 330 in support of the alternative hypothesis (p. 241). However they contended the effect could be due to
“difficulties in randomization” (p. 241), arguing that ganzfeld studies with computerized randomization had smaller
effects than those with manual randomization. The reanalysis by Storm et al.’s (2013) showed that this conclusion was
unconvincing as it was based on Rouder et al.’s faulty inclusion of different categories of study.
In the last meta-analysis by Storm & Tressoldi (2020), related to the studies published from 2008 to 2018, the overall
standardized effect size was 0.133; 95%CI: 0.06-0.18.
This study
The main aim of this study is to meta-analyse all available ganzfeld studies dating from 1974 up to December 2020 in
order to assess the average effect size of the database with the more advanced statistical procedures that should overcome
the limitations of the previous meta-analyses. Furthermore, we aim to identify whether there are moderator variables that
affect task performance. In particular, we hypothesize that participant type and type of task are two major moderators of
effect size (see Methods section).
Methods
Reporting guidelines
This study follows the guidelines of the APA Meta-Analysis Reporting Standard (Appelbaum et al., 2018) and the
Preferred Reporting Items for Systematic Review and Meta-Analysis Protocols (PRISMA-P, Moher et al., 2015).
All following analyses have been approved in the Stage 1 (Tressoldi & Storm, 2021). Supplementary and new analyses
not approved in the Stage 1, are reported in the Exploratory analyses section in the Results.
Studies retrieval
Retrieval of studies related to anomalous perception in a Ganzfeld environment is simplified, firstly by the fact that most
of these studies have already been retrieved for previous meta-analyses, as cited in the introduction. Secondly, this line of
investigation is carried out by a small community of researchers. Thirdly, most of the studies of interest to us are published
in specialized journals that adopted the editorial policy of accepting paper with results that are statistically non-significant
(according to the frequentist approach). This last condition is particularly relevant because it reduces the publication bias
due to non-publication (file drawer effect) of studies with statistically non-significant results often as a consequence of
reduced statistical power.
Furthermore in order to integrate the previous retrieval method, we carried-out an online search with Google Scholar,
PubMed and Scopus databases of all papers from 1974 to 2020 including in the title and/or the abstract the word
“ganzfeld” (e.g., for PubMed: Search: ganzfeld [Title/Abstract] Filters: from 1974 – 2020).
Studies inclusion criteria
The following inclusion criteria were adopted:
• Studies related to anomalous perception in a ganzfeld environment;
• Studies must use human participants only (not animals);
Page 4 of 14F1000Research 2021, 10:234 Last updated: 08 SEP 2021
• Number of participants must be in excess of two to avoid the inherent problems that are typical in case studies;
• Target selection must be randomized by using a Random Number Generator (RNG) in a computer or similar
electronic device, or a table of random numbers.
• Randomization procedures must not be manipulated by the experimenter or participant;
• Studies must provide sufficient information (e.g., number of trials and outcomes) for the authors to calculate the
direct hit-rates and effect size values, so that appropriate statistical tests can be conducted.
• Peer reviewed and not peer-reviewed studies e.g. published in proceedings excluding dissertations.
Variables coding
For each included study, one of the authors, expert in meta-analyses, coded the following variables:
• Authors;
• Year of publication;
• Number of trials;
• Number of hits;
• Number of choices of each trial;
• Task type (Type 1,2 or 3);
• Participants type (selected vs. unselected). The authors of the study scored as ‘selected’ all participants that were
screened for one or more particular characteristic deemed favourable for the performance in this type of task. All
others were coded as ‘non-selected’
• Peer-Review level: Level = 1 for studies published in conference proceedings and Researches In Parapsychology
(moderate peer-review); Level = 2, for the studies published in scientific journals with full peer-review.
The second author randomly checked all studies, and the data was compared with those extracted by the other author.
Discrepancies were corrected by inspecting the original papers.
The complete database with all supporting information is available as Underlying data (Tressoldi & Storm, 2020).
Effect size measures
As standardized measure of effect size, we used that one applied in Storm, Tressoldi & Di Risio, (2010) and Storm &
Tressoldi (2020): Binomial Z score/√number of trials using the number of trials, the hits score and the chance probability
as raw scores. The exact binomial Z score has been obtained applying the formula implemented online at http://
vassarstats.net/binomialX.html. When this algorithm did not compute the z value when either number of trials or number
of hits were low, we used the one-tailed exact binomial p-value, to find the inverse normal z by using the online app at
http://www.fourmilab.ch/rpkp/experiments/analysis/zCalc.html where the formula of this conversion is described.
As standard error, we used the formula: √(hit rate % * (1-hit rate %)/trials * chance percentage *(1-chance percentage)).
In order to take into account the effect size overestimation bias in small samples, the effect sizes and their standard errors,
were transformed in the Hedge’s g effect sizes, with the corresponding standard errors by applying the formula presented
in Borenstein et al. (2009, pp. 27–28: g=(1-(3/(4df-1)))* d)).
Overall effect size estimation
In order to account for the between-studies heterogeneity, the overall effect size estimation of the whole database has been
calculated by applying both a frequentist and a Bayesian random-effect model for testing its robustness.
Page 5 of 14F1000Research 2021, 10:234 Last updated: 08 SEP 2021
Frequentist random-effect model
Following the recommendations of Langan et al. (2019), we used the restricted maximum likelihood (REML) approach
to estimate the heterogeneity variance with the Knapp and Hartung method for adjustment to the standard errors of the
estimated coefficients (Rubio-Aparicio et al., 2018).
Furthermore, in order to control for possible influence of outliers, we calculated the median and mode of the overall effect
size applying the method suggested by Hartwig et al. (2020).
These calculations were implemented in the R statistical environment v.4.0.3 with the metafor package v. 2.4
(Viechtbauer, 2017). See syntax details provided as extended data (Tressoldi & Storm, 2020).
Bayesian random-effect model
As priors for the overall effect size we used a normal distribution with Mean = 0.1; SD =0.03, constrained positive, lower
bound = 0 (Haaf & Rouder, 2020), given our expectation of a positive value. As prior for the tau parameter we used an
inverse gamma distribution with shape = 1, scale = 0.15.
This Bayesian meta-analysis was conducted using the MetaBMA package v. 0.6.6 (Heck et al., 2017).
Publication bias tests
Following the suggestions of Carter et al. (2019), we applied four tests to assess publication bias:
• the 3-parameter selection model (3PSM), as implemented by Coburn & Vevea (2019) with the package ‘weightr’
v.2.0.2;
• the p-uniform* (star) v. 0.2.4 test as described by van Aert & van Assen (2019), and
• the sensitivity analysis using the Mathur & VanderWeele (2020) package PublicationBias v.2.2.0.
• The Robust Bayesian meta-analysis test implemented with the RoBMA package v.1.2.1 (Bartoš & Maier, 2020).
The three parameters model represents the average true underlying effect, δ, the heterogeneity of the random effect sizes,
τ 2 and the probability that there is a nonsignificant effect in the pool of effect sizes. The probability parameter is modelled
by a step function with a single cut point at p = 0.025 (one-tailed), which corresponds to a two-tailed p value of 0.05. This
cut point divides the range of possible p values into two bins: significant and nonsignificant. The three parameters are
estimated using maximum likelihood (Carter et al., 2019, p. 124).
The p-uniform* test, is an extension and improvement of the p-uniform method. P-uniform* improves upon p-uniform
giving a more efficient estimator avoiding the overestimation of effect size in case of between-study variance in true effect
sizes, thus enabling estimation and testing for the presence of between-study variance in true effect sizes.
Sensitivity analysis, as implemented by Mathur & VanderWeele (2020), assumes a publication process such that
“statistically significant” results are more likely to be published than negative or “nonsignificant” results by an unknown
ratio, η (eta). Using inverse-probability weighting and robust estimation that accommodates non-normal true effects,
small meta-analyses and clustering, it enables statements such as: “For publication bias to shift the observed point
estimate to the null, ‘significant’ results would need to be at least 30-fold more likely to be published than negative or
‘non-significant’ results” (p. 1). Comparable statements can be made regarding shifting to a chosen non-null value or
shifting the confidence interval.
The Robust Bayesian meta-analysis test is an extension of Bayesian meta-analysis obtained by adding selection models to
account for publication bias. This allows model-averaging across a larger set of models, ones that assume publication bias
and ones that do not. This test allows us to quantify evidence for the absence of publication bias estimated with a Bayes
Factor. In our case we compared only two models, a random-effect model assuming no publication bias and a random-
model assuming publication bias.
Cumulative meta-analysis
In order to ascertain the overall trend of the cumulative evidence and in particular for testing the presence of a positive or
negative trend effect, we performed a cumulative effect size estimation.
Page 6 of 14F1000Research 2021, 10:234 Last updated: 08 SEP 2021
Meta-regression
Furthermore, we estimated the overall effect size taking the variable “year of publication” as covariate using a meta-
regression model.
Moderators effects
We compared the influence of the following tree moderators: (i) Type of participant, (ii) Type of task and (iii) Level of
peer-review.
As described in the Variable Coding paragraph, the variable Type of participant, has been coded in a binary way: selected
vs unselected. Type of task has been coded as Type 1, Type 2, and Type 3, as described in the Introduction and level of
Peer-review as 1 for studies published in conference proceedings or 2, for the studies published in scientific journals with
full peer-review.
Statistical power
The overall statistical power was estimated using R package metameta v.0.1.1. (Quintana, 2020). Furthermore, we
calculated the number of trials necessary to achieve a statistical power of at least.80 with an α = .05. With this estimation
we examined how many studies in the database reached this threshold.
Results
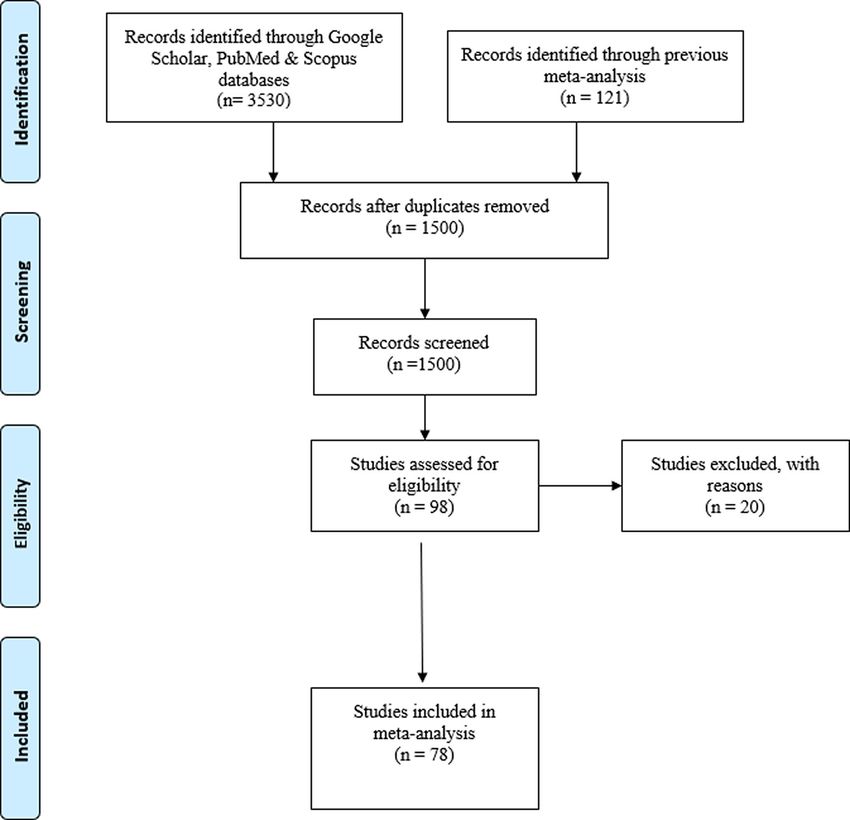
The search and selection of the studies is presented in the PRISMA flowchart in Figure 1. As shown in the flowchart, our
final database comprises 78 studies, for a total of 113 effect sizes carried out by 46 different principal investigators.
The list of all references related to the included and excluded studies is available in the GZMAReference List file and the
data used for all the following statistical analyses is available in the GZMADatabase1974_2020 file in the Underlying
data (Tressoldi & Storm, 2020).
Descriptive statistics
Descriptive statistics related to the variables trials, hits rate, participants type, task types, peer-review level are presented
in Table 1.
Comment: The range of the number of trials as well as the hits percentage is quite wide. The number of task types show
that the main types are Type 2: the target is chosen before the ganzfeld phase) and of Type 3: the target is chosen before the
ganzfeld phase and presented to a partner of the participant isolated in a separate and distant room. Type 1 studies (target
randomly selected after participant makes a choice) are only 5 (4.2%).
The percentage of studies using non-selected participants is greater (62% vs 38%) than that of studies using selected. Most
studies (58.4%) were peer-reviewed.
Overall effect size
The overall estimated weighted effect size along with the corresponding 95% Confidence Intervals or Credible Intervals
of both the frequentist and the Bayesian random-effect models as described in the Methods section, and values of τ2 and I2
(Higgins & Thompson, 2002) with their confidence intervals, as measures of between-study variance, are presented in
Table 2.
Comment: The frequentist and the Bayesian random-effect model parameters estimations are in close agreement and both
reject the null (H0) hypothesis with a high probability.
In terms of hits percentage above chance, this small effect size corresponds to 3.8% (95%CIs: 1.7 – 5.9).
The level of heterogeneity is medium-large as expected by the influence of the moderators. Given this heterogeneity level,
the values of the effect size median.017 (-.025 - .06) and mode -.01 (-.13 - .10), are uninformative.
The forest plot is available as Figure S1 (Extended data (Tressoldi & Storm, 2020)).
Outliers detection and influence
In order to detect the presence of influential outliers, we applied the “influence” function in the metafor package. These
procedures identified two influential outliers. The results of the frequentist random-effect model without the influential
outliers, are very similar to those with the outliers (mean ES: .088; 95% CIs: .04 - .13).
Page 7 of 14F1000Research 2021, 10:234 Last updated: 08 SEP 2021
Figure 1. PRISMA flowchart.
Table 1. Descriptive statistics of the main variables.
Trials Hits rate Task Type Participants Type Peer-review level
Mean (SD) 42.8 (27.2) .32 (.11)*
Range 4-138 0-60
Count (%) Type 1: 5 (4.2) Non-selected: 70 (62) Level 1: 47 (41.6)
Type 2: 27 (23.8) Selected: 43 Level 2: 66 (58.4)
Type 3: 81 (72) (38)
*= this value is purely descriptive because not all studies are 4 free-choice designs
Cumulative effect size
The results of the cumulative meta-analysis is represented with a cumulative forest plot in Figure S2 (Extended
data (Tressoldi & Storm, 2020)). From the inspection of the cumulative forest plot, it emerges that the overall
effect size stabilized around the cumulative evidence obtained up to 1997. Thus, it appears to be stable for more than
20 years.
Page 8 of 14F1000Research 2021, 10:234 Last updated: 08 SEP 2021
Table 2. Frequentist and Bayesian random-effect model results effect size.
Frequentist weighted ES (95% Bayesian τ2 I2
Confidence Intervals) weighted ES (95% (95%
(95% Credible Confidence Confidence
Intervals) Intervals) Intervals)
Mean .088 (.04 - .13) .092 (.06 - .13) .03 (.01 - .04) 63.5 (50 – 70.3)
e-5
P value or Bayes 1.66 1311
Factor(H1/H0)
Table 3. Results of the p-uniform* and the 3-parameter selection model (3PSM), publication bias tests.
p-uniform* 3PSM RoBMA
ES .13 .15 .07
95% CIs .06 - .20 .06 - .23 .02 - .11
Meta-regression
The results of the meta-regression with “Year” as covariate, show a slope estimate of.0002 (95%CIs: -.0035 - .004;
p = .92).
Comment: These results support the hypothesis that the overall effect size is not affected by the year of publication of the
experiments.
Exploratory analyses
Another way to observe the cumulative trend of the overall effect size, is to examine the evolution of the Bayes Factor and
of Posterior Probability of H1 as the data accumulate. This information has been obtained using the option “sequential
Bayes Factor” and “sequential posterior model probability” within the module Bayesian Meta-Analysis in the software
JASP v.0.14.1 (Jasp, 2020) that are presented in Figures S3 and S4 (Extended data (Tressoldi & Storm, 2020)). From
these two plots it is possible to observe how the Bayes Factor started a positive linear trend after approximately
70 experiments. The maximum Posterior probability is achieved after approximately 80 experiments. The JASP file is
available as Underlying data (Tressoldi & Storm, 2020).
Publication Bias tests
The results of the four publication bias tests described in the Methods section are presented in Table 3 and in the
information that follows.
The results of the sensitivity analysis publication bias to shift the observed effect size point estimate to the.01 level,
considered the smallest effect size of interest, indicated that no amount of publication bias (parameter eta) under the
assumed model would suffice to shift the point estimate to this level.
Comment: The overall effect size estimate passes all four publication bias tests.
Moderators analyses
The weighted effect size along with the corresponding 95% confidence Intervals of the two types of participants, the three
task types and the two peer-review level, are presented in Table 4.
Exploratory analysis
After looking at the participants selection and Task Type results, it was interesting to learn that selected participants and
Task Type 3 combined, gave: ES = .16; 95%CIs: .07 - .24; not different from the results obtained by the selected
participants in all three types of tasks.
Comment: Whereas it is clear that the levels of peer-review did not yield differences in the effect sizes, the selection of
participants and the Task Types show substantial and statistically significant differences.
Page 9 of 14F1000Research 2021, 10:234 Last updated: 08 SEP 2021
Table 4. Effect sizes and 95% CIs related to the moderators’ categories.
Selected Non-selected Task Task Task Peer-review Peer-review
Participants participants Type 1 Type 2 Type 3 level 1 level 2
ES .15 .047 .12 .04 .10 .08 .09
95% CIs .08 - .21 -.006 - .10 -.07 - .32 -.04 - .13 .05 - .15 .01 - .14 .03 - .15
Selected participants show a three-fold increase in the effect size with respect to the non-selected participants. In terms of
hits percentage above chance, this difference corresponds to 7.6%; 95%CI: 3-12 and 1%; 95%CI: -1 – 4.7, respectively.
Similarly, Tasks Type 1 and 3 show more than two-fold increase in ES compared to Type 2 tasks. The effect size observed
with tasks Type 1, must be considered with caution given the low number of experiments (5).
Statistical power
The median statistical power related to the observed overall effect size is .106. This result explains the fact that only
21 (18.5%) of the studies reported statistically significant results.
Discussion
The main aim of this meta-analysis was to get an overall picture of the evidence accumulated in more than 40 years of
investigation related to an anomalous perception in a ganzfeld environment.
The overall effect size estimated from 113 studies carried out from 1974 to June 2020, is small, but it turned out robust in
both a frequentist and a Bayesian random-effect model.
As shown by the cumulative analysis and the meta-regression with Year of publication as covariate meta-analyses, this
effect does not show a negative trend from 1974 to 2020 and is quite stable since 1997 and after 70-80 experiments.
Furthermore, the overall effect, passes four different publication bias tests, reducing the probability that it could be due to
the selective reporting of studies with statistically significant results. This interpretation is also supported by the low
number of studies (18.5%) with statistically significant results. This outcome is partly consequent to the practice of
publishing also statistically non-significant studies in the specialised journals and proceedings related to this field of
investigation.
Moreover, the similarity of effect size between the two levels of peer-review, add further support to the hypothesis that the
“file drawer” is pretty empty, that is that this meta-analysis include all completed studies.
If we consider the value of the overall effect size, the lack of statistically significant results in many experiments are a
consequence to their low statistical power as shown by the very low median statistical power of the meta-analysis.
For those interested in this line of investigation the advice is clear. In order to achieve a statistical power of at least.80 with
an alpha value of.05, each study must have at least 320 trials (estimated with G*Power, v.3.1.9.7, Faul, Erdfelder, Lang &
Buchner, 2007).
However, this requirement can be reduced considerably if we consider the results of the moderators, in particular the
selection of participants and the type of task. With selected participants carrying out a Type 3 task (i.e., with targets chosen
before the ganzfeld phase and presented to a partner of the participant isolated in a separate and distant room simulating a
sort of telepathic communication), the required trials can safely be reduced to 50.
Could the overall results be contaminated by the use of some questionable research practices (John et al., 2012), such as
optional stopping, data exclusion, etc.? These practices are difficult to detect after the study publication, which is why it is
recommended to preregister all methodological and statistical details before data collection. As far as it concerns this line
of investigation, Wiseman, Watt and Kornbrot (2019), documented that preregistration was recommended well before the
so-called replication crisis faced by most scientific fields. Furthermore, a simulation of the use of some questionable
research practices carried out by Bierman, Spottiswoode and Bijl (2016) on 78 studies related to anomalous perception in
Page 10 of 14F1000Research 2021, 10:234 Last updated: 08 SEP 2021
a ganzfeld environment, showed that even if the overall effect size could be inflated by the use of questionable research
practices, it was not reduced to zero.
Even if this paper is mainly devoted to the statistical analysis of the available evidence, it is important to consider possible
theoretical frameworks that could account for such phenomena. Some of them are presented in the review by Cardeña
(2018) and the book Transcendent Mind by Barušs and Mossbridge (2017). As a general theoretical framework, the main
assumption is to consider mind not derived or constrained by their biological correlates but ontologically independent
from them in agreement with some western and eastern philosophical interpretations such as idealism (Kastrup, 2018),
dual-aspect monism (Walach, 2020), Advaita Vedanta (Sedlmeier & Srinivas, 2016), etc. If these interpretations of
mind and consciousness are valid, what looks impossible or anomalous according to a physicalist or an eliminative
reductionism interpretation, becomes perfectly normal.
Summary and recommendations
The overall picture emerging from this meta-analysis is that there is sufficient evidence to claim that it is possible
to observe a non-conventional (anomalous) perception in a ganzfeld environment. The available evidence seems not to
be contaminated by publication bias and questionable research practices. However, in order to increase the probability
of detecting such phenomena it is recommended to select participants and to use tasks which mimic a telepathic
communication.
As a methodological advice, it is recommended that researchers preregister the methodological and statistical details in
open access registries as proposed by Watt and Kennedy (2016) and others, or even better to use a registered report format
that makes all procedures more transparent before and during data collection and analysis. One of the best example, to be
used as a model, is the Transparent Psi Project (Kekecs et al., 2019).
Our hope is to update the evidence related to the anomalous perception in a ganzfeld environment with a meta-analysis of
preregistered studies in the near future.
Data availability
Underlying data
Figshare: Registered Report - Anomalous perception in a Ganzfeld condition: A meta-analysis of more than 40 years
investigation, https://doi.org/10.6084/m9.figshare.12674618.v7 (Tressoldi & Storm, 2020).
This project contains the following underlying data:
- GZMADatabase1974_2020 (.jasp and.xlsx)
- GZMA Power (.xlsx)
- GZMA Reference List (.doc)
Extended data
Figshare: Registered Report - Anomalous perception in a Ganzfeld condition: A meta-analysis of more than 40 years
investigation, https://doi.org/10.6084/m9.figshare.12674618.v7 (Tressoldi & Storm, 2020).
This project contains the following extended data:
- Syntax Details for Stage 1 and Stage 2 Registered Report
- Figure S1
- Figure S2
- Figure S3
- Figure S4
Page 11 of 14F1000Research 2021, 10:234 Last updated: 08 SEP 2021
Reporting guidelines
Figshare: PRISMA checklist for ‘Stage 2 Registered Report: Anomalous perception in a Ganzfeld condition - A meta-
analysis of more than 40 years investigation’, https://doi.org/10.6084/m9.figshare.12674618.v7 (Tressoldi & Storm,
2020)
Data are available under the terms of the Creative Commons Attribution 4.0 International license (CC-BY 4.0).
References
Appelbaum M, Cooper H, Kline RB, et al. : Journal article reporting Kastrup B: The universe in consciousness. J Consci Stud. 2018; 1;25(5-6):
standards for quantitative research in psychology: The APA 125-55.
Publications and Communications Board task force report. Am Psychol. Kekecs Z, Aczel B, Palfi B, et al.: Raising the value of research studies in
2018; 73(1): 3–25. psychological science by increasing the credibility of research
PubMed Abstract|Publisher Full Text reports: The Transparent Psi Project - Preprint. 2019.
Bartoš F, Maier M: RoBMA: An R Package for Robust Bayesian Meta- Publisher Full Text
Analyses. R package version 1.2.0. 2020; Langan D, Higgins JPT, Jackson D, et al.: A comparison of heterogeneity
Reference Source variance estimators in simulated random-effects meta-analyses Res
Barušs I, Mossbridge J: Transcendent mind: Rethinking the science of Synth Methods. 2019; 10(1): 83–98.
consciousness. American Psychological Association; 2017. PubMed Abstract|Publisher Full Text
Bem DJ, Honorton C: Does psi exist? Replicable evidence for an Mathur MB, VanderWeele TJ: Sensitivity analysis for publication bias in
anomalous process of information transfer. Psychol Bull. 1994; 115(1): meta-analyses. J R Stat Soc Ser C Appl Stat. 2020; 1–29.
4–18. PubMed Abstract|Publisher Full Text|Free Full Text
Publisher Full Text Milton J, Wiseman R: Does psi exist? Lack of replication of an anomalous
Bierman DJ, Spottiswoode JP, Bijl A: Testing for questionable research process of information transfer. Psychol Bull. 1999; 125(4): 387–391.
practices in a meta-analysis: An example from experimental PubMed Abstract|Publisher Full Text
parapsychology. PloS one. 2016 May 4; 11(5): e0153049. Moher D, Stewart L, Shekelle P, et al.: Preferred reporting items for
PubMed Abstract|Publisher Full Text|Free Full Text systematic review and meta-analysis protocols (PRISMA-P) 2015
Borenstein M, Hedges LV, Higgins JPT, et al.: Introduction to Meta- statement. Syst Rev. 2015; 4(1): 1.
Analysis. Chichester, UK: John Wiley & Sons, Ltd.; 2009. PubMed Abstract|Publisher Full Text|Free Full Text
Publisher Full Text Parker A: ‘Ganzfeld’. Psi Encyclopedia. London: The Society for
Cardeña E: The experimental evidence for parapsychological Psychical Research. 2017.
phenomena: A review. Am Psychol. 2018 Jul; 73(5): 663–677. Reference Source
PubMed Abstract|Publisher Full Text Quintana D: dsquintana/metameta: 0.1.1 (beta) (Version 0.1.1).
Carter E, Schönbrodt F, Gervais W, et al.: Correcting-bias-in-psychology. Zenodo. 2020 July 14.
Adv Methods Pract Psychol Sci. 2019; 2(2): 115–144. Publisher Full Text
Publisher Full Text Rouder JN, Morey RD, Province JM: A Bayes factor meta-analysis of
Coburn KM, Vevea JL: Package ‘weightr’. Estimating Weight-Function recent extrasensory perception experiments: Comment on Storm,
Models for Publication Bias. 2019. Tressoldi, and Di Risio (2010). Psychol Bull. 2013; 139(1): 241–247.
Reference Source PubMed Abstract|Publisher Full Text
Faul F, Erdfelder E, Lang AG, et al.: G* Power 3: A flexible statistical power Rubio-Aparicio M, López-López JA, Sánchez-Meca J, et al.: Estimation of an
analysis program for the social, behavioral, and biomedical sciences. overall standardized mean difference in random-effects meta-
Behav Res Method. 2007; 39(2): 175–191. analysis if the distribution of random effects departs from normal. Res
Publisher Full Text Synth Methods. 2018; 9(3): 489–503.
Haaf JM, Rouder J: NDoes Every Study? Implementing Ordinal PubMed Abstract|Publisher Full Text
Constraint in Meta-Analysis. PsyArXiv. 2020, September 16. Sedlmeier P, Srinivas K: How Do Theories of Cognition and
Publisher Full Text Consciousness in Ancient Indian Thought Systems Relate to Current
Hartwig FP, Smith GD, Schmidt AF, et al.: The median and the mode as Western Theorizing and Research? Front Psychol. 2016; 15(7): 343.
robust meta-analysis estimators in the presence of small-study PubMed Abstract|Publisher Full Text|Free Full Text
effects and outliers. Res Synth Methods. 2020; 11(3): 397–412. Storm L, Ertel S: Does psi exist? Comments on Milton and Wiseman’s
PubMed Abstract|Publisher Full Text (1999) meta-analysis of ganzfeld research. Psychol Bull. 2001; 127(3):
Heck DW, Gronau QF, Wagenmakers E: metaBMA: Bayesian model 424–433, discussion 434-8.
averaging for random and fixed effects meta-analysis. 2017. PubMed Abstract|Publisher Full Text
Publisher Full Text Storm L, Tressoldi PE, Di Risio L: Meta-analyses of free-response studies,
Higgins JPT, Thompson SG: Quantifying heterogeneity in a meta- 1992–2008: Assessing the noise reduction model in parapsychology.
analysis. Stat Med. 2002; 21(11): 1539–1558. Psychol Bull. 2010; 136(4): 471–485.
PubMed Abstract|Publisher Full Text PubMed Abstract|Publisher Full Text
Hyman R: The ganzfeld psi experiment: A critical appraisal. Storm L, Tressoldi PE, Utts J: Testing the Storm et al. (2010) meta-
J Parapsychol. 1985; 49(1): 3–49. analysis using Bayesian and frequentist approaches: Reply to Rouder
Reference Source et al. (2013). Psychol Bull 2013; 139(1): 248–254.
PubMed Abstract|Publisher Full Text
Hyman R, Honorton C: Joint communiqué: The psi ganzfeld
controversy. J Parapsychol. 1986; 50(4): 351–364. Storm L, Tressoldi P: Meta-Analysis of Free-Response Studies 2009–
Reference Source 2018: Assessing the Noise-Reduction Model Ten Years On. PsyArxiv.
2020.
Honorton C: Meta-analysis of psi ganzfeld research: A response to Publisher Full Text
Hyman. J Parapsychol. 1985; 49(1): 51–91.
Reference Source Tressoldi PE, Storm L: Stage 1 Registered Report: Anomalous
perception in a Ganzfeld condition - A meta-analysis of more than
JASP Team: JASP (Version 0.14.1) [Computer software]. 2020 40 years investigation [version 2; peer review: 1 approved, 2 approved
Reference Source with reservations]. F1000Res. 2020; 9: 826.
John LK, Loewenstein G, Prelec D: Measuring the Prevalence of PubMed Abstract|Publisher Full Text|Free Full Text
Questionable Research Practices With Incentives for Truth Telling. Tressoldi P, Storm L: Registered Report - Anomalous perception in a
Psychol Sci. 2012; 23(5): 524–532. Ganzfeld condition: A meta-analysis of more than 40 years
PubMed Abstract|Publisher Full Text
Page 12 of 14F1000Research 2021, 10:234 Last updated: 08 SEP 2021
investigation. figshare. 2020. Broader Epistemology. Front Psychol. 2020 Apr 23; 11: 640.
Publisher Full Text PubMed Abstract|Publisher Full Text|Free Full Text
van Aert RCM, van Assen MALM: Correcting for publication bias in a Watt CA, Kennedy JE: Options for Prospective Meta-Analysis and
Meta-Analysis with the P-Uniform* method. 2019. Introduction of Registration-Based Prospective Meta-Analysis. Front
Publisher Full Text Psychol. 2016; 7: 2030.
Viechtbauer W: The metafor Package. 2017. PubMed Abstract|Publisher Full Text|Free Full Text
Reference Source Wiseman R, Watt C, Kornbrot D: Registered reports: an early example
Walach H: Inner Experience–Direct Access to Reality: A and analysis. PeerJ. 2019; 7: e6232.
Complementarist Ontology and Dual Aspect Monism Support a PubMed Abstract|Publisher Full Text|Free Full Text
Page 13 of 14F1000Research 2021, 10:234 Last updated: 08 SEP 2021
The benefits of publishing with F1000Research:
• Your article is published within days, with no editorial bias
• You can publish traditional articles, null/negative results, case reports, data notes and more
• The peer review process is transparent and collaborative
• Your article is indexed in PubMed after passing peer review
• Dedicated customer support at every stage
For pre-submission enquiries, contact research@f1000.com
Page 14 of 14You can also read