THE ECONOMICS OF ECOSYSTEMS AND BIODIVERISTY VALUATION DATABASE - MANUAL - TEEB
←
→
Page content transcription
If your browser does not render page correctly, please read the page content below

THE ECONOMICS OF ECOSYSTEMS AND BIODIVERISTY
VALUATION DATABASE - MANUAL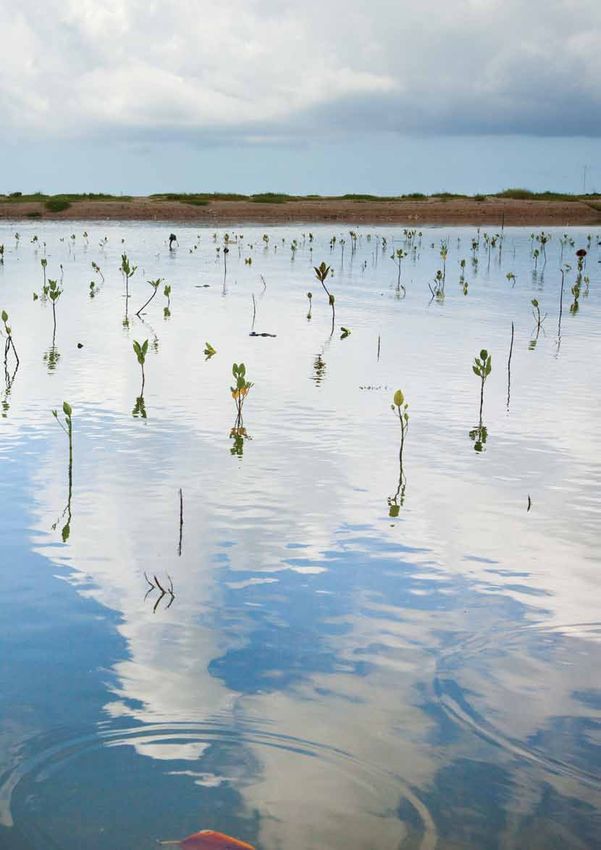
THE ECONOMICS OF ECOSYSTEMS AND BIODIVERSITY
                                     VALUATION DATABASE - MANUAL

The Economics of Ecosystems and Biodiversity (TEEB) is a global initiative focused on drawing attention to the
economic benefits of biodiversity. It highlights the cost of biodiversity loss and ecosystem degradation and brings
together expertise from ecology, economics and development to support the mainstreaming of biodiversity and
ecosystem considerations into decision-making at all levels, including the private sector.
Website: www.teebweb.org

Paper citation: McVittie A., Hussain S. S. (2013) The Economics of Ecosystems and Biodiversity - Valuation Database
Manual
Disclaimer: The contents and views contained in this Manual are those of the authors and do not necessarily
represent those of any of the contributors, reviewers or organizations supporting this work
Authors: Alistair McVittie and Salman Hussain of the Sustainable Ecosystems Team at SRUC, Scotland’s Rural
College
Acknowledgements: We would like to thank the following for their valuable inputs and suggestions : Rudolf de
Groot, Pushpam Kumar, Sander ven der Ploeg, S.Ersin Esen, the TEEB Coordination Group and the TEEB Advisory
Board

Job Number: DTI/1766/GE
Cover Image: Jemps, www.flickr.com
Layout design:Thomas Gianinazzi

                     The Sustainable Ecosystems Team at the Scotland’s Rural College is focused on the evaluation
                     of ecosystem goods and services associated particularly with agro-ecosystems, including
                     on the economics of marine ecosystems. Their work is influenced by the ongoing push for
                     agricultural policy reform and by the need to implement national and global action on the
                     ground to address a wide range of environmental concerns.

                     Website http://www.sruc.ac.uk/

TEEB is hosted by the United Nations Environment Programme and is supported by the following donors
The Economics of Ecosystem and Biodiversity

VALUATION DATABASE - MANUAL

source: Lawrence Hislop, www.grida.no
Contents

Contents ..................................................................................................................................    1
1 Introduction .........................................................................................................................       2
2 Background .........................................................................................................................         3
3 Database content ................................................................................................................            3
4 Database summary .............................................................................................................               6
5 Use of the database ............................................................................................................            14
   5.1 Summary ecosystem service values ............................................................................                          14
   5.2 Identification of relevant studies for benefit transfer ..................................................                             14
   5.3 Meta-analysis ................................................................................................................         15
6 Caveats ................................................................................................................................    15
7 References ...........................................................................................................................      17

Appendix A – Original Access database relationships ...........................................................                               18
Appendix B – Database worksheet description ......................................................................                            19
Appendix C – Cross-tabulations of region and biome ............................................................                               20
Appendix D – Cross-tabulation of region and ecosystem services ........................................                                       21

Table 1 Description of valuation database variables ..............................................................                            4-5
Table 2 Ecosystem service categories and comparison with common classifications .......... 10-11

Figure 1 Number of studies and value estimates by biome ....................................................                                   6
Figure 2 Distribution of studies and value estimates by region ..............................................                                  7
Figure 3 Frequency of valuation estimates per study .............................................................                              7
Figure 4 Location and represented biomes of value estimates ..............................................                                     8
Figure 5 Location and represented ecosystem service types of value estimates ...................                                               9
Figure 6 Proportion of value estimates for each ecosystem service category by continent ..                                                    12
Figure 7 Proportion of value estimates for each ecosystem service category by biome ........                                                  12
Figure 8 Numbers of value estimates by valuation method ....................................................                                  13

                                                                                       1
1 Introduction
The purpose of this manual is to summarise and explain the potential uses of the TEEB Valuation Database. The database
can be used for a number of purposes - from simple summarising of valuation evidence for particular contexts, to benefit
transfer for sophisticated meta-analyses. The manual will discuss the origin of the database; describe its content and
structure; outline its contents and discuss how it may be used including important caveats in use.

The TEEB project and similar regional and national initiatives (such as the MA, CICES, UK NEA and MAES)2 have
increased awareness of the importance of biodiversity and ecosystems in contributing to human well-being and in
guiding policymakers, business and individuals in the sustainable use of natural capital. This ecosystem and well-being
link as exemplified in the ecosystem services framework has highlighted the importance of integrating ecological and
economic analyses into successful environmental policy and management. Part of this has included the recognition of
the potential role for the valuation of the benefits provided by ecosystem services – both monetary and non-monetary.
For instance, in some cases, qualitative indicators are the only possibility and indeed sufficient to inform decisions,
such as, stakeholder values on cultural or spiritual importance of a site. In other cases, monetary terms can prove
useful in decision-making. These may include, economic savings from avoided soil erosion, designing Payments for
Ecosystem Service (PES) schemes; communicating with Ministries of Finance and Economics (for further information,
see the Guidance Manual for TEEB Country Studies 3, 2013). This document deals with monetary valuations.Over the
last few decades, a large number of studies have estimated the monetary value of ecosystem services across a range
of ecosystems and countries in response to environmental policy and resource use scenarios. The TEEB Valuation
Database we describe here has been developed through iteration from an earlier database developed by de Groot et al
(2010) as part of the TEEB study (Kumar, 2010). As we describe below, the current database has been subject to limited
review and amendment and also transferred to a spreadsheet format. The database brings together a global sample
of valuation studies from a variety of sources including the peer reviewed academic and grey literatures. The database
includes 1168 values across 87 countries and 14 biomes.

This manual does not engage in an in-depth discussion of the nature of ecosystem service categorisation and valuation.
For example, several authors (see for example UK NEA, 2011: p18) ) note that final ecosystem services per se do not
always provide goods or services that can be valued – in many instances some further addition or interaction with man-
made capital is required to produce a benefit that can be valued. Similarly, we retain the categorisation of ecosystem
services used by the original developers of the database (see Background section below). An example where some
debate might arise is the treatment of ‘biodiversity’ as a service; in the database this is categorised as a supporting
service (‘genepool’) although some classifications (e.g. UK NEA) also consider wild species diversity to be an ecosystem
service in it own right. Although this distinction seems subtle, it is important when aggregating multiple valuation
estimates; where biodiversity is valued solely as a supporting service there is a risk of double counting, i.e. the value of
biodiversity is already reflected in the values for other provisioning, regulating and cultural services.

2
 Millennium Ecosystem Assessment (MA, 2005); Common International Classification of Ecosystem Services (CICES: Haines-Young and Potschin, 2011); UK National
Ecosystem Assessment (UK NEA, 2011); Mapping and Assessment of Ecosystems and their Services (MAES: see for example Maes et al, 2012)
3
 http://www.teebweb.org/wp-content/uploads/2013/06/TEEB_GuidanceManual_2013_1.0.pdf

                                                                            2
THE ECONOMICS OF ECOSYSTEMS AND BIODIVERSITY
                                                             VALUATION DATABASE - MANUAL

2 Background
The database was originally created by de Groot et al (2010) to inform Appendix 3 of The Economics of Ecosystems
and Biodiversity: Ecological and Economic Foundations (Kumar, ed., 2010). This original database drew on a wide
range of sources, specifically through searches of a number of existing valuation databases and through additional
references identified by the authors. Summary details of the original database can be found in de Groot et al (2010)
and more recently in de Groot et al (2012). The Ecosystem Services Partnership intends to publish a version of the
database as the Ecosystem Services Valuation Database (ESVD)5.
Since its original development parts of the database have been subject to further review, specifically (Hussain et al
2011) reviewed all studies in the forest (temperate and topical) and woodland biomes.

This review resulted in some corrections, additions and deletions from the original database; although to our
knowledge that review and the amendments have not been reflected in the ESVD.

The version of the database described in this manual has been transferred to an Excel spreadsheet from the original
Access database and incorporates the review and changes made by Hussain et al. Although relational databases,
such as Access, have many useful features, there are often problems with permissions on some institutional
IT systems relating to file authorship; these do not arise with spreadsheets. Further, spreadsheets also lend
themselves to data manipulation. An SPSS version of the database has also been prepared. We have made some key
transformations of the data which are discussed further in following sections.

3 Database content
The original Access database consists of a main ‘Values’ table
comprised of coded values which are in turn linked to a number
of further tables containing the values for those codes and
additional variables (see Appendix A for database structure).
This structure has been replicated in the Excel spreadsheet
through the use of a number of worksheets. The variables in
the main values sheet are described below in Table 1 with the
content of the linked worksheets outlined in Appendix B. Table
1 also indicates the variables that are included in the SPSS
version.

3
  In addition to individual publications, the following ecosystem service databases were used: COPI (ten Brink et al., 2009), EVRI (1997), ENValue (2004), EcoValue
(Wilson et al., 2004), Consvalmap (Conservation International, 2006), CaseBase (FSD, 2007), ValueBaseSwe (Sundberg and Söderqvist, 2004), ESD-ARIES (UVM, 2008)
and FEEM (Ojea et al., 2009). See www.es-partnership.org for access to most of these databases.
4
  http://www.fsd.nl/esp at time of writing (March 2013) the ESVD was unpublished.
5
  The relationships in the original Access version of the database are illustrated in Appendix A.

                                                                                3
Table 1 Description of valuation database variables
Variable            Description                                                               Linked worksheet        In
                                                                                                                   SPSS
                                                                                                                 version

Index               Unique index value for each study                                                              Y

ValueID             Study ID in original TEEB D0 and ESVD database                                                 Y

LocationID          Location of valuation study site – specific site for valuation study      Location             Y
                    and estimate where available

Latitude            Latitude of study site, country capital city or country centre point in   Location             Y
                    decimal degrees

Longitude           Longitude of study site, country capital city or country centre point     Location             Y
                    in decimal degrees

CountryID           Country ID – indicates country in which valuation study applies           Country              Y

Region              Region in which study applies                                             Country              Y

Continent           Continent in which study applies                                          Country              Y

ReferenceID         Study reference ID – indicates source of value estimate                   Reference            Y

ReferenceTypeID     Reference type ID – indicates type of publication, e.g. journal,          Reference Type       Y
                    report, book, thesis etc.
                    Ecosystem service ID – indicates broad ecosystem service category,        ES Service           Y
ESServiceID         e.g. provisioning, regulating, cultural, supporting, various services
                    or aggregated value

ESSubServiceID      Ecosystem sub-service ID – indicates specific ecosystem service           ES Subservice        Y
                    within each broad category

ESServiceUse        Comments on particular service

BiomeID             Biome ID – indicates relevant biome (12 classes)                          Biome                Y

EcosystemID         Ecosystem ID – 60 ecosystem classifications with links to relevant        Ecosystem            Y
                    biome

YearofValue         Year of original valuation estimate                                                            Y

YearofStudy         Year of valuation publication (if different from above)                                        Y

CurrencyID          Currency ID – currency of valuation estimate as published (may not        Currency             Y
                    be local currency)

ServiceArea         Area of site (hectares) to which valuation is applied (if available or                         Y
                    relevant)

Biophysical/        Comments on biophysical or ecological nature of the valuation
ecological          context
Comments
ValuationMethodID   Valuation method ID – indicates methodology used to estimate              Valuation method     Y
                    value.

OtherMethod         Comments field on valuation method

ValueTypeID         Value type ID – identifies whether estimated value is a point          Value type              Y
                    estimate, a range, a (net) present value (i.e. discounted), annualised
                    value, aggregated TEV, etc.

Value               Estimated value as reported in study                                                           Y

PointValue          Estimated values including mean values if a range was given                                    Y

Agg_value           Aggregate value – if value is given on a per hectare basis, i.e. total                         Y
                    value of site

ValueRangeLow       Lower bound value if range was stated                                                          Y

                                                          4
THE ECONOMICS OF ECOSYSTEMS AND BIODIVERSITY
                                             VALUATION DATABASE - MANUAL

Table 1 part2
Variable             Description                                                           Linked worksheet        In
                                                                                                                SPSS
                                                                                                              version

Unit                 Unit of expressed value                                                                    Y

Per_ha_dummy         Dummy = 1 if value is per hectare                                                          Y

Per_hhold_dummy      Dummy = 1 if value is per household                                                        Y

Value_ha             Value per hectare                                                                          Y

TEV                  Dummy = 1 if value represents TEV                                                          Y

CostIncluded         Dummy = 1 if costs are included in value estimate                                          Y

CostDescription      Comment on costs                                                                           Y

Period               Period over which valuation applies                                                        Y

DiscountRate         Discount rate used (if relevant or stated in study)                                        Y

                     Beneficiary ID – identifies who are the beneficiaries of the          Beneficiary          Y
BeneficiaryID        ecosystem service being valued
ProviderID           Provider ID – identifies who is providing the ecosystem service       Provider             Y

Unit Price           Price per unit of ecosystem service (e.g. provisioning goods)

Unit Price Unit      Unit for ecosystem service unit prices

Unit Price           Description of ecosystem unit prices
Description
ES Indicator Value   Physical value of ecosystem service supply

ES Indicator Unit    Units of ecosystem service supply

ES Indicator         Description of ecosystem service supply
Description
Assumptions          Comments added by de Groot et al (2010) on valuation assumptions

Comments             Comments added on forest and woodland biome only during
                     Hussain et al. (2011) review

LCU_used             Dummy = 1 if value reported in local currency units (several values                        Y
                     reported in US$ or other common currency)

LCU_value            Value in local currency units in publication year                                          Y

LCU_agg_value        Aggregate value in local currency units in publication year                                Y

LCU/ha value         Value per hectare in local currency units in publication year                              Y

LCU GDP deflator     GDP deflator to 2007 values (local currency units)                                         Y

LCU2007_value        Value in 2007 local currency units                                                         Y

LCU2007_agg_         Aggregate values in 2007 local currency units                                              Y
value
LCU 2007/ha          Value per hectare in 2007 local currency units                                             Y

2007 PPP             Purchasing power parity exchange rate from local currency units to                         Y
                     US$ (2007 values)

US$ 2007_value       Value in 2007 US$                                                                          Y

US$ 2007_agg_        Aggregate value in 2007 US$                                                                Y
value
US$ 2007/ha          Value per hectare in 2007 US$                                                              Y

                                                            5
4 Database summary
In this section we summarise the key data in the database. Figure 1 presents the numbers of both studies and value
estimates for each biome and indicates that inland wetlands and tropical forests are particularly well represented.
There is also a strong presentation of coastal wetlands (e.g. mangroves) and coral reefs. Biomes which have very
low representation include marine, deserts, cultivated and urban (each less than 2% of studies). The distribution
of studies and value estimates across regions is presented in Figure 2, although there is wide spatial spread of
value estimates some areas are better represented than others; the Americas (including the Caribbean), Europe,
Eastern and Southern Africa, South and South Eastern Asia, and Australasia are well represented. North Africa,
Western Asia and Asia are notable areas with poor representation. The figures illustrate that across both biomes
and regions it is common for individual studies to report multiple value estimates; although as Figure 3 illustrates,
of the 248 studies in the database6 , 85 studies provide a single value estimate. The distribution of value estimates
by biome type is also mapped in Figure 4.

The database contains values for 30 categories of ecosystem services. Table 1 for a lists these together with com-
parisons to common ecosystem service classifications (MA, TEEB and CICES). As a reflection of it origin the database
is most closely linked to the TEEB classification. It also contains a number of amalgamated and ‘other’ categories.
These reflect the valuation literature which often does not conform to a specific ecosystem service classification;
may not segregate individual services for practical reasons; or may pre-date the widespread use of the framework.
The distribution of the value estimates by broad type of ecosystem service is mapped in Figure 5. Together with
Figure 6 this illustrates the relative dominance of provisioning services valuations in developing countries compared
to larger proportions of regulating and cultural service valuations in the developed countries.

Figure 1 Number of studies (dark) and value estimates (light) by biome

                            Marine                  7             17
                            Coastal                    20                52
                  Inland Wetlands                             49                                          245
                       Fresh water                  12              29
    Forests (Temperate and Boreal)                       31                   90
                        Woodlands                   12                   52
                         Grasslands                     24              45
                             Desert                2          3
                         Cultivated                 12             18
                             Urban                 1          4
               Multiple Ecosystems                  12              32
                        Coral Reefs                          46                         153
                    Tropical Forest                           55                                            260
                 Coastal wetlands                             49                           168

6
 Note that the number of studies in figures 1 and 2 sum to 332 and 308 respectively, these figures exceed the total of 248 studies as some studies will report values
for multiple biomes or regions.

                                                                                   6
THE ECONOMICS OF ECOSYSTEMS AND BIODIVERSITY
VALUATION DATABASE - MANUAL
Figure 2 Distribution of studies (dark) and value estimates (light) by region
Africa 2 3
Northern Africa 2 2
Eastern Africa 27 138
Western Africa 6 10
Middle Africa 5 26
Southern Africa 13 58
Northern America 46 127
Central America 15 54
Caribbean 14 39
South America 18 85
Asia 1 1
Eastern Asia 6 17
Western Asia 5 8
Southern Asia 17 67
South-Eastern Asia 46 197
Europe 3 18
Northern Europe 21 71
Eastern Europe 2 5
Western Europe 8 21
Southern Europe 6 47
Note that some regional categories cover multiple
sub-regions reflecting the scope or aggregation level
Australia and New Zealand 16 54 of the study. For example, the region ‘Europe’ refers to
Melanesia 3 5 studies estimating values across the whole of Europe.
Micronesia 1 1
Polynesia 3 36
World 22 78
Figure 3 Frequency of valuation estimates per study
90
80
70
Frequency of studies
60
50
40
30
20
10
0
5 10 15 20 25 30 35 40
Numberof value estimates per study
7Figure 4 Location and represented biomes of value estimates
Biomes
Forests (Temperate and Boreal) Grasslands Fresh water Coastal Multiple ecosystems
Tropical Forest Cultivated Inland wetlands Coral Reefs Urban
Woodlands Desert Coastal wetlands Marine
source: Jemps,Flickr
8THE ECONOMICS OF ECOSYSTEMS AND BIODIVERSITY
VALUATION DATABASE - MANUAL
Figure 5 Location and represented ecosystem service types of value estimates
Ecosystem service types
Provisioning Regulating Cultural Habitat Aggregated Various
source: Jemps,Flickr
source: Jemps,Flickr
9Table 2 Ecosystem service categories and comparison with common classifications
(adapted from Maes et al 2012)
Category TEEB Database MA TEEB CICES class
categories categories
Terrestrial plants and animal foodstuffs
Food provisioning Food (fodder) Food Freshwater plants and animal foodstuffs
Marine algae and animal foodstuffs
Potable water
Water supply Fresh water Water
Non-potable water
Provisioning Provisioning of raw Fibre, timber Raw Materials Biotic materials
services material Genetic resources Genetic resources Biotic Materials (Genetic resources)
Provisioning of genetic Biochemicals Medicinal Biotic Materials (Medicinal and cosmetic
resources Ornamental resources resources)
Provisioning of medical resources Ornamental Biotic Materials (Ornamental resources)
resources resources Biomass based energy
Provisioning of
ornamental resources
Air quality regulation Air quality Air quality Atmospheric regulation
regulation regulation
Water purification Bioremediation
Waste treatment
Waste treatment and water Dilution and sequestration
(water purification)
treatment Water quality regulation
Regulation of water Regulation of
flows water flows
Water regulation Water flow regulation
Moderation of extreme Moderation of
events extreme events
Erosion prevention Erosion regulation Erosion prevention Mass flow regulation (erosion
protection)
Regulating
services (MA Atmospheric regulation
Climate regulation Climate regulation Climate regulation
and TEEB) Air flow regulation
Maintenance of soil Soil formation Maintenance of Pedogenesis and soil quality regulation
fertility (supporting soil fertility
Regulating and services)
maintenance
Pollination Pollination Pollination Lifecycle maintenance, habitat and gene
(TEEB database
pool protection
and CICES)
(pollination)
Pest regulation Pest and disease control including alien
Biological control Biological control
Disease regulation species
Lifecycle maintenance Primary Maintenance of life
(esp. nursery service) production cycles of migratory Primary production and gene pool
Nutrient cycling species (incl. protection
nursery service)
Maintenance of
Protection of gene pool genetic diversity Lifecycle maintenance, habitat and gene
(conservation) (especially in gene pool protection
pool protection)
10THE ECONOMICS OF ECOSYSTEMS AND BIODIVERSITY
VALUATION DATABASE - MANUAL
Table 2 part2
Category TEEB Database MA TEEB CICES class
categories categories
Spiritual experience Spiritual and Spiritual Spiritual
religious values experience
Aesthetic information Aesthetic values Aesthetic Aesthetic, Heritage
information
Inspiration for Spiritual
Inspiration for culture,
Cultural diversity culture, art and Aesthetic, Heritage
Cultural art and design
design
services
Opportunities for Recreation and Recreation and Recreation and community activities
recreation and tourism ecotourism tourism
Information for
Knowledge Information
cognitive development
systems and for cognitive Information
(education and
educational values development
science)
Various ecosystem services
Other
Total Economic Value
Provision of Electricity/Energy by natural forces
Combined
Cultural values combined/unspecified
categories or
Provisioning values combined/unspecified
‘Other’
Regulating values combined/unspecified
Habitat values combined/unspecified
source: www.grida.no
11Figure 6 Proportion of value estimates for each ecosystem service category by continent
(figures in bars refer to number of estimates)
Note that some regional
Africa 2 1 categories cover multiple
Northern Africa 1 1 sub-regions reflecting the
Eastern Africa 84 22 16 10 5 scope or aggregation level of
Western Africa 6 1 1 1 1 the study. For example, the
Middle Africa 12 7 2 3 2 region ‘Africa’ refers to studies
Southern Africa 36 6 5 10 aggregating values across the
whole of Africa
Northern America 44 29 28 12 12
Central America 21 12 14 7
Caribbean 8 6 13 5 7
South America 38 20 9 14 4
Asia 1
Eastern Asia 3 6 5 1 2
Western Asia 4 1 2 1
Southern Asia 32 12 15 3 3
South-Eastern Asia 94 45 26 20 8
Europe 1 10 7
Northern Europe 10 11 35 13 2
Western Europe 7 7 6 1
Eastern Europe 2 1 1 1
Southern Europe 10 6 14 5 12
Australia and New Zealand 11 10 9 12 12
Melanesia 4 1
Micronesia 1
Polynesia 13 9 10 3
World 26 18 15 14 5
0% 10% 20% 30% 40% 50% 60% 70% 80% 90% 100%
Provisioning Regulating Cultural Supporting Aggregated Various
Figure 7 Proportion of value estimates for each ecosystem service category by biome
(figures in bars refer to number of estimates)
Marine 7 1 5 3 1
Coastal 23 5 10 7 6
Inland Wetlands 116 52 30 30 15
Fresh water 14 5 5 2 3
Forests (Temperate and Boreal) 10 16 35 26
Woodlands 26 10 4 7 5
Grasslands 14 14 5 5 7
Desert 2 1
Cultivated 9 3 1 2 3
Urban 2 1 1
Multiple Ecosystems 16 4 6 4 1 1
Coral Reefs 47 24 53 13 16
Tropical Forest 105 73 47 29
Coastal wetlands 80 30 20 12 21 5
0% 20% 40% 60% 80% 100%
Provisioning Regulating Cultural Supporting Aggregated Various
12THE ECONOMICS OF ECOSYSTEMS AND BIODIVERSITY
VALUATION DATABASE - MANUAL
The different patterns of valuation studies are also apparent in the distribution of different ecosystem service
types for each biome (see Figure 6). A particular contrast can be seen when comparing temperate and tropical
forests. Valuations for temperate forests, largely found in developed countries, are dominated by values for cultural
services (recreation) and supporting services (biodiversity); tropical forest value estimates cover a broader range of
ecosystem services. We speculate that this arises for two reasons:
i. Interest in valuing ecosystem services in developing country contexts has been motivated by the conservation
of natural ecosystems and there is a need to demonstrate the benefits provided by those systems in contrast to
destructive or extractive uses such as logging or conversion to agriculture.
ii. Ecosystems in developed countries have historically seen more intensive human management (particularly
for extractive and productive uses) therefore there is far less reliance on remaining natural ecosystems for
provisioning services - food and raw materials for which market values are readily observed.
Figure 8 Numbers of value estimates by valuation method
Direct market pricing 427
Factor Income / Production Function 32
Avoided Cost 68
Replacement Cost 39
Mitigation and Restoration Cost 10
Travel Cost 19
Hedonic Pricing 2
Contingent Valuation 102
Group Valuation 20
PES 3
Benefit Transfer 270
Total Economic Value 24
Other 25
Unknown 127
Figure 8 presents the number of value estimates by valuation method. The largest proportion (37%) are from direct
market pricing and will relate to provisioning services and some cases visitor spending at recreation sites (as
distinct from travel cost estimates). Values derived from benefit transfer make up the next largest proportion (23%)
and these estimates should be treated with care depending on the use being made of the database (see discussion
below). The valuation method was not identified in 11% of estimates, and again care should be taken when using
these studies.
Where possible we have converted all values to a common unit, year and currency viz. 2007 US$/ha/annum. The
data used for the currency conversions and deflations were obtained from the World Bank’s World Development
Indicators dataset (World Bank, 2010). These calculations involved first estimating the year of study value per ha
per annum in local currency units (if reported in another currency such as US$ these were converted to local units
using the appropriate purchasing power parity exchange rate). Per ha values in local currency units were adjusted
to 2007 values using appropriate national GDP deflators and then converted to US$ using the relevant purchasing
power parity exchange rate7 .
7
The reason for converting a reported US$ estimate to local currency using the appropriate PPP exchange rate and then back to 2007 US$ was so as to track
changes in the local currency, which is arguably more methodologically defensible for values elicited from local residents. Those studies that elicited values from
foreign visitors were not subject to this two-stage conversion.
135 Use of the database
5.1 Summary ecosystem service values
The preceding summary of the database contents illustrates its most straightforward use. The table formatting of
the Excel database allows selection and filtering by single or multiple variables to identify studies and values of
interest. Suggested categories for such summary analysis include:
— Region;
— Country;
— Ecosystem;
— Biome;
— Ecosystem services;
— Valuation method;
— Combinations of these.
The use of summary analysis is suited to high level reporting and in identifying key data gaps in valuation coverage
for key categories.
5.2 Identification of relevant studies for benefit transfer
The spreadsheet database can be interrogated to identify individual studies that can then be used for either unit
or value function benefit transfer. In the former case users can filter and select estimates for sites, ecosystems
or ecosystem services with characteristics that closely match policy sites to which they wish to transfer values8
Similarly, studies can be selected to identify appropriate value functions. The database does not report the
parameters of value functions so once studies have been selected users will need to consult the original sources.
UNEP have published guidance on the use of value transfer for ecosystem services (Brander, 2013).
Researchers may also refer to Department of Environment, Food & Rural Affairs’ (Defra) practical guidelines for
the use of value transfer in policy and project appraisal (2009). These guidelines may help researchers decide on
various questions. These include:
— Deciding if value transfer is appropriate for a given appraisal;
— Selecting the most appropriate approach to value transfer and applying an appropriate level of effort;
— Selecting the most suitable economic value evidence;
— Implementing the steps of value transfer; and
— Presenting the results of value transfer to inform decision-making.
8
In benefit transfer terminology the ‘policy site’ is the site to which values are transferred; the ‘study site’ is the site from which values are transferred.
14THE ECONOMICS OF ECOSYSTEMS AND BIODIVERSITY
VALUATION DATABASE - MANUAL
5.3 Meta-analysis
The range of variables contained in the database should allow users to undertake meta-analyses of values for
ecosystems and ecosystem services of interest. This may be of particular use when transferring values to a large
number of policy sites. Before proceeding with such analyses we recommend that users undertake the following
steps:
— Review the original studies if possible (see caveats below);
— Transform categorical variables into dummy values;
— Ensure values are in common units, e.g. US$/ha;
— Investigate distributions of quantitative values such as site size and per hectare value – skewed distributions are
common and log transformations might be appropriate;
— Identify and enter additional variables as required.
6 Caveats
There are a number of important caveats that users of the database should be aware of before using it and reporting
any analysis. The extent to which these are problematic will depend on the intended use of the valuation data.
— The database is a ‘snapshot’ of available valuation studies from a convenience sample of available sources
and the personal knowledge of those originally compiling it. The search for valuation studies did not use pre-
defined search terms or data sources so the identification of studies cannot be considered fully systematic. The
data sources used are likely to rely on both self reporting and the particular search criteria of those creating
earlier data sources. Consequently the database cannot be considered fully comprehensive and it has not been
updated with new studies since originally compiled in 2008.
— The studies in the database have been compiled from a variety of sources, each of which may have originally
created for different purposes, there is likely to be variation in standard of data entry. We would therefore
recommend that users review the original studies if consistent variables are required, particularly for meta-
analysis applications. These differing standards of variable entry include the study site coordinates – for some
studies these refer to the specific site being valued, for others it is the location of the capital city of the country
where the valuation applies. Any analysis using values from the database involving a spatial element or linking
to additional spatial data should ensure that the appropriate site coordinates are used.
— Hussain et al (2011) used the forest (temperate and tropical) and woodland biome studies from the original
database to undertake a spatial meta-analysis and have reviewed most of the studies for those biomes.
Consequently, spatial variables such as site coordinates and area have been reviewed and updated where
necessary. However the criteria for inclusion meant that values derived using benefit transfer or without a
defined spatial location were rejected from further analysis and were not reviewed. The current database
15retains these values as these may be acceptable where only summary values are needed. We recommend that
transferred values are not used for further benefit transfer or meta-analysis.
— Users may wish to review the original studies to ensure that the methodological, ecosystem service and site
characteristics are consistent with their descriptions of those variables. For example, the valuation method
category ‘contingent valuation’ includes a wider range of stated preference methods including discrete choice
experiments9 . Within the range of contingent valuation studies the variety of elicitation methods (open-ended,
payment cards/ladders, bidding games, referendum formats) are not identified but these may be important
particularly for meta-analysis.
— Users should be aware that 270 of the values in the database were derived from benefits transfer. We would not
recommend that these are used for further transfer or meta-analysis to avoid compounding transfer errors.
Users should refer to the original studies if possible.
— Users should be aware that many valuation studies were undertaken before the widespread adoption of the
ecosystem services framework as a means of classifying environmental goods. Consequently, although entries
in the database have been coded to reflect the most relevant ecosystem service, the original definition of the
environmental good may not directly translate to the categories used for coding. The valued good may in fact
cover multiple ecosystem service categories with little indication of how value may be apportioned across them,
this issue may be of relevance for stated preference studies.
— The description of the ecosystem or biome may also be generalised to fit within the pre-defined categories of
the database. Users may need to refer to the original studies if very specific ecosystems are of interest.
— Lastly, users should be aware that the values attributed to ecosystem services depend on social, cultural
and economic context, and will differ between people and over time. Also, demand-based valuation methods
(including both market and non-market values) depend on the size and “ability to pay” of the relevant stakeholder
population. Awarness of the size of the original study site is also important as marginal willingness is likely to
decline as site area increases. Meta-analysis and benefits transfer approaches need to take this into account
for comparing or aggregating values across locations or different scales (Guidance Manual for TEEB Country
Studies, 2013).
source: Jemps,Flickr
9
We were unable to review all studies to refine the definition of valuation method when preparing the database for publication.
16THE ECONOMICS OF ECOSYSTEMS AND BIODIVERSITY
VALUATION DATABASE - MANUAL
7 References
Brink P, Bassi S, Gantioler S, Kettunen M, Rayment Environment Programme.
M, Foo V, Bräuer I, Gerdes H, Stupak N, Braat L, Kumar, P. (ed) (2010). The Economics of Ecosystems
Markandya A, Chiabai A, Nunes P, ten Brink B and Biodiversity: Ecological and Economic
and van Oorschot M (2009) Further Developing Foundations. ISBN 9781849712125, Earthscan,
Assumptions on Monetary Valuation of Biodiversity London, UK
Cost Of Policy Inaction (COPI), Institute for Millennium Ecosystem Assessment (2005) Ecosystems
European Environmental Policy (IEEP).Contract and Human Well-Being: Current State and Trends,
07.0307/2008/514422/ETU/G1 Report for the DG Island press, Washington DC.
Environment of the European Commission. Maes J, Teller A, Liquete C, Erhard M, Berry P, Egoh
Brander L (2013) Guidance Manual on Value Transfer B, Braat L, Puydarrieux P, Fiorina C, Santos F,
Methods for Ecosystem Services, United Nations Paracchini ML, Keune H, Wittmer H, Fiala I, Verburg
Environment Programme. P, Conde S (2012) Mapping and Assessment of
Conservation International (2006) Consvalmap: Ecosystems and their Services: An analytical
Conservation International Ecosystem Services framework for ecosystem assessments under Action
Database, http://www.consvalmap.org 5 of the EU Biodiversity Strategy to 2020, Discussion
ENVAlue (2004) Environmental Valuation Database, paper, Draft version 8.3 (25/08/2012) www.eccb2012.
Developed by: New South Wales Environmental org/userfiles/MAESWorkingPaper_v8_3.pdf Ojea
Protection Agency, New Zealand. http://www. E, Nunes PALD and Loureiro ML (2009) Mapping of
environment.nsw.gov.au/envalue/ Forest Biodiversity Values: A Plural Perspective,
EVRI (1997) The Environmental Valuation Reference Fondazione Eni Enrico Mattei Working Papers, 264pp.
Inventory (EVRI). Developed by De Civita P, Filion F van der Ploeg S, Wang Y and de Groot D (2010) The
and Frehs J of Environment Canada. Available at: TEEB Valuation Database: An introduction and
www.evri.ca overview of data and results. Final report for TEEB
FSD (2007) Nature Valuation and Financing CaseBase, – D0-report. FSD and Wageningen University,
Foundation for Sustainable Development, Wageningen, The Netherlands
Wageningen, the Netherlands. http://www. Sundberg S and Söderqvist T (2004) ValueBaseSWE: A
eyes4earth.org/casebase/ valuation study database for environmental change
de Groot RS, Kumar P, van der Ploeg S and Sukhdev P in Sweden, Beijer International Institute of Ecological
(2010) Estimates of monetary values of ecosystem Economics: The Royal Swedish Academy of Sciences,
services. Appendix 3 in: Kumar, P. (ed) (2010). Stockholm. www.beijer.kva.se/valuebase.htm
The Economics of Ecosystems and Biodiversity: TEEB - The Economics of Ecosystems and
Ecological and Economic Foundations. ISBN Biodiversity (2013): Guidance Manual for TEEB
9781849712125, Earthscan, London, UK Country Studies. Version 1.0. http://www.
de Groot RS, Brander L, van der Ploeg S, Bernard teebweb.org/wp-content/uploads/2013/06/TEEB_
F, Braat L, Christie M, Costanza R, Crossman N, GuidanceManual_2013_1.0.pdf
Ghermandi A, Hein L, Hussain S, Kumar P, McVittie UK National Ecosystem Assessment (2011) The UK
A, Portela R, Rodriguez LC and ten Brink P (2012). National Ecosystem Assessment Technical Report.
Global estimates of the value of ecosystems and UNEP-WCMC, Cambridge.
their services in monetary units, Ecosystem Services UVM (2008) Ecosystem Service Database (ESD) / ARIES,
1(1): 50-61. Developed by University of Vermont, USA. http://esd.
Haines-Young R and Potschin M (2011) Common uvm.edu/
International Classification of Ecosystem Services Valuing Environmental Impacts: Practical Guidelines
(CICES): 2011 Update, Paper prepared for discussion for the Use of Value Transfer in Policy and Project
at the expert meeting on ecosystem accounts Appraisal. Non-Technical Summary. Submitted to
organised by the UNSD, the EEA and the World Bank, Department for Environment, Food and Rural Affairs.
London, December 2011 http://www.unstats.un.org/ February 2010
unsd/envaccounting/seeaLES/egm/Issue8a.pdf Wilson MA, Costanza R and Troy A (2004) The EcoValue
Hussain SS, McVittie A, Brander L, Vardakoulias Project, Retrieved from the University of Vermont
O, Wagtendonk A, Verburg P, Tinch R, Fofana A, EcoValue. See: http://ecovalue.uvm.edu
Baulcomb C, Mathieu L (2011). The Economics World Bank (2010) World Development Indicators,
of Ecosystems and Biodiversity: The Quantitative World Bank, Washington http://data.worldbank.org/
Assessment. Draft Final Report to the United Nations data-catalog/world-development-indicators
17Appendix A Original Access database relationships
1 Biomes image
Biome IMAGE ID
Biome IMAGE code
Biome IMAGE name
1
Scale of Research
All Values In Local
Scale of Research ID Currency
Scale of Research Value ID
Country Scale Link ID Valuation ID
Case ID
Currency ID
Year Of Validation
∞ 1 ∞ Values Unit Local Currency
Locations Value ID Value Local
Location ID ∞
Location ID
Location Name Country ID
Country ID Editor ID
∞ Biome IMAGE ID ∞
Modifier ID ∞ 1
Protected Status ID Reference ID Reference
Latitude N-S Purpose / Aim of valuation Reference ID
Longitude E-W 1 Reference
ES Service ID 11
Latitude2 N-S 1 ∞ Authors
Country ESS Subservice ID Biomes
Longitude2 E-W ESS Service Use Biome ID Title
Country ID
Scale of Research Other ESS Biome First Author
UN Country ID
Biome ID Year Of Publication
ISO3166 Code
Ecosystem ID File Name
Country Name
Year Original Data Reference Type ID
Country regions 1 ∞ Local Official Currency ID
Year of Validation ∞ 1 ∞ Reviewed ∞
image Official Name English
Currency ID Ecosystems Publication Name
IMAGE Region CD Alpha-2 Code
Service Area Ecosystem ID Volume
Image Region Alpha-3 Code
Biophysical/ecological Comments Ecosystem Issue
OECD 10 Region CD IMGREGCD
Valuation Method ID Biome 13 ID Page First
OECD 3 Region CD Region
Other Method Biome 17 ID Page Last
OECD 13 Region CD Continent
Value Type ID Description Source Of Reference
VIB Region CD Type of Country
Value Hardcopy ?
GNI per Capital 2006
WB Income Class 2007 Value Range Low
TEEB Income Class 2007 Value Range High
WB Income Class 2009 Unit
TEEB SocioEcon Class 2007 Aggregated TEV
Same as Costanza 1997
Tbl Socio Economical 1 ∞ Population Density 2005
Population Density Class 2005 ID Partially as Costanza 1997
Class
Notes Cost Included ? ∞ 1 1 ∞
ES Class ID Cost Description Currencies Exchange rates usd
Remarks
SE Class Period Currency ID Exchange Rate ID
SE Class Short Discount Rate Currency Abbr Currency ID
Years Discount Rate Notes Year of Validation
Beneficiary ID Exchange Rate USD
Provider ID
Unit Price
∞ 1 1 ∞ Unit Price Unit
ES Subservice Es Service
Unit Price Description ∞ 1 1
ES Subservice ID ES Service ID valuation method
ES Indicator Value
ES Service ES Service Long Valuation Method ID Reference type
ES Indicator Unit
ES Service ID ES Service Group Valuation Method Reference Type ID
ES Indicator Description
Value Type Valuation Method Accro Reference Type
Specific Calculation
Conversion Notes
Assumptions
Checked?
∞ 1
Actual or Potential Value ID value type
Actual Or Potential Benefit Value Type ID
Actual or Potential Benefit ID Value Type
Actual or Potential Value Description
18THE ECONOMICS OF ECOSYSTEMS AND BIODIVERSITY
VALUATION DATABASE - MANUAL
Appendix B Database worksheet description
Sheet name Description
Location Details of the valuation study site name, its country, type of biome, protected status,
coordinate (decimal degrees), and scale of study (from local to global)
Country Country name, continent and region. Selection of socio-economic classification
variable
Reference Details of the authorship, title, type and source of valuation study including both the
original publication and the database it was sourced from
Reference Type Type of publication the valuation study was contained in, e.g. journal paper, book,
report, thesis
ES Service Classification of ecosystem service type (30 categories) including broad category
(provisioning, regulating, cultural, supporting) and value type (direct use, indirect use,
non-use)
ES Subservice More detailed classification of ecosystem services (90 categories) within each ES
Service classification
Biome Classification of relevant study biome (16 categories)
Ecosystem Classification of ecosystem (60 categories) with links to higher level biome categories
Currency Name of currency including notes field on changes in official currency (e.g. adoption
of the Euro)
Valuation method Classification of valuation method
Value type Description of the type of value reported, e.g. total value, value range, net present
value, total economic value etc.
Beneficiary Description of the population that benefited from the ecosystem service being valued
Provider Description of the provider of the ecosystem service being valued
Miscellaneous Look up tables referred in the worksheets above but not directly linked to the main
database sheet
source: TeraBio,Flickr
19Appendix C Cross-tabulations of region and biome
Forests (Temperate and Boreal)
Multiple Ecosystems
Coastal Wetlands
Inland Wetlands
Tropical Forest
Fresh Water
Coral Reefs
Grasslands
Woodlands
Cultivated
Total
Coastal
Marine
Desert
Urban
Africa 2 1 3
Asia 1 1
Australia and New Zealand 1 4 8 1 1 2 5 2 7 21 2 54
Caribbean 2 1 28 8 39
Central America 11 2 3 31 7 54
Eastern Africa 3 6 60 2 2 6 1 2 3 16 6 17 14 138
Eastern Asia 3 1 1 8 4 17
Eastern Europe 5 5
Europe 3 1 8 2 4 18
Melanesia 1 4 5
Micronesia 1 1
Middle Africa 5 1 20 26
Northern Africa 2 2
Northern America 5 23 14 12 1 11 1 2 16 2 40 127
Northern Europe 8 4 13 33 1 3 1 8 71
Polynesia 2 21 13 36
South America 20 1 9 4 12 39 85
South-Eastern Asia 2 10 25 1 3 1 12 36 58 49 197
Southern Africa 1 2 37 1 8 7 1 1 58
Southern Asia 1 2 4 1 12 31 16 67
Southern Europe 6 6 3 6 11 1 4 4 1 5 47
Western Africa 7 1 1 1 10
Western Asia 2 3 1 2 8
Western Europe 7 8 1 2 1 2 21
World 4 20 1 10 7 8 24 4 78
Total 17 56 245 29 86 52 45 3 18 4 32 153 260 168 1168
20THE ECONOMICS OF ECOSYSTEMS AND BIODIVERSITY
VALUATION DATABASE - MANUAL
Appendix D Cross-tabulation of region and ecosystem services
Provisioning Services
Cultual services
Extreme events
Raw Materials
Ornamental
Water flows
Soil fertility
Recreation
Pollination
Inspiration
BioControl
Air quality
Genepool
Aesthetic
Cognitive
Spiritual
Nursery
Medical
Climate
VArious
Erosion
Genetic
TOTAL
Energy
Waste
Water
Other
Food
TEV
Africa 1 1 1 3
Asia 1 1
Australia and New 4 4 1 1 1 1 1 2 1 3 1 2 1 1 2 6 8 12 1 1 54
Zealand
Caribbean 6 1 1 1 4 1 5 12 1 7 39
Central America 11 4 3 3 5 3 3 1 1 1 5 14 54
Eastern Africa 33 5 37 7 1 9 1 1 8 3 2 3 5 16 1 5 1 138
Eastern Asia 1 1 1 2 1 1 1 1 1 3 2 1 1 17
Eastern Europe 1 1 1 1 1 5
Europe 1 2 1 6 1 7 18
Melanesia 2 1 1 1 5
Micronesia 1 1
Middle Africa 6 1 4 1 2 3 1 1 1 2 2 2 26
Northern Africa 1 1 2
Northern America 16 11 3 1 1 3 10 8 1 5 1 1 1 10 3 23 1 2 12 4 1 9 127
Northern Europe 7 3 2 5 4 2 11 33 1 2 1 71
Polynesia 4 1 6 2 2 4 1 1 1 1 2 1 5 2 2 1 36
South America 14 3 11 1 6 2 6 4 1 2 6 2 2 1 2 7 5 2 1 1 4 1 1 85
South-Eastern Asia 47 6 30 1 6 13 15 3 2 9 1 5 14 25 1 3 1 8 3 4 197
Southern Africa 20 2 11 2 1 2 1 2 1 1 9 5 1 58
Southern Asia 14 3 11 4 3 5 1 2 1 1 2 15 2 3 67
Southern Europe 1 4 5 2 2 1 1 2 3 11 12 3 47
Western Africa 3 2 1 1 1 1 1 10
Western Asia 2 2 1 1 1 1 8
Western Europe 3 4 1 5 1 1 4 1 1 21
World 10 3 9 2 2 9 3 6 2 1 4 1 6 1 13 1 5 78
Total 206 44 148 13 34 7 4 70 63 12 52 29 14 9 9 15 91 7 194 6 2 7 12 1 87 9 6 17 1168
21 22
You can also read