The Emerging Gait Dysfunction Phenotype in Idiopathic Parkinson's Disease - bioRxiv
←
→
Page content transcription
If your browser does not render page correctly, please read the page content below
bioRxiv preprint first posted online May. 17, 2019; doi: http://dx.doi.org/10.1101/632638. The copyright holder for this preprint
       (which was not peer-reviewed) is the author/funder, who has granted bioRxiv a license to display the preprint in perpetuity.
                                    It is made available under a CC-BY-NC-ND 4.0 International license.

                       The Emerging Gait Dysfunction Phenotype in Idiopathic Parkinson’s Disease
    Frank M. Skidmore, MD;1,2 William S Monroe, MS;2,3,4 Christopher Hurt, PhD;5 Anthony P Nicholas, MD;1
     Adam Gerstenecker, PhD;1 Thomas Anthony, MS;2 Leon Jololian;2 Gary Cutter, PhD;4 Adil Bashir, PhD;7
               Thomas Denny, PhD;7 David Standaert, MD, PhD1 and Elizabeth A Disbrow, PhD.8
1
  Department of Neurology, University of Alabama at Birmingham, Birmingham, AL
2
  Department of Electrical and Computer Engineering, University of Alabama at Birmingham, Birmingham, AL
3
  Department of Materials Science and Engineering, University of Alabama at Birmingham, Birmingham, AL
4
  School of Public Health (Dept of Biostatistics), University of Alabama at Birmingham, Birmingham, AL
5
  School of Health Professions (Dept of Physical Therapy), University of Alabama at Birmingham,
Birmingham, AL
6
  Joint Institute for Computational Sciences, University of Tennessee, Oak Ridge, TN
7
  Auburn University Department of Computer and Electrical Engineering, Auburn, AL
8
  Department of Neurology, Louisiana State University Health Center, Shreveport, LA

Corresponding author: Frank M. Skidmore, MD
Corresponding author’s address: SC 350, University of Alabama at Birmingham 35233-0017

Corresponding author’s phone and fax: Phone: (205) 934-0683; Fax: (205) 326-9436
Corresponding author’s e-mail address: fskidmore@uabmc.edu

Running head: Brainstem Phenotypes of Early PD

Number of words in abstract: 224
Number of words: 4,327
     Introduction: 406
     Methods:       1507
     Results:       1136
     Discussion: 1278

Number of figures: 3
Number of tables: 5(6)
1 Schematic
Acknowledgement statement (including conflict of interest and funding sources): There are no conflicts of
interest associated with this publication. We would like to acknowledge the funding of the National Institutes of
Health through K23NS083620, and grant funding from the Michael J Fox Foundation in support of this research.
Data used in the preparation of this article were obtained from the Parkinson’s Progression Markers Initiative
(PPMI) database (www.ppmi-info.org/data). For up-to-date information on the study, visit www.ppmi-info.org.
PPMI – a public-private partnership – is funded by the Michael J. Fox Foundation for Parkinson’s Research and
funding partners, including Abbvie, Allergan, Avid Radiopharmaceuticals, Biogen, Biolegend, Bristo-Myers
Squib, Denali, GE Healthcare, Genentech, GlaxoSmithKline, Lilly, Lundbeck, Merck, Meso Scale Discovery,
Pfizer, Roche, Sanofi Genzyme, Servier, Takeda, Teva, and UCB (see www.ppmi-info.org/fundingpartners).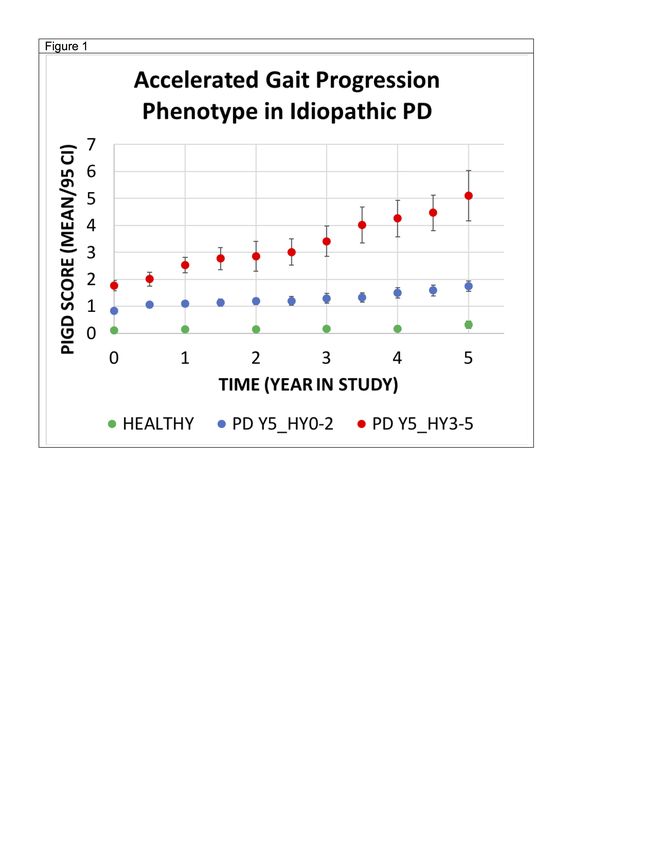
bioRxiv preprint first posted online May. 17, 2019; doi: http://dx.doi.org/10.1101/632638. The copyright holder for this preprint
      (which was not peer-reviewed) is the author/funder, who has granted bioRxiv a license to display the preprint in perpetuity.
                                   It is made available under a CC-BY-NC-ND 4.0 International license.

                                                                   ABSTRACT

Objective: Severity of motor symptoms in Parkinson’s disease (PD), and rate of change of these symptoms,
suggests the existence of disease subgroups. One important PD subgroup is defined by postural instability and
gait dysfunction (PIGD), which is associated with disability, lower quality of life, and cognitive deterioration. In
this study, we evaluate what clinical factors at baseline are associated with early development of postural
instability in PD.

Methods: Data was downloaded from the Parkinson’s Progressive Markers Initiative (PPMI). Several clinical
features predict development of postural instability. We provisionally term the associated phenotype the
emerging gait disorder (eGD) phenotype. We evaluate validity of the phenotype in two held-out populations.

Results: Individuals with the proposed eGD phenotype have a significantly higher risk of developing postural
instability in both validation sets (p < 0.00001 in both sets). The proposed eGD phenotype occurred before
development of postural instability (HY stage ³ 3) in 289 of 301 paired comparisons (Fischer Exact Test, p <
0.000001), with a median progression time from development of eGD phenotype to postural instability of 972
days. Individuals with the proposed eGD phenotype at baseline had more rapid cognitive decline as measured
by the Montreal Cognitive Assessment (p = 0.002) and Hopkins Verbal Learning Test (Total Recall, p = 0.008).

Interpretation: We describe a clinical phenotype, detectable at baseline in a subset of individuals with PD, that
is associated with accelerated development of postural instability. Within the sample, development of the eGD
phenotype reliably precedes development of disability, and is a harbinger of more rapid cognitive progression.
bioRxiv preprint first posted online May. 17, 2019; doi: http://dx.doi.org/10.1101/632638. The copyright holder for this preprint
(which was not peer-reviewed) is the author/funder, who has granted bioRxiv a license to display the preprint in perpetuity.
It is made available under a CC-BY-NC-ND 4.0 International license.
INTRODUCTION
Severity of motor symptoms in PD, and rate of change of these symptoms over time is quite variable, suggesting
the existence of disease subgroups with varying rates of progression.1-5 Amongst this variability, individuals with
PD universally share symptomatic dopamine deficiency, which has led to a wave of innovation to assist with
management of dopaminergic-related symptoms. However, treating PD as a monomorphic condition has, as
noted by Espay et al., “consistently failed when testing potential disease-modifying interventions.6
One long recognized transition point in the development of PD-related disability is the development of postural
instability. The relationship between gait and balance and disability was first examined through the prism of the
Hoehn and Yahr (HY)7,8 scale, the first widely used PD severity scale (Table 1: Recapitulation of HY Scale).
Jankovic et al. later developed a postural instability/gait dysfunction (PIGD)9-11 score, derived from the Unified
Parkinson’s Disease Rating Scale (UPDRS),12,13 a structured history and clinical exam. Development of the PIGD
phenotype has been associated with disability and lower quality of life,14-16 more rapid progression of both
cognitive and motor dysfunction,17-19 and substantially higher risk of developing diffuse lewy body disease (DLB)
and Parkinson’s Disease Dementia (PDD).20,21 Predictably, advancing HY status is similarly associated with
reduced quality of life and cognitive decline.22,23 However, in the absence of other disabilities individuals with
PD are HY stage 1 or 2 at onset of disease. Similarly, the PD PIGD phenotype is based on clinical parameters
in later stages of disease,10-12 but is an unstable classification in early disease.24,25
A current, critical need in the field is to develop methods for early identification of individuals at risk of rapid motor
progression. Early identification of individuals at risk of progression to postural instability, in particular will serve
two important goals. First, as noted above, development of postural instability is associated with global
progression of disease, and accordingly identification of at-risk individuals in this context also identifies
individuals at higher risk of disability and cognitive progression. Second, selecting individuals with more rapid
motor progression will improve the ability to detect the impact of potential disease modifying agents. In particular,
while medication has an impact on gait in PD, in the PIGD phenotype gait is less responsive to medication.
Clinical trials design in PD is impacted by the problem of disentangling medication response from disease
progression.26,27 More effective identification of a phenotype (PIGD) with rapid deterioration of a partially
medication-unresponsive symptom may mitigate some of these trial design issues, providing the potential of a
cleaner signal of presence (or absence) of a disease modifying effect.
We accordingly set out to determine if there are clinical features – a “risk phenotype” – for gait disorder that is
detectable at baseline. We developed a risk profile in a derivation set, and evaluated the validity of this measure
in two validation sets. To operationalize our findings, we labeled our provisional phenotype the “emerging gait
disorder” (eGD) phenotype, and present our results in the form of a clinical scale, the emerging gait disorder
screening scale (eGDSS).
METHODS
Selection of Sample: Data was downloaded from the Parkinson’s Progressive Markers Initiative (PPMI)28 in
January of 2019. We screened for data sets that contained at least 5 years of clinical data and identified 380
individuals with de-novo idiopathic PD in PPMI who had at least 5 years of clinical data. A derivation idiopathic
PD (dIPD) set of 301, and a validation idiopathic PD (vIPD) set of 79 were developed. The vIPD sample was
developed based on availability of imaging in this sample (see Companion Paper, “Imaging Characteristics of
the Emerging Gait Phenotype in Idiopathic PD”).29 For additional validation, we selected the PPMI genetic cohort,
restricting our sample to individuals with HY status of 2 or better (no gait disturbance). PD inclusion criteria in
this group were diagnosis of PD for £ 7 years, and HY £ 4 at entry. All individuals in this sample had mutations
in the synuclein alpha (SNCA), leucine-rich repeat kinase 2 (LRRK2), or glucocerebrosidase 1 (GBA1) gene.
The genetic PD (GPDv) cohort at the time of this paper contained 220 enrolled individuals. Within the cohort,
141 individuals met inclusion criteria. As a comparative sample, we identified 183 healthy controls who similarly
had at least 5 years of clinical follow up. All individuals in PPMI with PD have an “on medication” evaluation at
each visit. Thus we study dIPD=301, vIPD=79, vGPD=141, Controls=183. For the purposes of this study, we
include exclusively the “on-medicine” evaluation, as we focus specifically on individuals in whom a treatment
effect is not adequate to prevent disabling gait related symptoms.bioRxiv preprint first posted online May. 17, 2019; doi: http://dx.doi.org/10.1101/632638. The copyright holder for this preprint
(which was not peer-reviewed) is the author/funder, who has granted bioRxiv a license to display the preprint in perpetuity.
It is made available under a CC-BY-NC-ND 4.0 International license.
Sample Features: Data available in PPMI, and included in our analysis, included age and gender. Pertaining
to motor assessments, we included the modified Unified Parkinson’s Disease Rating Scale, and HY rating. Given
our interest in gait and balance, we calculated PIGD score at each time point over a minimum of 5 years.
Cognitive measures included the Montreal Cognitive Assessment (MOCA), the Hopkins Verbal Learning Test
(HVLT), Letter Number Sequencing (LNS), Judgement of Line Orientation (JLO), and Symbol-Digit Modality
(SDM). All evaluations were performed at baseline and at multiple time points, allowing us to calculate both
baseline differences and rate of change by group. Slope of cognitive change in this sample was expressed by
change in mean score value divided by time in years.
For Scale Development and Sample Selection, Hoehn and Yahr Stage (HY),7,8 was dichotomized in the
derivation set (301 subjects) to categorize individuals who by year 5 had developed gait dysfunction (Y5_HY3-
5) and those who had not (Y5_HY0-2). The HY is a qualitative scale scored from 0-5 (see Table 1). A score of
3 or higher indicates the individual has developed clinically detectable postural instability during stance. We
classified a subject as Y5_HY3-5 if at any time over the first 5 years a clinical rating of HY ³ 3 was scored by
any rater while “on-medication”. The classification of Y5_HY0-2 was given to any individual who was never
classified by any rater as above HY stage 2. We also measured PIGD using the PIGD score derived by Jankovic
et al at each follow up visit.9,10 Average year 5 PIGD scores were also derived from “on-medication” evaluations
in years 4.5-6 typically generated over 3 visits, to generate a year 5 outcome variable (Y5_PIGD). Note the HY-
based classification neatly dichotomizes our sample into two groups that, during treatment (“on-medication”), are
either with, or without substantial progression of gait dysfunction, over the first 5 years of disease (Figure 1,
“Change in PIGD Score Over Time”).
For Scale Validation, we performed a survival analysis to evaluate the relationship between scale value (quartile
rank) and population time to progression of gait related disability (at least one practitioner evaluation of HY ³ 3)
in both validation sets, using a Cox proportional hazard regression model. An additional analysis compares the
utility of a 5-factor model (age, gender, and UPDRS items I, II, and III) compared to a 3-factor model (age,
gender, and eGDSS) to predict progression (Y5_PIGD).
RESULTS
Sample Characteristics: In the de-novo cohorts, the PD sample was similar to the heathy control sample. PD
subjects developing Y5_HY3-5 were older and had more severe signs and symptoms at entry (Table 2), and
were characterized by progressive gait dysfunction over time as measured by PIGD rating (Figure 1).
Development of Emerging Gait Dysfunction Screening Scale (eGDSS) Factors: The scale is designed to
capture items in the UPDRS associated with disability (onset of postural instability, HY 3 or greater). Specifically,
a logistic regression was performed comparing individual elements on the Unified Parkinson’s Disease Rating
Scale (sections 1 through 3) to HY category in a derivation set of 301 individuals with de-novo PD (216 PD
Y5_HY0-2 vs 85 PD Y5_HY3-5). The sample involved 53 multiple comparisons. Significant factors were
complaints of lightheadedness and fatigue (from UPDRS I), self-perception of alterations in speech, walking, and
ability to rise (from UPDRS II), and objective findings of difficulty rising from a seated posture and visible stooping
(from UPDRS III) at baseline, which met our criteria of p < 0.01 (adjusted for multiple comparisons) as predictors
of more rapid progression to HY stage 3 or higher within 5 years of disease diagnosis (Table 3).
Development of eGDSS Weighting (Table 3): Median and quartile analysis revealed presence (1) or absence
(0) of the factor was a dominant characteristic at baseline. Specifically, median score, bottom quartile (25
percentile) score, and top quartile (75 percentile) score reveal scores universally between 0 and 1 at the quartiles.
Therefore, to improve scale simplicity all items were binarized to present or absent, and a second logistic
regression was performed, including all factors originally identified. Scale weighting for each factor was created
by dividing individual weights of each item by the minimum weight of the lowest weighted item, and rounding.
Table 3 shows statistical properties of the group comparison, median and quartile properties by group, and
weighting strategy.
Properties of the eGDSS Scale (Table 4, Figure 2): Properties of the eGDSS in the derivation sample (all 380
de-novo subjects) and both validation samples shows that all individuals with PD, regardless of quartile, were
(as expected) more likely to develop postural instability than controls – but quartile rank (and most specificallybioRxiv preprint first posted online May. 17, 2019; doi: http://dx.doi.org/10.1101/632638. The copyright holder for this preprint
(which was not peer-reviewed) is the author/funder, who has granted bioRxiv a license to display the preprint in perpetuity.
It is made available under a CC-BY-NC-ND 4.0 International license.
membership in quartile 4) was a substantial additional predictor. Table 4 shows Cox Proportional Hazard Ratio
for development of disability by eGDSS Quartile in the full sample (N=380), in the IPD validation set (N=79), and
in the GPD validation set (N=141). Kaplan Meier Survival Curves are shown in Figure 2 in the derivation sample
(Top), the IPD de-novo validation sample (Middle), and the GPD validation sample (Bottom). Quartile 4 (eGDSS
³ 11) is associated in both the derivation, and validation set with a highly significant increased likelihood of
developing HY stage ³ 3. The eGD phenotype will be most effective if it is a prognostic indicator for development
of postural instability. We therefore evaluate the temporal relationship of the paired relationship between
development of the eGD phenotype (eGDSS Score ³ 11) and development of postural instability (HY ³ 3) in both
the IPD and the GPD cohorts. Any instance of either eGDSS Score ³ 11, or HY ³ 3, was considered a potential
paired eGD-HY “event”, in the full sample of 380 individuals we therefore had 301 eGD “events” (79 individuals
had neither occurrence). In the IPD cohort, eGDSS Score ³ 11 occurred prior to HY ³ 3, or HY ³ 3 had not yet
occurred, in 289 of 301 pairings, and HY ³ 3 occurred before eGDSS ³ 11 (or eGDSS ³ 11 had not occurred at
time of end of follow up) in 12 cases; (Chi-Square Statistic = 510, p < 0.00000001). Median time from eGDSS
Score ³ 11 to HY ³ 3, in those who developed postural instability, was 983 days (1st Quartile 366, 4th Quartile
1522).
Relationship of eGDSS score to cognitive decline in PD (Table 5): As we observe eGDSS Quartile 4
substantially deviates from other quartiles in both derivation and validation analyses, we evaluated relationship
of membership in Quartile 4 and slope of cognitive change, compare eGDSS Quartile 4 to eGDSS Quartile 1.
Membership in Quartile 4 conferred a significant increased likelihood of cognitive progression, as measured by
the MOCA and HVLT, after correction for multiple comparisons. Rate of change in UPDRS in de-novo subjects
is not different in relation to eGDSS quartile, and rate of cognitive change does not differ significantly between
Quartiles 1, 2, and 3 (not shown). A repeat analysis including Quartiles 1-3 versus Quartile 4 resulted in similar
results to those shown in Table 5 (not shown).
Relationship of eGDSS score to Y5_PIGD (Table 6): While the eGDSS scale is keyed to disability as
measured by the HY scale, the relationship between eGDSS and development of the broader PIGD phenotype
is of interest. While age, gender, and UPDRS 1, 2, and 3 (5 factors) accounted for only 19.9% of variance in
predicting Y5-PIGD, the proposed eGDSS scale (3 factors) accounted for an adjusted 26.1% of variance (p =
0.018 – see table 6). In summary, eGDSS score at baseline explained more variance in Y5_PIGD than UPDRS,
and UPDRS did not add significantly to the eGDSS score with regards to explaining variance in Y5_PIGD.
Post-hoc analyses – capacity of baseline PIGD scale to predict Y5_PIGD and Y5_HY3-5. A pressing
question when developing a new metric is whether it improves on existing metrics. We therefore evaluated if
baseline PIGD provides relevant information to predict later HY status and PIGD scores. Baseline PIGD was a
poor predictor of Y5_PIGD in both the derivation (3 factors, adjusted R2 = 0.172) and de-novo validation set
(adjusted R2 = 0.169), and did not improve prediction of Y5_PIGD when added to the UPDRS (R2 = 0.254, similar
to UPDRS alone). In a 4 factor ANOVA model, baseline PIGD (F statistic = 0.011, Pr > F = 0.917), did not
improve prediction when added to the proposed eGDSS scale, and adjusted estimated accounted variance
(25.1%) declined due to addition of a factor. In a logistic model (prediction of Y5_HY3-5), adding PIGD to eGDSS
(4 factors, area under ROC curve = 0.784) did not improve prediction of the 3-factor model (Age, Gender, and
eGDSS alone, area under ROC curve = 0.784).
DISCUSSION
Specific clinical features, years prior to the onset of disabling gait dysfunction, predict development of
postural instability in PD. Based on our findings, we propose an emerging gait disorder phenotype (eGD) can
be detected at baseline, and that individuals who display features of this phenotype are at high risk of accelerated
development of both gait and cognitive dysfunction. We operationalize detection of the eGD phenotype using a
provisional emerging gait dysfunction phenotype screening scale (eGDSS). While more detailed studies to
develop ideal cutoff scores would be appropriate, at this stage and our data suggest that an eGDSS score ³ 11
is a reasonable criteria for identifying the phenotype. Individuals in this quartile had substantially increased risk
of developing disabling postural instability as measured by the HY rating scale, and showed accelerated
cognitive progression as measured by the MOCA and HVLT. The baseline eGDSS score also explained more
variance in PIGD score in year 5 than the UPDRS. The proposed eGD phenotype showed itself to be robust in
two separate validation sets: (1) a separate de-novo set of individuals with idiopathic PD and (2) a validation setbioRxiv preprint first posted online May. 17, 2019; doi: http://dx.doi.org/10.1101/632638. The copyright holder for this preprint
(which was not peer-reviewed) is the author/funder, who has granted bioRxiv a license to display the preprint in perpetuity.
It is made available under a CC-BY-NC-ND 4.0 International license.
of individuals with variable time of onset of symptoms with one of three known genetic causes of PD. Finally,
the proposed eGD phenotype occurs before development of postural instability as measured by the HY scale
(by a median of nearly 3 years), indicating the phenotype is potentially predictive of deterioration, rather than
simply an associated phenotype. The eGDSS scale has an acknowledged weakness in relying significantly on
patient self-reports, and we do not at this stage attempt to evaluate clear cut-off points for phenotypic
identification. This initial version of the eGDSS scale may therefore be useful in and of itself, but we consider it
most useful at this stage to provide guidance in developing an objective baseline evaluation to more clearly
define the phenotype.
The clinical features we identify in this work suggest some avenues for further research on understanding
the pathophysiology of the gait dysfunction in PD. Specifically, we find the following features appear to be
associated with more rapid progression of gait dysfunction: (1) lightheadedness on standing, (2) self-perceived
speech difficulties, (3) difficulties standing/rising, (4) postural changes, and (5) visible changes in the substantia
nigra, as well as changes in dopaminergic projects as measured by DATscan.29 A lesion in the substantia nigra
could be associated with some of these clinical findings, including changes in posture and postural reflexes, and
speech changes such as hypophonia, however our assessment does not clearly define the source of self-
perceived language deficits in this population, which could also be related to a lesion in the dorsal motor nucleus
of the vagus (one of the first regions impacted by lewy bodies in PD in Braak’s formulation),30-32 or might even
represent a cognitively-based symptom. Complaints of lightheadedness on standing suggests either a peripheral
or central (brainstem) lesion in noradrenergic and adrenergic neurons. The association of these apparently
diffusely distributed brainstem-related symptoms with more rapid cognitive deterioration suggests a more
aggressive disease process.
In summary, we show that risk for developing postural instability, and the PIGD phenotype, is detectable
at baseline clinically, based on symptoms and clinical findings (the eGD phenotype) that are distinct from those
that later characterize the PIGD phenotype. Identifying a sub-population at baseline at high risk of clinical
progression is important from the perspective of both understanding the pathophysiology of PD progression, and
for identifying individuals in which disease modifying agents can be evaluated. From a practical perspective, a
rapid clinical evaluation that can define future risk of disability is particularly useful. Heretofore, the Unified
Parkinson’s Disease Rating Scale (UPDRS) has been a primary focus and target in intervention studies.
However summary UPDRS metrics are primarily useful within subject for comparing the impact of medications
on symptoms and motor findings of disease, and are less useful for evaluating the impact of potential disease-
modifying therapies.6 We show here that for the majority of individuals in the first 5 years of observation in PPMI
(the first 6 years of diagnosed disease), changes in gait function under management are modest, but progressive
in a sub-population despite treatment. By formally identifying this eGD phenotype we identify a population group
destined to develop dopamine resistant symptoms that can targeted for early intervention studies.
Acknowledgement statement (including conflict of interest and funding sources): There are no conflicts
of interest associated with this publication. We would like to acknowledge the funding of the National Institutes
of Health through K23NS083620, and grant funding from the Michael J Fox Foundation in support of this
research. Data for this research was obtained from the Parkinson’s Progressive Markers Initiative.
Author Contributions: FMS, ED, and DS participated in study concept and design. FMS, WSM, CH, TA,
AG, LJ, AB, TD, and GC participated in data acquisition and analysis. FMS, ED, WSM, and CH participated in
drafting the manuscript and constructing figures.
Potential Conflicts of Interest: None.bioRxiv preprint first posted online May. 17, 2019; doi: http://dx.doi.org/10.1101/632638. The copyright holder for this preprint
(which was not peer-reviewed) is the author/funder, who has granted bioRxiv a license to display the preprint in perpetuity.
It is made available under a CC-BY-NC-ND 4.0 International license.
Figures:
Figure 1 Caption:
Individuals who had at least one rating of HY 3, on medication, within the first 5 years of PPMI follow up were
characterized by significantly more rapid progression of gait dysfunction as measured by the PIGD scale (red
circles) compared to individuals who maintained HY status of 2 or less during the first 5 years of treatment
(blue circles). Controls (green) are presented as a reference.bioRxiv preprint first posted online May. 17, 2019; doi: http://dx.doi.org/10.1101/632638. The copyright holder for this preprint
(which was not peer-reviewed) is the author/funder, who has granted bioRxiv a license to display the preprint in perpetuity.
It is made available under a CC-BY-NC-ND 4.0 International license.
Figure 2 Caption:
Properties of the eGDSS are shown in the full sample (Top) and in two validation sets. In both validation sets,
membership in eGDSS quartile 4 is a significant predictor of later development of postural instability (HY ³ 3)
compared to both controls, and membership in Quartile I.bioRxiv preprint first posted online May. 17, 2019; doi: http://dx.doi.org/10.1101/632638. The copyright holder for this preprint
(which was not peer-reviewed) is the author/funder, who has granted bioRxiv a license to display the preprint in perpetuity.
It is made available under a CC-BY-NC-ND 4.0 International license.
Tables and Table Legends:
Table 1: The Hoehn and Yahr Scale7,8
Stage Description
1 Unilateral involvement usually with
minimal or no functional disability
2 Bilateral or midline involvement
without impairment of balance
3 Bilateral disease: mild to moderate
disability with impaired postural
reflexes; physically independent
4 Severely disabling disease; still
able to walk or stand unassisted
5 Confinement to a bed or wheelchair
unless aided
Table 1 Legend:
The Hoehn and Yahr staging classification predates the more recently employed PIGD formulation
and remains in common use. Note: HY stages 3, 4, and 5 describe various degrees of postural
instability.bioRxiv preprint first posted online May. 17, 2019; doi: http://dx.doi.org/10.1101/632638. The copyright holder for this preprint
(which was not peer-reviewed) is the author/funder, who has granted bioRxiv a license to display the preprint in perpetuity.
It is made available under a CC-BY-NC-ND 4.0 International license.
Table 2: Demographics of Sample
Parkinson’s Disease Chi-square (LR)
Measure Controls Y5_HY0-2 Y5_HY3-5 (Y5_HY0-2 vs
Y5_HY3-5)
Demographics
Gender (M,F,Other) 127,62,10 187,73,17 66,33,4 NS
Age 62 (55,69) 61 (53,67) 67 (59,78)** p < 0.001**
Motor Examination
UPDRS I 2 (0,4) 3 (1,5)** 5 (3,8)**
UPDRS II 0 (0,0) 4 (2,6)** 7 (4,11)** p < 0.001**
UPDRS III 0 (0,2) 18 (13,24)** 22 (16,29)** p < 0.001**
UPDRS IV N/A N/A N/A p = 0.0029**
PIGD Score 0 (0,0) 2 (1,3)** 4 (2,7)** p < 0.001**
HY 0 (0,0) 1 (1,2)** 2 (1,2)** NS
Cognition
MOCA 28 (27,29) 28 (26,29)** 27 (25,29)** NS
HVLT Total Recall 26 (23,30) 26 (23,29) 24 (20,28)* NS
Delayed Recall 10 (8,11) 9 (8,11)* 8 (6,10)** NS
Letter Number Seq 11 (9,12) 11 (9,13) 10 (8,12) NS
Judgement of Line Orientation 14 (12,15) 14 (12,15) 13 (11,14)* p = 0.026*
Symbol Digit Modality 46 (39,53) 43 (37,49)** 37 (32,45)** p = 0.015*
Semantic Fluency 52 (46,58) 51 (45,57) 50 (43,57) NS
Letter Fluency (F) 14 (11,17) 13 (11,16)* 13 (11,16) NS
(Place Legend)
Table 2 Legend:
Raw scores are presented. All evaluations have been adjusted for age, gender, and multiple comparisons.
Differences between individuals who later develop progressive gait dysfunction (HY stage 3 or higher by 5 years
of follow up) and those who maintain stable gait function under management are reported on the far right.
Differences in each category from controls within PD columns is denoted by underline and italics.
* p < 0.05 (Adjusted) ** p < 0.005 (Adjusted)bioRxiv preprint first posted online May. 17, 2019; doi: http://dx.doi.org/10.1101/632638. The copyright holder for this preprint
(which was not peer-reviewed) is the author/funder, who has granted bioRxiv a license to display the preprint in perpetuity.
It is made available under a CC-BY-NC-ND 4.0 International license.
Table 3: Factors Associated with Progression to HY Stage 3 or Worse Within The First 5 Years of Disease
Item (UPDRS Section) PD Y5_HY0-2 PD Significance Multivariate
Median Y5_HY3-5 (Univariate) Logistical Weight
(1st Q/3rd Q) Median (Rounded Proposed
(1st Q/3rd Q) Multiple of Min) Weight
Present Absent
Lightheadedness on 0 (0,0) 0 (0,1) p = 0.0042 0.91 (4) 4 0
Standing (I)
Fatigue (I) 0 (0,1) 1 (0,1) p = 0.0060 0.21 (1) 1 0
Speech (II) 0 (0,0) 0 (0,1) p = 0.0023 0.85 (4) 4 0
Getting out of bed, car, 0 (0,1) 1 (0,1) p = 0.00173 0.21 (1) 1 0
or deep chair (II)
Walking and Balance (II) 0 (0,0.25) 1 (0,1) p = 0.00051 0.74 (4) 4 0
Arising from chair (III) 0 (0,0) 0 (0,1) p = 0.0055 1.22 (6) 6 0
Posture (III) 0 (0,1) 1 (0,1) p = 0.0059 0.46 (2) 2 0
(Place Legend)
Table 3 Legend:
After correction for multiple comparisons (53 items were compared), 7 baseline UPDRS items were associated
at p < 0.01 with Y5_HY3-5, and were used to develop an early gait dysfunction screening scale (eGDSS). Two
other items (difficulty turning in bed and adjusting clothes, from UPDRS section II, and pain and other
sensations from UPDRS I), were significant at p < 0.05 after multiple comparisons correction, but were not
included. Weights were derived from a logistical regression of items (present or absent) vs. status (PD
Y5_HY3-5 vs PD Y5_HY0-2).bioRxiv preprint first posted online May. 17, 2019; doi: http://dx.doi.org/10.1101/632638. The copyright holder for this preprint
(which was not peer-reviewed) is the author/funder, who has granted bioRxiv a license to display the preprint in perpetuity.
It is made available under a CC-BY-NC-ND 4.0 International license.
Table 4: Baseline eGDSS Quartile Ranking Predicts Likelihood of Advancing HY Status
eGDSS Number in Quartile Within Group Hazard z Pr (>|z|) Hazard Ratio (HR)
Quartile Quartile Value Ratio (HR) Compared Compared to
(Score, to PD Quartile I Controls
Baseline) (95% CI for HR) (95% CI for HR)
Controls 186 Median = 2 Control Sample
I 111 £2 Derivation Reference Group 5.3 (1.7-16.3)***
A: Derivation
II 85 3-6 2.03 (1.00-4.11) 1.97 0.049 10.7 (3.7-31.5)****
(N=380)
Sample
III 78 7-10 3.34 (1.71-6.54)*** 3.52 0.00043 17.7 (6.2-51.0)****
IV 76 ³ 11 8.28 (4.48-15.29)**** 6.75 < 0.00001 44.1 (15.9-122.2)****
I (Ref) 86 Derivation Sample De-Novo Quartile I Reference Group
Sample (N=79)
(Modified)
I 25 £2 1.90 (0.51-7.02) 0.96 0.34 9.7 (1.9-48.4)**
B: IPD
II 18 3-6 2.52 (0.68-9.29) 1.38 0.17 12.7 (2.6-63.6)***
III 21 7-10 2.53 (0.68-9.47) 1.38 0.17 13.2 (2.6-67.3) ***
IV 14 ³ 11 16.18 (6.34-41.23)**** 5.83 < 0.00001 88.0 (23.2-333.5)****
I (Ref) 111 Derivation Sample De-Novo Quartile I Reference Group 5.3 (1.7-16.3)***
I 20 £2 2.81 (0.56-14.06) 1.26 0.21 21.6 (2.5-185.3)***
(N=141)
C: GPD
Sample
II 29 3-6 0.94 (0.11-7.87) -0.056 0.96 7.4 (0.6-95.1)
III 43 7-10 3.84 (1.15-12.83) 2.19 0.029 28.5 (4.7-174.1)***
IV 60 ³ 11 13.26 (5.13-34.28)**** 5.34 < 0.00001 103.2 (18.7-569.9)****
(Place Legend)
Table 4 Legend:
Progression to HY ³ 3, by quartile, compared to healthy controls (right-most columns) and compared to Quartile I.
Reference Quartile I values in all cases are taken from the de-novo sample. A: Significant, and progressive impact of
quartile on risk development of HY ³ 3 is noted in the de-novo PD derivation sample. B: In the IPD validation sample,
eGDSS scores in the fourth quartile (³ 11) are associated with a significantly higher likelihood of progression to HY ³ 3.
C: In the GPD cohort, once again membership in Quartile 4 confers a higher risk of progression to HY ³ 3 compared to
de-novo subjects with eGDSS scores £ 2.
** p £ 0.01 *** p £ 0.005 **** p £ 0.0001bioRxiv preprint first posted online May. 17, 2019; doi: http://dx.doi.org/10.1101/632638. The copyright holder for this preprint
(which was not peer-reviewed) is the author/funder, who has granted bioRxiv a license to display the preprint in perpetuity.
It is made available under a CC-BY-NC-ND 4.0 International license.
Table 5: Change in Motor, Neurobehavioral, and Cognitive Function in Sample
Controls Parkinson’s Disease
Measure N=76 N=111
N=185 eGDSS Quartile 4 eGDSS Quartile 1 Chi-square (LR)
(Mean +/- 95CI) (Mean +/- 95CI) (Mean +/- 95CI) (eGDSS Q1 vs Q4)
Motor Examination
UPDRS I 0.10 ± 0.10 0.61 ± 0.22*** 0.74 ± 0.12*** 0.120
UPDRS II 0.049 ± 0.044 1.44 ± 0.34*** 1.09 ± 0.22*** 0.419
UPDRS III -2.0 ± 0.85 1.34 ± 0.72*** 0.92 ± 0.43*** 0.637
Cognition
MOCA 0.02 ± 0.12 -0.70 ± 0.23*** -0.19 ± 0.12*** 0.002**
HVLT Total Recall 0.12 ± 0.16 -0.63 ± 0.25*** 0.12 ± 0.28 0.008**
Letter-Number Sequencing 0.01 ± 0.11 -0.22 ± 0.18*** 0.07 ± 0.11 0.145
Judgement of Line Orientation 0.01 ± 0.09 -0.25 ± 0.14*** -0.01 ± 0.12 0.193
Symbol Digit Modality 0.34 ± 0.43 -1.91 ± 0.64*** -0.59 ± 0.59*** 0.092
Semantic Fluency -0.05 ± 0.51 -1.33 ± 0.65*** -0.21 ± 0.67* 0.157
(Place Legend)
Table 5 Legend:
Slope (mean point change per year), with 95% confidence intervals, for motor and cognitive scores in PPMI for all de-novo
subjects with at least 5 years of data available. Significance is adjusted for age and gender; for cognitive measures
significance of 0.00833 (0.05/6) is to achieve statistical threshold.
* p < 0.05 ** p < 0.00833 *** p < 0.0001bioRxiv preprint first posted online May. 17, 2019; doi: http://dx.doi.org/10.1101/632638. The copyright holder for this preprint
(which was not peer-reviewed) is the author/funder, who has granted bioRxiv a license to display the preprint in perpetuity.
It is made available under a CC-BY-NC-ND 4.0 International license.
Table 6: Relative Relationship eGD Phenotype to PIGD Phenotype
SOURCE F Pr > F SOURCE F Pr > F
AGE 8.282 0.005 eGDSS 15.999bioRxiv preprint first posted online May. 17, 2019; doi: http://dx.doi.org/10.1101/632638. The copyright holder for this preprint
(which was not peer-reviewed) is the author/funder, who has granted bioRxiv a license to display the preprint in perpetuity.
It is made available under a CC-BY-NC-ND 4.0 International license.
End Notes
1
Blauwendraat C, Bandrés-Ciga S, Singleton AB. Predicting progression in patients with Parkinson's
disease. Lancet Neurol. 2017;16(11):860-862.
2
Erro R, Vitale C, Amboni M, Picillo M, Moccia M, et al. (2013) The Heterogeneity of Early Parkinson’s
Disease: A Cluster Analysis on Newly Diagnosed Untreated Patients. PLOS ONE 8(8):
e70244. https://doi.org/10.1371/journal.pone.0070244
3
Greenland JC, Williams-Gray CH, Barker RA.The clinical heterogeneity of Parkinson's disease and its
therapeutic implications. Eur J Neurosci. 2018 Jul 30. doi: 10.1111/ejn.14094.
4
Sato K, Hatano T, Yamashiro K, Kagohashi M, Nishioka K, Izawa N, Mochizuki H, Hattori N, Mori H, Mizuno
Y; Juntendo Parkinson Study Group. Prognosis of Parkinson's disease: time to stage III, IV, V, and to motor
fluctuations. Mov Disord. 2006 Sep;21(9):1384-95.
5
Birkmayer W, Riederer P, Youdim BH. Distinction between benign and malignant type of Parkinson's disease.
Clin Neurol Neurosurg. 1979;81(3):158-64.
6
Espay AJ, Schwarzschild MA, Tanner CM, et al. Biomarker-driven phenotyping in Parkinson's disease: A
translational missing link in disease-modifying clinical trials. Mov Disord. 2017;32(3):319-324.
7
Hoehn M, Yahr M. Parkinsonism: onset, progression and mortality. Neurology1967; 17 (5): 427–442.
doi:10.1212/wnl.17.5.427. PMID 6067254.
8
Goetz CG, Poewe W, Rascol O, Sampaio C, Stebbins GT, Counsell C, Giladi N, Holloway RG, Moore
CG, Wenning GK, Yahr MD, Seidl L; Movement DisorderSociety Task Force on Rating Scales for Parkinson's
Disease. Movement Disorder Society Task Force report on the Hoehn and Yahr staging scale: status and
recommendations. Mov Disord. 2004 Sep;19(9):1020-8.
9
Jankovic J, McDermott M, Carter J, et al; Parkinson Study Group. Variable expression of Parkinson’s
disease: a base-line analysis of the DATATOP cohort. Neurology. 1990;40(10):1529-1534.
10
Stebbins GT, Goetz CG, Burn DJ, Jankovic J, Khoo TK, Tilley BC. How to identify tremor dominant and
postural instability/gait difficulty groups with the movement disorder society unified Parkinson's disease rating
scale: comparison with the unified Parkinson's disease rating scale. Mov Disord. 2013 May;28(5):668-70. doi:
10.1002/mds.25383.
11
Simuni T, Caspell-Garcia C, Coffey C, Lasch S, Tanner C, Marek K; PPMI Investigators. How stable are
Parkinson’s disease subtypes in de novo patients: Analysis of the PPMI cohort? Parkinsonism Relat
Disord. 2016 Jul;28:62-7. doi: 10.1016/j.parkreldis.2016.04.027.
12
Fahn S, Elton RL, the UPDRS Development Committee. Unified Parkinson’s Disease Rating Scale. In: Fahn S,
Marsden CD, Calne D, Goldstein M, eds. Recent Developments in Parkinson’s Disease, vol2. Florham Park, NJ:
Macmillan Healthcare Information, 1987:153-163.
13
Goetz C G, Tilley BC, Shaftman SR, Stebbins GT, Fahn S, Martinez-Martin P, Poewe W, Sampaio C, Stern MB, Dodel
R, Dubois B, Holloway R, Jankovic J, Kulisevsky J, Lang AE, Lees A, Leurgans S, LeWitt PA, Nyenhuis D, Olanow
CW, Rascol O, Schrag A, Teresi JA, van Hilten JJ and LaPelle N. Movement Disorder Society-sponsored revision of the
Unified Parkinson's Disease Rating Scale (MDS-UPDRS): Scale presentation and clinimetric testing results. Mov Disord
2008; 23: 2129–2170. doi:10.1002/mds.22340
14
Huang X, Ng SY, Chia NS, Setiawan F, Tay KY, Au WL, Tan EK, Tan LC. Non-motor symptoms in early
Parkinson's disease with different motor subtypes and their associations with quality of life. Eur J Neurol. 2018
Sep 3. doi: 10.1111/ene.13803.
15
Wu Y, Guo XY, Wei QQ, Ou RW, Song W, Cao B, Zhao B, Shang HF. Non-motor symptoms and quality of
life in tremor dominant vs postural instability gait disorder Parkinson's disease patients. Acta Neurol
Scand. 2016 May;133(5):330-7. doi: 10.1111/ane.12461.
16
Post B, Merkus MP, de Haan RJ, Speelman JD; CARPA Study Group. Prognostic factors for the progression
of Parkinson's disease: a systematic review. Mov Disord. 2007 Oct 15;22(13):1839-51.
17
Burn DJ, Rowan EN, Allan LM, Molloy S, O'Brien JT, McKeith IG. Motor subtype and cognitive decline in
Parkinson's disease, Parkinson's disease with dementia, and dementia with Lewy bodies. J Neurol Neurosurg
Psychiatry. 2006;77(5):585-9.
18
Alves G, Larsen JP, Emre M, Wentzel-Larsen T, Aarsland D. Changes in motor subtype and risk for
incident dementia in Parkinson's disease. Mov Disord. 2006 Aug;21(8):1123-30.
19
Arie L, Herman T, Shema-Shiratzky S, Giladi N, Hausdorff JM. Do cognition and other non-motor symptoms
decline similarly among patients with Parkinson's disease motor subtypes? Findings from a 5-year prospective
study. J Neurol. 2017 Oct;264(10):2149-2157. doi: 10.1007/s00415-017-8605-x.bioRxiv preprint first posted online May. 17, 2019; doi: http://dx.doi.org/10.1101/632638. The copyright holder for this preprint
(which was not peer-reviewed) is the author/funder, who has granted bioRxiv a license to display the preprint in perpetuity.
It is made available under a CC-BY-NC-ND 4.0 International license.
20
Burn DJ, Rowan EN, Allan LM, Molloy S, O'Brien JT, McKeith IG. Motor subtype and cognitive decline in
Parkinson's disease, Parkinson's disease with dementia, and dementia with Lewy bodies. J Neurol Neurosurg
Psychiatry. 2006;77(5):585-9.
21
Meireles J, Massano J. Cognitive impairment and dementia in Parkinson's disease: clinical features,
diagnosis, and management. Front Neurol. 2012;3:88. Published 2012 May 25. doi:10.3389/fneur.2012.00088
22
Siciliano M, De Micco R, Trojano L, De Stefano M, Baiano C, Passaniti C, De Mase A, Russo A, Tedeschi
G, Tessitore A. Cognitive impairment is associated with Hoehn and Yahr stages in early, de novo Parkinson
disease patients. Parkinsonism Relat Disord. 2017 Aug;41:86-91. doi: 10.1016/j.parkreldis.2017.05.020. Epub
2017 May 25.
23
Goetz CG, Poewe W, Rascol O, Sampaio C, Stebbins GT, Counsell C, Giladi N, Holloway RG, Moore
CG, Wenning GK, Yahr MD, Seidl L; Movement Disorder Society Task Force on Rating Scales for Parkinson's
Disease. Movement Disorder Society Task Force report on the Hoehn and Yahr staging scale: status and
recommendations. Mov Disord. 2004 Sep;19(9):1020-8.
24
Stebbins GT, Goetz CG, Burn DJ, Jankovic J, Khoo TK, Tilley BC. How to identify tremor dominant and
postural instability/gait difficulty groups with the movement disorder society unified Parkinson's disease rating
scale: comparison with the unified Parkinson's disease rating scale. Mov Disord. 2013 May;28(5):668-70. doi:
10.1002/mds.25383.
25
Simuni T, Caspell-Garcia C, Coffey C, Lasch S, Tanner C, Marek K; PPMI Investigators.
How stable are Parkinson's disease subtypes in de novo patients: Analysis of the PPMI cohort? Parkinsonism
Relat Disord. 2016 Jul;28:62-7. doi: 10.1016/j.parkreldis.2016.04.027.
26
Clarke CE. A "cure" for Parkinson's disease: can neuroprotection be proven with current trial designs? Mov
Disord. 2004 May;19(5):491-8.
27
McGhee DJ, Ritchie CW, Zajicek JP, Counsell CE. A review of clinical trial designs used to detect a disease-
modifying effect of drug therapy in Alzheimer's disease and Parkinson's disease. BMC Neurol. 2016 Jun
16;16:92. doi: 10.1186/s12883-016-0606-3.
28
Parkinson Progression Marker Initiative. The Parkinson Progression Marker Initiative (PPMI). Prog
Neurobiol. 2011;95(4):629-35. doi: 10.1016/j.pneurobio.2011.09.005. See also www.ppmi-info.org
29
Submitted manuscript in review.
30
Braak H, Rüb U, Gai WP, Del Tredici K. Idiopathic Parkinson's disease: possible routes by which vulnerable
neuronal types may be subject to neuroinvasion by an unknown pathogen. J Neural Transm (Vienna). 2003
May;110(5):517-36.
31
Braak H, Del Tredici K, Bratzke H, Hamm-Clement J, Sandmann-Keil D, Rüb U. Staging of the intracerebral
inclusion body pathology associated with idiopathicParkinson's disease (preclinical and clinical stages). J
Neurol. 2002 Oct;249 Suppl 3:III/1-5.
32
Braak H, Ghebremedhin E, Rüb U, Bratzke H, Del Tredici K. Stages in the development of Parkinson’s
disease-related pathology. Cell Tissue Res. 2004 Oct;318(1):121-34. Epub 2004 Aug 24.You can also read