Automated Oxygen Gradient Ektacytometry: A Novel Biomarker in Sickle Cell Anemia - Frontiers
←
→
Page content transcription
If your browser does not render page correctly, please read the page content below
METHODS
                                                                                                                                                    published: 25 March 2021
                                                                                                                                            doi: 10.3389/fphys.2021.636609

                                                Automated Oxygen Gradient
                                                Ektacytometry: A Novel Biomarker in
                                                Sickle Cell Anemia
                                                Alina Sadaf 1, Katie G. Seu 1,2, Elizabeth Thaman 1,2, Rose Fessler 1,2,
                                                Diamantis G. Konstantinidis 1,2, Holly A. Bonar 1,3, Jennifer Korpik 1,4, Russell E. Ware 1,2,5,
                                                Patrick T. McGann 1,2,5, Charles T. Quinn 1,2,4,5 and Theodosia A. Kalfa 1,2,4,5*
                                                1
                                                 Cancer and Blood Diseases Institute, Cincinnati Children’s Hospital Medical Center, Cincinnati, OH, United States,
                                                2
                                                 Division of Hematology, Cincinnati Children’s Hospital Medical Center, Cincinnati, OH, United States, 3 Immunopathology
                                                Laboratory, Cincinnati Children’s Hospital Medical Center, Cincinnati, OH, United States, 4 Erythrocyte Diagnostic Laboratory,
                                                Cincinnati Children’s Hospital Medical Center, Cincinnati, OH, United States, 5 Department of Pediatrics, College of Medicine,
                                                University of Cincinnati, Cincinnati, OH, United States

                                                Sickle cell anemia (SCA) is a hereditary hemoglobinopathy with a variable phenotype.
                                                There is no single biomarker that adequately predicts disease severity and can be used
                                                to monitor treatment response in patients in clinical trials and clinical care. The use of
                            Edited by:          clinical outcomes, such as vaso-occlusive crises (VOC), requires long and expensive
                    Richard Van Wijk,
       Utrecht University, Netherlands          studies, sometimes with inconclusive results. To address these limitations, there are several
                         Reviewed by:           biomarkers under study to improve the ability to predict complications and assess
                     Wassim El Nemer,           treatment response in both clinical and research settings. Oxygen gradient ektacytometry,
  Institut National de la Santé et de la
       Recherche Médicale (INSERM),
                                                also called as oxygenscan, is an assay that measures the effects of deoxygenation and
                                France          reoxygenation on red blood cell (RBC) deformability and is gaining popularity in SCA
                          Ozlem Yalcin,         research, because it captures the dynamic sickling capacity of a patient’s RBCs as they
                 Koç University, Turkey
                                                are subjected to an oxygen gradient under steady shear stress. We describe here the
                *Correspondence:
                  Theodosia A. Kalfa            oxygenscan methodology and evaluate the correlation between oxygenscan parameters
          theodosia.kalfa@cchmc.org             and more well-known biomarkers of SCA such as fetal hemoglobin (HbF), F-cells, and
                                                dense red blood cells (DRBCs). Our data indicate that the oxygenscan curve is affected
                   Specialty section:
         This article was submitted to          by all these parameters and the result incorporates the effects of %HbF, %F-cells, RBC
          Red Blood Cell Physiology,            hydration, and RBC membrane deformability.
               a section of the journal
               Frontiers in Physiology          Keywords: sickle cell anemia, erythrocyte, oxygen gradient ektacytometry, oxygenscan, fetal hemoglobin, F-cell,
       Received: 01 December 2020               dense red blood cells, red blood cell
          Accepted: 05 March 2021
         Published: 25 March 2021

                             Citation:          INTRODUCTION
         Sadaf A, Seu KG, Thaman E,
         Fessler R, Konstantinidis DG,          Sickle cell disease (SCD) is an umbrella term for a group of inherited hemoglobinopathies.
        Bonar HA, Korpik J, Ware RE,            A single nucleotide mutation in the HBB gene, which encodes the β-globin chain of
           McGann PT, Quinn CT and
                                                hemoglobin, results in the sickle hemoglobin allele βS. Sickle cell anemia (SCA) is used to
  Kalfa TA (2021) Automated Oxygen
    Gradient Ektacytometry: A Novel
                                                describe sickle cell disease caused by homozygosity for βS (SS) or compound heterozygosity
     Biomarker in Sickle Cell Anemia.           for βS and a β0-thalassemia mutation (Sβ0). HbS polymerizes upon deoxygenation causing
           Front. Physiol. 12:636609.           the red blood cell (RBC) to acquire a “sickle” shape (Steinberg and Rodgers, 2001). Sickle
   doi: 10.3389/fphys.2021.636609               RBCs are markedly less deformable than normal RBCs (Clark et al., 1980), have an increased

Frontiers in Physiology | www.frontiersin.org                                           1                                             March 2021 | Volume 12 | Article 636609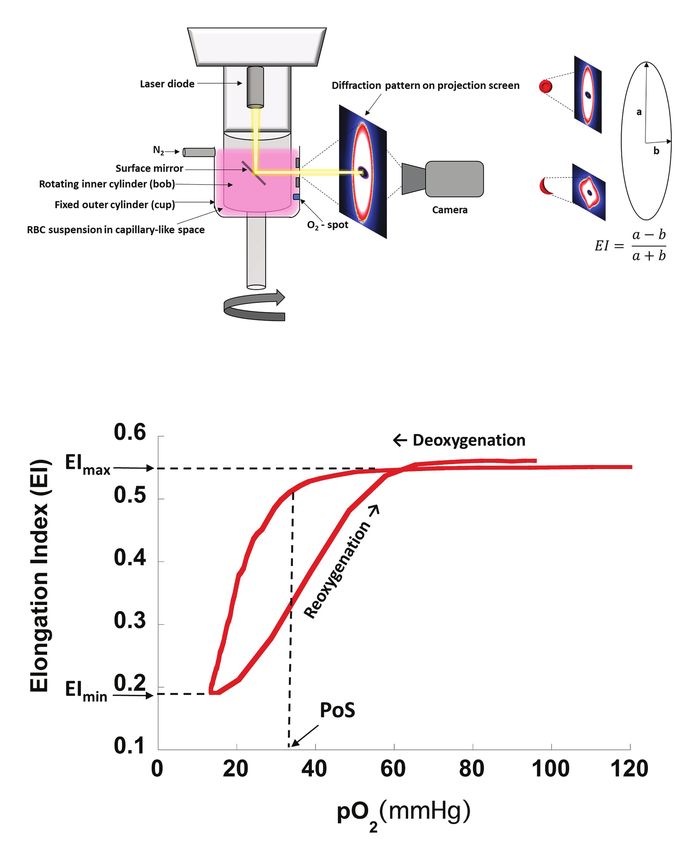
Sadaf et al.                                                                                                     Oxygenscan in Sickle Cell Anemia

transit time in the microcirculation of tissues (Vargas and              with HbF content of 20–25% can survive up to three times
Blackshear, 1982; Du et al., 2015), and demonstrate increased            longer than RBCs that do not have HbF (Franco et al.,
adherence to the vascular endothelium (Mohandas and Evans,               1998). Although low HbF levels have been correlated with
1984, 1985; Papageorgiou et al., 2018). These processes                  increased mortality in SCA (Leikin et al., 1989), the wide
contribute to the major complications of SCD including                   variability of F-cells genetically and in response to HbF-inducing
vaso-occlusive crises (VOC) and chronic organ damage.                    medications, may limit the ability of each one of these
However, there is wide phenotypic variability in SCD even                biomarkers to estimate severity of SCA (Steinberg, 2005;
between patients with the same genotype (Quinn, 2016);                   Steinberg et al., 2014; Quinn, 2016).
therefore, there is a need to develop biomarkers that can                    DRBCs, another biomarker in SCA, are defined as RBCs
reliably identify the risk of complications and assess treatment         with density >1.11 g/ml (Fabry and Nagel, 1982) as measured
response (Hoots and Shurin, 2012).                                       by density-gradient fractionation methods, or percentage of
   Ektacytometry is a technique for measuring RBC deformability          RBCs with a measured mean corpuscular hemoglobin
that is used for the diagnosis of RBC cytoskeleton and hydration         concentration (MCHC) >41 g/dl (Clark et al., 1980). In adults
disorders such as hereditary spherocytosis and xerocytosis               with SCA, %DRBCs have been associated with increased
(Bessis et al., 1980; Da Costa et al., 2016; Risinger and Kalfa,         frequency of leg ulcers, priapism, and renal dysfunction, and
2020). In this technique, RBCs suspended in a liquid of known            their decline with hydroxyurea therapy was shown to
viscosity are subjected to increasing shear stress, or in the            be independent of the effect of hydroxyurea on HbF levels
case of osmotic gradient ektacytometry (osmoscan), RBCs are              (Bartolucci et al., 2012).
suspended in a medium of varying osmolality and subjected                    The oxygenscan curve is a novel laboratory assay that directly
to a steady shear stress. RBCs scatter light from a laser beam           measures the sickling propensity of an entire RBC population
directed at the suspension, generating a diffraction pattern             when challenged with deoxygenation and reoxygenation. Here,
that can be analyzed to quantify RBC deformability. Under                we describe its use as a reproducible functional biomarker,
conditions of normal oxygen saturation (normoxia), RBC                   demonstrate and discuss the correlation of main oxygenscan
deformability in SCA is decreased due to the altered cytoskeleton        parameters with %HbF levels, %F-cells, and %DRBCs, and
mechanics of irreversibly sickled cells (ISCs), while the osmotic        illustrate results from patients with SCD (all with SS genotype
fragility is decreased due to increased surface-to-volume ratio          except one).
of the dense or dehydrated cells (Clark et al., 1980). Because
the percentage of ISCs and dense cells varies between steady
state and during VOC, RBC osmoscan also varies in patients               MATERIALS AND METHODS
over time (Clark et al., 1983; Ballas et al., 1988; Lande et al.,
1988; Ballas and Smith, 1992; Lemonne et al., 2013; Parrow               All procedures were approved by the Institutional Review Board
et al., 2017). As sickling is caused by deoxygenation, the study         (IRB) at the Cincinnati Children’s Hospital Medical Center
of RBC deformability under varying oxygen saturation is                  and were in accordance with the Declaration of Helsinki. IRB
promising to be of physiologic relevance. Oxygen gradient                numbers of the studies that provided samples are 2018-0759
ektacytometry, referred to as the oxygenscan, is a next-generation       and 2018-5,182.
functional assay that measures RBC deformability through an
automated cycle of deoxygenation and reoxygenation,                      Oxygen Gradient Ektacytometry
demonstrating characteristic features of sickle RBCs (Rab et al.,        General Principles
2019a). As use of the oxygenscan is increasing in sickle cell            The Laser Optical Rotational Red Cell Analyzer (Lorrca®,
research, there is a need for standardization of methodology,            RR Mechatronics, Zwaag, The Netherlands) oxygenscan
clinical validation, and correlation with known SCA biomarkers           measures RBC deformability in terms of the elongation index
such as fetal hemoglobin (HbF) and dense red blood cells                 (EI), which is based on the height and width of an elliptical
(DRBCs; Rab et al., 2019b, 2020a).                                       diffraction pattern (Figures 1A,B). A standardized number
   One of the main drivers of polymerization is the intracellular        of RBCs is suspended in a liquid medium of known viscosity,
HbS concentration in RBCs (Noguchi et al., 1983). Cellular               as detailed below, and exposed to constant shear stress of
dehydration mediated by cell membrane cation channels                    30 Pa. The RBC suspension is subjected to one cycle of
may increase HbS concentration (Brugnara, 2003). Other                   deoxygenation (1,300 s) through the slow introduction of
factors, such as membrane damage due to oxidation (Aslan                 nitrogen gas followed by rapid reoxygenation (280 s) via
et al., 2000) and phosphorylation changes (Noomuna et al.,               passive diffusion of ambient air. EI is plotted on a curve
2020), also affect deformability and accelerate RBC lysis.               against the partial pressure of oxygen (pO2; Figure 1C). EImax
HbF is known to inhibit deoxygenation-induced HbS                        is the maximum EI measured at full oxygenation (pO2
polymerization (Poillon et al., 1993) and improve RBC                    100–150 mmHg) and represents baseline RBC deformability
deformability likely by improving membrane mechanics and                 in arterial circulation. EImin is the minimum EI measured at
decreasing the number of ISCs (Parrow et al., 2017). However,            the lowest oxygen saturation (pO2 < 20 mmHg) and represents
because HbF is typically unevenly distributed across the                 RBC deformability in post capillary venules. The Point of
population of sickle RBCs, HbF levels do not accurately                  Sickling (PoS) is the pO2 at which the EImax decreases by
capture phenotype variability. A fraction of the RBC population          5% as deoxygenation proceeds. The PoS represents the

Frontiers in Physiology | www.frontiersin.org                        2                                     March 2021 | Volume 12 | Article 636609

Sadaf et al.                                                                                                                               Oxygenscan in Sickle Cell Anemia

                          A                                                                                              B

                          C

  FIGURE 1 | Schematic drawing of oxygenscan setup with representative curve. (A) Schematic drawing of oxygenscan. (B) Representative diffraction pattern of
  RBCs in suspension. With deoxygenation and shear stress (30 Pa) in the capillary-like space between the cup and bob, RBCs containing HbS tend to deform to
  sickled shapes causing the diffraction pattern to change from an elliptical to a rhomboid pattern. Elongation index (EI) is calculated as a ratio of radii along the long
  and short axis of the diffraction pattern. (C) Representative oxygenscan curve of HbS RBCs. Maximum elongation index, EImax, is the EI measured at full oxygenation
  (pO2 100–150 mmHg) and represents baseline RBC deformability in arterial circulation. Minimum elongation index, EImin, is the EI measured at the lowest oxygen
  saturation (pO2 < 20 mmHg) and represents RBC deformability in post capillary venules. Point of sickling, PoS, is the pO2 at which the EI decreases to 95% of EImax
  during deoxygenation and represents a patient/disease-status-specific pO2 at which HbS polymerization is accelerated and drives the sickling of RBCs that were
  deformable at normoxia. “Recovery,” i.e., the percentage of EImax reached after reoxygenation (Rab et al., 2019b), may be >100% for certain patients, reaching an
  EImax value that is higher than the EImax prior to deoxygenation. This is likely related to lysis of less deformable RBCs during the assay, which results in an overall
  increase in deformability of the RBC population.

patient-specific pO2, where HbS polymerization is accelerated                            Sample Collection, Storage, and Processing
and drives the sickling of RBCs that are deformable at normoxia                          Peripheral blood samples (at least 1 ml) from patients with SCD
(Rab et al., 2019a). Recovery is calculated as the percentage                            were obtained by venipuncture and collected in EDTA tubes.
of EImax reached during reoxygenation and represents the                                 Samples were stored at 4°C overnight, for at least 16 h and at
capacity to reverse sickling with reoxygenation.                                         most 32 h, prior to analysis. Twenty-six percent of the samples

Frontiers in Physiology | www.frontiersin.org                                        3                                              March 2021 | Volume 12 | Article 636609
Sadaf et al. Oxygenscan in Sickle Cell Anemia
were processed within 24 h of sample collection. Samples obtained TABLE 1 | Characteristics of patients evaluated by oxygen-gradient
ektacytometry.
at an outside institution were shipped overnight at 4°C. Care was
taken to process samples immediately after removal from 4°C storage. Mean ± SD (range)
Prior to analysis, the EDTA tube was gently inverted to
allow mixing of plasma with cellular components. RBC count Age range (years) 6 months to 48 years
of the sample was determined using the ADVIA® 2120i HbSS, n (%) 37 (97%)
HbSβ+-Thalassemia, n (%) 1 (3%)
hematology analyzer (Siemens, Munich, Germany). Next, the
HbF (%) 23 ± 11.5 [5.6–50.6]
volume of whole blood that would yield 200 × 106 RBCs per F-cells (%) 67.7 ± 23.1 [24–99.2]
sample was determined using the following formula. Hb (g/dl) 9 ± 1.2 [6.9–11.4]
RBC (×106/μl) 3.2 ± 0.7 [1.7–4.5]
RBC count of sample
DRBCs (%) 1.2 ± 1.5 [0–4.8]
Volume of sample ( m L) = 200 /
( )
x 10 cells / m L
6
were transfusion free for at least 3 months prior to testing. The
pediatric cohort of 27 patients, aged from 6 months to 16 years,
Sample volume was then added to 5 ml of polyvinylpyrrolidone were not on hydroxyurea. The 11 adult patients were on hydroxyurea
(PVP) buffer, Iso Oxy (osmolarity 282–286 mOsm/kg, pH therapy with variable compliance. Linear correlation graphs of
7.35–7.45) with known viscosity of approximately 28 Pa·s. The %HbF, %F-cells, and %DRBCs with EImax, EImin, and PoS are
RBC suspension was gently inverted to allow homogenization. shown in Figure 2 and results are summarized in Table 2.
Using a syringe, the sample was drawn up and air bubbles EImax demonstrated a positive linear correlation with %HbF
were removed before injection into the machine for analysis. (r = 0.6675) and %F-cells (r = 0.6494), and a strong negative
Temperature of the bob (internal cylinder of the Lorrca® linear correlation with %DRBCs (r = −0.8152; Figures 2A–C).
oxygenscan) was fixed at 37°C. Camera gain was adjusted to Of note, samples with no DRBC had an EImax that approached
capture the entire diffraction pattern (Figures 1A,B). 0.6, which is the maximum EI of normal RBCs. When %HbF
was more than 20% and %F-cells were more than 70%, the
Fetal Hemoglobin EImax approached the normal maximum value (approximately
HbF levels were quantified using capillary zone electrophoresis 0.6), while at lower percentage of F-cells and HbF, a variable
(Sebia Capillarys 2 Flex Piercing System®, Lisses, France). F-cell decrease of EImax was observed.
analysis was performed using an adaptation of a previously described EImin showed a positive linear correlation with increasing
method using multiparametric flow cytometry (Davis and Davis, %HbF levels (r = 0.6310) and %F-cells (r = 0.5855) and a
2004). Whole blood samples were fixed, permeabilized, and labeled negative correlation with %DRBCs (r = −0.6988; Figures 2D–F).
with antibodies to HbF (Invitrogen, Waltham, MA, United States) As expected, PoS had a negative correlation with %HbF
and CD235a (Glycophorin A, BD Biosciences, San Jose, CA, (r = −0.5596), %F-cells (r = −0.5309), and a positive correlation
United States). Flow cytometric analysis was performed using the with %DRBCs (r = 0.7029; Figures 2G–I). Absent DRBCs
BD FACSLyric Clinical System (BD Biosciences). Patient samples were not always good predictors for a consistently high EImin
were accompanied by two separate control samples: a healthy or consistently low PoS. It appeared that very high values of
adult and a manufactured high HbF control. F-cell population %HbF (>30%) and %F-cells (>80%) were required for a reliable
was quantified as percentage of the total RBCs. decline in the PoS to less than 25 mmHg.
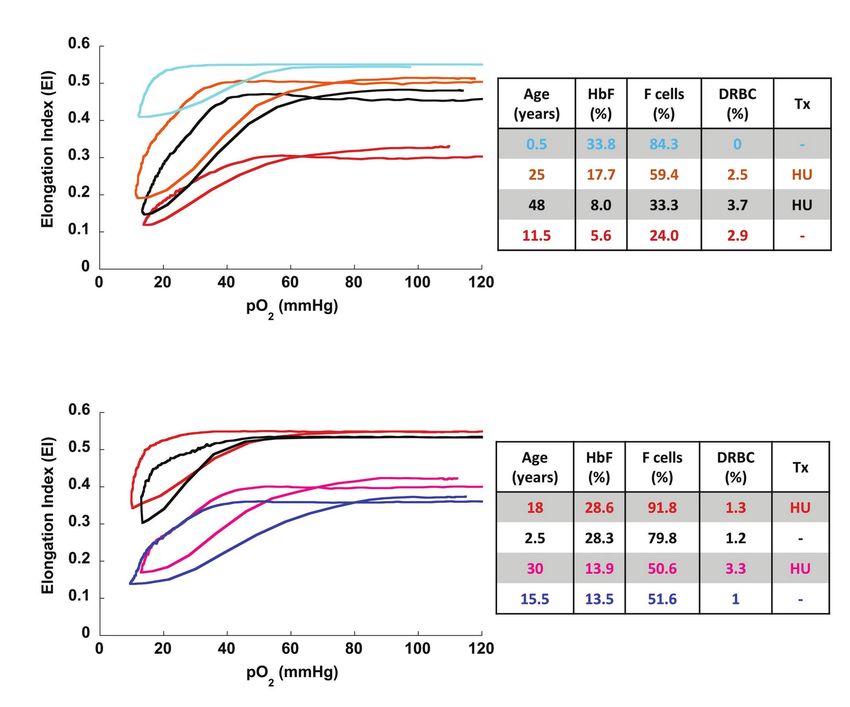
Overall, the oxygenscan profile was influenced by the
combination of these classically recognized biomarkers of SCA
Dense Red Blood Cells rather than having a strong association with a single biomarker.
%DRBCs were measured using an automated analyzer (ADVIA Figure 3A illustrates representative oxygen gradient
2120i system), which quantifies %DRBCs by estimating the ektacytometry curves from four patients with SCA with varying
percentage of RBCs with a measured MCHC >41 g/dl. %HbF, %F-cells, and %DRBCs. A combined increase in %HbF
and %F-cells and associated decrease of %DRBCs is necessary
Statistical Analysis to cause an upward shift of the oxygenscan curve resulting
Data from the oxygenscan were exported into R (v i386 4.0.2) in increased RBC deformability, and a lower PoS, indicating
to generate curves and determine EImin, EImax, and PoS. Linear an increased capacity to tolerate deoxygenation before sickling
correlations between %HbF, %F-cells, and %DRBCs with is initiated. In contrast, low %HbF and low %F-cells with
oxygenscan parameters were also obtained in R. Oxygenscan increased %DRBCs result in lower EImin and EImax, indicating
profiles were created for individual SCD patients for illustrative a decrease in RBC deformability, as well as a higher PoS,
results using KaleidaGraph® v 4.1 (Synergy Software). signifying decreased ability to tolerate deoxygenation with
sickling initiated at an oxygen pressure that can occur in
arterioles in normal physiology.
RESULTS To illustrate the effect of hydroxyurea on the oxygenscan
profile, we identified two pairs of patients with similar fetal
Characteristics of the 38 patients with SCD whose samples were hemoglobin values with and without hydroxyurea treatment
tested in this study are summarized in Table 1. All patients (Figure 3B). Hydroxyurea appeared to have beneficial effects
Frontiers in Physiology | www.frontiersin.org 4 March 2021 | Volume 12 | Article 636609Sadaf et al. Oxygenscan in Sickle Cell Anemia
TABLE 2 | Correlations of oxygenscan parameters with fetal hemoglobin, as it integrates the composite effects of multiple physiologic
F-cells, and dense red blood cells.
changes in the RBCs, including intracellular HbS concentration,
EImin EImax PoS
RBC hydration, membrane permeability, and mechanical
deformability of the cytoskeleton.
HbF (%) 0.6310 0.6675 −0.5596 The oxygenscan is a rapid, automated test that uses a small
2.17e-05 4.70e-06 2.60e-04 amount (Sadaf et al. Oxygenscan in Sickle Cell Anemia
A B C
D E F
G H I
FIGURE 2 | Linear correlations of oxygenscan parameters with known biomarkers. (A–C) Linear correlations of EImax with %HbF, %F-cells, and %DRBCs,
respectively. (D–F) Linear correlations of EImin with %HbF, %F-cells, and %DRBCs, respectively. (G–I) Linear correlations of PoS with %HbF, %F-cells, and %DRBCs,
respectively. Dashed lines represent 95% CI. All correlations have p < 0.001.
EImin r = 0.833, p < 0.001, PoS r = 0.574, p = 0.025). Our We noted that very high values of %HbF (>30%) and %F-cells
results on correlation with %HbF are in agreement: EImax (>80%) were consistently associated with a lower PoS
r = 0.6675, p < 0.001; EImin r = 0.6310, p < 0.001, PoS r = 0.5596, (Sadaf et al. Oxygenscan in Sickle Cell Anemia
A
B
FIGURE 3 | Representative oxygenscan curves. (A) Four patients with sickle cell disease with corresponding parameters of %HbF, %F-cells, and %DRBCs.
In general, increase fetal hemoglobin content (%HbF and %F-cells) and decrease in %DRBC are associated with increase in EImax and EImin and a decrease in PoS.
The oxygenscan profile appears to be affected by the combination of these parameters. (B) Two pairs of patients with similar HbF, with and without hydroxyurea
therapy. At both high HbF (top pair of curves) and low HbF (bottom pair of curves) hydroxyurea is associated with higher EImax and EImin. HU, hydroxyurea; Tx, treatment.
(HPFH) and α-thalassemia trait. In addition, all patients in DATA AVAILABILITY STATEMENT
this analysis were at their steady state at the time of sample
collection. Recently, Rab et al. (2020b) described the correlation The raw data supporting the conclusions of this article will
of oxygenscan parameters with patients who experienced VOC be made available by the authors, without undue reservation.
compared to those who did not and demonstrated that oxygenscan
parameters had a predictive value for increased VOC frequency,
and oxygenscan curve improvement aligned with response to ETHICS STATEMENT
hydroxyurea treatment. Further research is needed to correlate
The studies involving human participants were reviewed and
oxygenscan parameters with the various aspects of SCD
approved by Institutional Review Board at Cincinnati Children’s
phenotype and evaluate changes with new medications being
Hospital Medical Center. Written informed consent to participate
developed and used for SCD management.
in this study was provided by the participants or their legal
guardians/next of kin.
CONCLUSION
AUTHOR CONTRIBUTIONS
Oxygen-gradient ektacytometry is a reproducible, rapid, and
automated functional assay that evaluates the sickling capacity AS and TK performed the data analysis, prepared the figures
of an erythrocyte population when challenged with deoxygenation and tables, and wrote the first draft of the manuscript. KS
and reoxygenation. Although the oxygenscan parameters have provided expertise in the performance, standardization, and
an individual relationship with known biomarkers of SCD troubleshooting aspects of the oxygenscan assay. RF, ET, and
severity, the oxygenscan profile captures the cumulative effect DK performed the oxygenscan assays. JK performed assays
of those and likely additional factors and may serve as a novel for RBC counts, %DRBCs, and %HbF. HB performed the F-cell
and useful biomarker to evaluate SCD phenotype. assays. RW and PM were principal investigators of trials from
Frontiers in Physiology | www.frontiersin.org 7 March 2021 | Volume 12 | Article 636609Sadaf et al. Oxygenscan in Sickle Cell Anemia
which patient samples were obtained. CQ provided expertise National Heart, Lung, and Blood Institute Patient-Oriented
in the interpretation of F-cell studies. All authors contributed Career Development award K23HL128885 (PM). The content
to the article and approved the submitted version. is the sole responsibility of the authors and does not necessarily
represent the official views of the NIH.
FUNDING
ACKNOWLEDGMENTS
Research reported in this publication was supported by the
National Center for Advancing Translational Sciences of the We would like to acknowledge all members of the Erythrocyte
National Institutes of Health, under award number Diagnostic Laboratory at Cincinnati Children’s Hospital Medical
2UL1TR001425-05A1, by the Cincinnati Children’s Academic Center (CCHMC) for their technical support, the CCHMC
and Research Committee (ARC) award for Sickle Cell Clinical hematology clinical research support team, as well as patients
Outreach and Research Excellence (TK and CQ), and by a and families for donating samples for this study.
of a new generation ektacytometer. Blood Cells Mol. Dis. 56, 9–22. doi:
REFERENCES 10.1016/j.bcmd.2015.09.001
Davis, B. H., and Davis, K. T. (2004). Enumeration of fetal red blood cells,
Anker, M. S., Haverkamp, W., and Anker, S. D. (2018). A phase 3 trial of F cells, and F reticulocytes in human blood. Curr. Protoc. Cytom. 6:17. doi:
L-glutamine in sickle cell disease. N. Engl. J. Med. 379:1879. doi: 10.1056/ 10.1002/0471142956.cy0617s28
NEJMc1811050 Du, E., Diez-Silva, M., Kato, G. J., Dao, M., and Suresh, S. (2015). Kinetics
Aslan, M., Thornley-Brown, D., and Freeman, B. A. (2000). Reactive species of sickle cell biorheology and implications for painful vasoocclusive crisis.
in sickle cell disease. Ann. N. Y. Acad. Sci. 899, 375–391. doi: 10.1111/j.1749- Proc. Natl. Acad. Sci. U. S. A. 112, 1422–1427. doi: 10.1073/pnas.1424111112
6632.2000.tb06201.x Fabry, M. E., and Nagel, R. L. (1982). Heterogeneity of red cells in the sickler:
Ataga, K. I., Kutlar, A., Kanter, J., Liles, D., Cancado, R., Friedrisch, J., et al. a characteristic with practical clinical and pathophysiological implications.
(2017). Crizanlizumab for the prevention of pain crises in sickle cell disease. Blood Cells 8, 9–15.
N. Engl. J. Med. 376, 429–439. doi: 10.1056/NEJMoa1611770 Franco, R. S., Lohmann, J., Silberstein, E. B., Mayfield-Pratt, G., Palascak, M.,
Ballas, S. K., Larner, J., Smith, E. D., Surrey, S., Schwartz, E., and Rappaport, E. F. Nemeth, T. A., et al. (1998). Time-dependent changes in the density and
(1988). Rheologic predictors of the severity of the painful sickle cell crisis. hemoglobin F content of biotin-labeled sickle cells. J. Clin. Invest. 101,
Blood 72, 1216–1223. doi: 10.1182/blood.V72.4.1216.1216 2730–2740. doi: 10.1172/JCI2484
Ballas, S. K., and Smith, E. D. (1992). Red blood cell changes during the Hoots, W. K., and Shurin, S. B. (2012). Future directions of sickle cell disease
evolution of the sickle cell painful crisis. Blood 79, 2154–2163. doi: 10.1182/ research: the NIH perspective. Pediatr. Blood Cancer 59, 353–357. doi:
blood.V79.8.2154.2154 10.1002/pbc.24180
Bartolucci, P., Brugnara, C., Teixeira-Pinto, A., Pissard, S., Moradkhani, K., Jensen, F. B. (2004). Red blood cell pH, the Bohr effect, and other oxygenation-
Jouault, H., et al. (2012). Erythrocyte density in sickle cell syndromes is linked phenomena in blood O2 and CO2 transport. Acta Physiol. Scand.
associated with specific clinical manifestations and hemolysis. Blood 120, 182, 215–227. doi: 10.1111/j.1365-201X.2004.01361.x
3136–3141. doi: 10.1182/blood-2012-04-424184 Lande, W. M., Andrews, D. L., Clark, M. R., Braham, N. V., Black, D. M.,
Bessis, M., Mohandas, N., and Feo, C. (1980). Automated ektacytometry: a Embury, S. H., et al. (1988). The incidence of painful crisis in homozygous
new method of measuring red cell deformability and red cell indices. Blood sickle cell disease: correlation with red cell deformability. Blood 72, 2056–2059.
Cells 6, 315–327. doi: 10.1182/blood.V72.6.2056.2056
Boisson, C., Rab, M. A. E., Nader, E., Renoux, C., van Oirschot, B. A., Joly, P., Leikin, S. L., Gallagher, D., Kinney, T. R., Sloane, D., Klug, P., and Rida, W.
et al. (2020). Methodological aspects of oxygen gradient ektacytometry in (1989). Mortality in children and adolescents with sickle cell disease.
sickle cell disease: effects of sample storage on outcome parameters in distinct Cooperative study of sickle cell disease. Pediatrics 84, 500–508.
patient subgroups. Clin. Hemorheol. Microcirc. doi: 10.3233/CH-201037 [Epub Lemonne, N., Lamarre, Y., Romana, M., Mukisi-Mukaza, M.,
ahead of print] Hardy-Dessources, M. D., Tarer, V., et al. (2013). Does increased red blood
Brown, R. C., Cruz, K., Kalfa, T. A., Kuypers, F. A., Saraf, S. L., Estepp, J. H., cell deformability raise the risk for osteonecrosis in sickle cell anemia?
et al. (2020). FT-4202, an allosteric activator of pyruvate kinase-r, demonstrates Blood 121, 3054–3056. doi: 10.1182/blood-2013-01-480277
proof of mechanism and proof of concept after a single dose and after Marcus, S. J., Kinney, T. R., Schultz, W. H., O’branski, E. E., and Ware, R. E.
multiple daily doses in a phase 1 study of patients with sickle cell disease. (1997). Quantitative analysis of erythrocytes containing fetal hemoglobin
Blood 136, 19–20. doi: 10.1182/blood-2020-134269 (F cells) in children with sickle cell disease. Am. J. Hematol. 54, 40–46.
Brugnara, C. (2003). Sickle cell disease: from membrane pathophysiology to doi: 10.1002/(SICI)1096-8652(199701)54:13.0.CO;2-4
novel therapies for prevention of erythrocyte dehydration. J. Pediatr. Hematol. McGann, P. T., Niss, O., Dong, M., Marahatta, A., Howard, T. A., Mizuno, T.,
Oncol. 25, 927–933. doi: 10.1097/00043426-200312000-00004 et al. (2019). Robust clinical and laboratory response to hydroxyurea using
Chanutin, A., and Curnish, R. R. (1967). Effect of organic and inorganic pharmacokinetically guided dosing for young children with sickle cell anemia.
phosphates on the oxygen equilibrium of human erythrocytes. Arch. Biochem. Am. J. Hematol. 94, 871–879. doi: 10.1002/ajh.25510
Biophys. 121, 96–102. doi: 10.1016/0003-9861(67)90013-6 Meier, E. R., Byrnes, C., Weissman, M., Noel, P., Luban, N. L., and Miller, J. L.
Charache, S., Grisolia, S., Fiedler, A. J., and Hellegers, A. E. (1970). Effect of (2011). Expression patterns of fetal hemoglobin in sickle cell erythrocytes
2,3-diphosphoglycerate on oxygen affinity of blood in sickle cell anemia. J. are both patient‐ and treatment-specific during childhood. Pediatr. Blood
Clin. Invest. 49, 806–812. doi: 10.1172/JCI106294 Cancer 56, 103–109. doi: 10.1002/pbc.22643
Clark, M. R., Mohandas, N., and Shohet, S. B. (1980). Deformability of oxygenated Mohandas, N., and Evans, E. (1984). Adherence of sickle erythrocytes to vascular
irreversibly sickled cells. J. Clin. Invest. 65, 189–196. doi: 10.1172/JCI109650 endothelial cells: requirement for both cell membrane changes and plasma
Clark, M. R., Mohandas, N., and Shohet, S. B. (1983). Osmotic gradient factors. Blood 64, 282–287. doi: 10.1182/blood.V64.1.282.282
ektacytometry: comprehensive characterization of red cell volume and surface Mohandas, N., and Evans, E. (1985). Sickle erythrocyte adherence to vascular
maintenance. Blood 61, 899–910. doi: 10.1182/blood.V61.5.899.899 endothelium. Morphologic correlates and the requirement for divalent cations
Da Costa, L., Suner, L., Galimand, J., Bonnel, A., Pascreau, T., Couque, N., and collagen-binding plasma proteins. J. Clin. Invest. 76, 1605–1612. doi:
et al. (2016). Diagnostic tool for red blood cell membrane disorders: assessment 10.1172/JCI112144
Frontiers in Physiology | www.frontiersin.org 8 March 2021 | Volume 12 | Article 636609Sadaf et al. Oxygenscan in Sickle Cell Anemia Noguchi, C. T., Torchia, D. A., and Schechter, A. N. (1983). Intracellular Risinger, M., and Kalfa, T. A. (2020). Red cell membrane disorders: structure polymerization of sickle hemoglobin. Effects of cell heterogeneity. J. Clin. meets function. Blood 136, 1250–1261. doi: 10.1182/blood.2019000946 Invest. 72, 846–852. doi: 10.1172/JCI111055 Steinberg, M. H. (2005). Predicting clinical severity in sickle cell anaemia. Noomuna, P., Risinger, M., Zhou, S., Seu, K., Man, Y., An, R., et al. (2020). Br. J. Haematol. 129, 465–481. doi: 10.1111/j.1365-2141.2005.05411.x Inhibition of band 3 tyrosine phosphorylation: a new mechanism for treatment Steinberg, M. H., Chui, D. H., Dover, G. J., Sebastiani, P., and Alsultan, A. of sickle cell disease. Br. J. Haematol. 190, 599–609. doi: 10.1111/bjh.16671 (2014). Fetal hemoglobin in sickle cell anemia: a glass half full? Blood 123, Papageorgiou, D. P., Abidi, S. Z., Chang, H. Y., Li, X., Kato, G. J., Karniadakis, G. E., 481–485. doi: 10.1182/blood-2013-09-528067 et al. (2018). Simultaneous polymerization and adhesion under hypoxia in Steinberg, M. H., Kumar, S., Murphy, G. J., and Vanuytsel, K. (2019). Sickle sickle cell disease. Proc. Natl. Acad. Sci. U. S. A. 115, 9473–9478. doi: 10.1073/ cell disease in the era of precision medicine: looking to the future. Expert pnas.1807405115 Rev. Precis. Med. Drug Dev. 4, 357–367. doi: 10.1080/23808993.2019.1688658 Parrow, N. L., Tu, H., Nichols, J., Violet, P. C., Pittman, C. A., Fitzhugh, C., Steinberg, M. H., and Rodgers, G. P. (2001). Pathophysiology of sickle cell et al. (2017). Measurements of red cell deformability and hydration reflect disease: role of cellular and genetic modifiers. Semin. Hematol. 38, 299–306. HbF and HbA. Blood Cells Mol. Dis. 65, 41–50. doi: 10.1016/j.bcmd.2017.04.005 doi: 10.1016/S0037-1963(01)90023-X Poillon, W. N., Kim, B. C., Rodgers, G. P., Noguchi, C. T., and Schechter, A. N. Valtis, D. J., and Kennedy, A. C. (1954). Defective gas-transport function of (1993). Sparing effect of hemoglobin F and hemoglobin A2 on the stored red blood-cells. Lancet 266, 119–124. doi: 10.1016/s0140-6736(54)90978-2 polymerization of hemoglobin S at physiologic ligand saturations. Proc. Natl. Vargas, F. F., and Blackshear, G. L. (1982). Vascular resistance and transit time Acad. Sci. U. S. A. 90, 5039–5043. doi: 10.1073/pnas.90.11.5039 of sickle red blood cells. Blood Cells 8, 139–145. Quinn, C. T. (2016). Minireview: clinical severity in sickle cell disease: the Vichinsky, E., Hoppe, C. C., Ataga, K. I., Ware, R. E., Nduba, V., El-Beshlawy, A., challenges of definition and prognostication. Exp. Biol. Med. 241, 679–688. et al. (2019). A phase 3 randomized trial of voxelotor in sickle cell disease. doi: 10.1177/1535370216640385 N. Engl. J. Med. 381, 509–519. doi: 10.1056/NEJMoa1903212 Rab, M. A. E., Kanne, C. K., Bos, J., Boisson, C., van Oirschot, B. A., Nader, E., Yawn, B. P., Buchanan, G. R., Afenyi-Annan, A. N., Ballas, S. K., Hassell, K. L., et al. (2020a). Methodological aspects of the oxygenscan in sickle cell disease: James, A. H., et al. (2014). Management of sickle cell disease: summary of a need for standardization. Am. J. Hematol. 95, E5–E8. doi: 10.1002/ajh.25655 the 2014 evidence-based report by expert panel members. JAMA 312, Rab, M. A. E., Kanne, C. K., Bos, J., van Oirschot, B. A., Boisson, C., 1033–1048. doi: 10.1001/jama.2014.10517 Houwing, M. E., et al. (2020b). Oxygen gradient ektacytometry derived- biomarkers are associated with vaso-occlusive crises and correlate with Conflict of Interest: The authors declare that the research was conducted in treatment response in sickle cell disease. Am. J. Hematol. 96, E29–E32. doi: the absence of any commercial or financial relationships that could be construed 10.1002/ajh.26031 as a potential conflict of interest. Rab, M. A. E., van Oirschot, B. A., Bos, J., Kanne, C. K., Sheehan, V. A., van Beers, E. J., et al. (2019a). Characterization of sickling during controlled Copyright © 2021 Sadaf, Seu, Thaman, Fessler, Konstantinidis, Bonar, Korpik, automated deoxygenation with oxygen gradient ektacytometry. J. Vis. Exp. Ware, McGann, Quinn and Kalfa. This is an open-access article distributed under doi: 10.3791/60213 the terms of the Creative Commons Attribution License (CC BY). The use, Rab, M. A. E., van Oirschot, B. A., Bos, J., Merkx, T. H., van Wesel, A. C. W., distribution or reproduction in other forums is permitted, provided the original Abdulmalik, O., et al. (2019b). Rapid and reproducible characterization of author(s) and the copyright owner(s) are credited and that the original publication sickling during automated deoxygenation in sickle cell disease patients. Am. in this journal is cited, in accordance with accepted academic practice. No use, J. Hematol. 94, 575–584. doi: 10.1002/ajh.25443 distribution or reproduction is permitted which does not comply with these terms. Frontiers in Physiology | www.frontiersin.org 9 March 2021 | Volume 12 | Article 636609
You can also read