Plagiarism, Internet and Academic Success at the University
←
→
Page content transcription
If your browser does not render page correctly, please read the page content below
JOURNAL NEW APPROACHES IN EDUCATIONAL RESEARCH
Vol. 7. No. 2. July 2018. pp. 98–104 ISSN: 2254-7339 DOI: 10.7821/naer.2018.7.324

                                                                                                                               ORIGINAL

Plagiarism, Internet and Academic Success at the University
Juan Carlos Torres-Diaz1*                         , Josep M. Duart2                   , Mónica Hinojosa-Becerra3
1
 Departamento de Ciencias de la Computación, Universidad Técnica Particular de Loja, Ecuador {jctorres@
utpl.edu.ec}
2
    ELearn Center, Universitat Oberta de Catalunya, España {jduart@uoc.edu}
3
    Departamento de Comunicación, Universidad Nacional de Loja, Ecuador {monica.hinojosa@unl.edu.ec}
Received on 23 May 2018; revised on 30 May 2018; accepted on 5 June 2018; published on 15 July 2018

DOI: 10.7821/naer.2018.7.324

ABSTRACT                                                                        Regarding the incidence of socio-economic variables on the
In this work, we determined, the level of incidence of the use of            use given to technology, the contributions are available (Di-
technologies on academic success and the incidence of interaction            Maggio, Hargittai, Celeste, & Shafer, 2004; Van Dijk, 2005)
and experience on the level of plagiarism of university students.            coinciding with the theory of gaps in knowledge (Tichenor, Do-
A sample of 10,952 students from 31 face-to-face universities in             nohue, & Olien, 1970) that the socioeconomic status that best
Ecuador was created. Students were classified based on their                 assimilate information are the highest. Recent studies, point
experience level, level of interaction with teachers and classmates,         out to the prevalence of socioeconomic variables; in the case of
and the use they do with technology for academic activities. The             Ecuador, Tirado-Morueta, Mendoza-Zambrano, Aguaded-Gó-
results showed that the level of experience does not affect acade-           mez and Marín-Gutiérrez (2017) conclude that the effect of
mic success, but does have an incidence on plagiarism levels that            belonging to a family of high socio-economic level loses strength
increase as this experience increases. Plagiarism reaches higher             as the level of Internet access increases. Scheerder, van Deursen
levels when level of experience, family income and hours of con-             and van Dijk (2017) point out that sociodemographic variables
nection per day increases. Academic performance depends on the               have the greatest impact on digital uses and skills. However, this
number of hours that students seek information and the number of             relationship tends to decrease and at present, despite being sig-
academic videos they watch. Also, plagiarism tends to decrease               nificant, it has a low incidence (Jara et al., 2015; Torres-Díaz,
as the student makes better use of technology for their academic             Duart, Gómez-Alvarado, Marín-Gutiérrez, & Segarra-Faggioni,
activities.                                                                  2016; Wainer, Vieira, & Melguizo, 2015). This make us to re-
                                                                             think the research scenario, since the explanation for differences
KEYWORDS: PLAGIARISM, ACADEMIC ACHIEVEMENT, IN-                              in use is determined by a different set of variables.
TERNET.
                                                                             1.2 Technology and academic performance
1      INTRODUCTION                                                          There is evidence suggesting that the time spent studying on-
                                                                             line does not necessarily imply better results (Castaño-Muñoz,
1.1 Determinants of the digital gap                                          Duart, & Sancho-Vinuesa, 2014). Positive effects can be found in
Education is an area that does not escape to dynamic of informa-             the levels of learning and in the results obtained by students (Le-
tion society and today is one of the areas that experience more              ung & Lee, 2012; López-Pérez, Pérez-López, Rodríguez-Ariza,
innovation. The dilemma of having or not having a connection                 & Argente-Linares, 2013; Markovíc & Jovanovíc, 2012; Mohd
that defined the digital gap in its beginnings has changed and fo-           & Maat, 2013). There are also studies where no incidence of
cuses on how technology is used to take better advantage of it               technology has been found on learning outcomes (Wittwer &
(Hargittai, 2002). In 2001, the skills and abilities in the use of           Senkbeil, 2008) or negative effects when problems of addiction
technology were considered as one of the digital gap levels to               are present that constitute a social problem (Chou, Condron, &
be considered (DiMaggio & Hargittai, 2001). Today differences                Belland, 2005; Kim, LaRose, & Peng, 2009), having as a con-
are fundamental and often have nothing to do with the lack of                sequence the decrease of the student’s academic performance
knowledge but with the culture of using computer tools. The di-              (Junco & Cotten, 2011; Kubey, Lavin, & Barrows, 2001). The
fferences that may exist between users regarding their use of the            inclusion of technology in education showed different effects on
Internet requires a classification based on the most important and           the academic performance of students, similar studies present
common activities using technology (Scheerder, Van Deursen, &                contradictory results (Torres-Díaz et al., 2016).
Van Dijk, 2017).                                                                If the measure of the effect of technology is academic perfor-
                                                                             mance, it is necessary to consider that it is a multidimensional
                                                                             concept (Fullana, 1992) whose evaluation requires an equally
*To whom correspondence should be addressed:                                 multidimensional approach. In this paper, the academic success
Universidad Técnica Particular de Loja, San Cayetano
                                                                             associated with approving or not approving the subjects or cre-
1101608 Loja-Ecuador
                                                                             dits that the student has taken is evaluated. Recent work in this
                                                                             area indicates that having a computer and Internet connection

© NAER Journal of New Approaches in Educational Research 2018 | http://naerjournal.ua.es                                                     98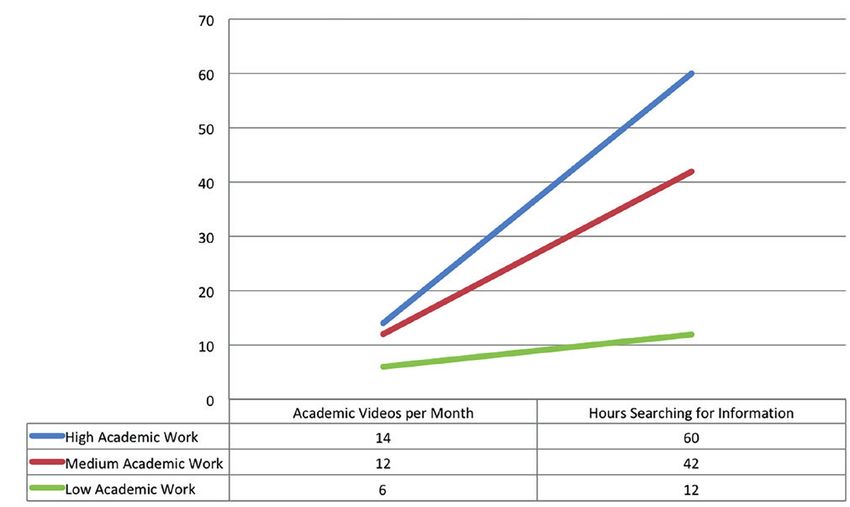
Plagiarism, Internet and academic success at the University

has less and less impact on a better academic performance, the         nage information and the information available on the Internet
even greater effect, although decreasing, occurs in households         have opened the doors to a phenomenon that is not new, plagia-
with higher socioeconomic status (Wainer et al., 2015). The use        rism has increased in the educational field and at the same time
of technology in the classroom requires an approach and an ade-        tools for control it have emerged. Despite this, it is impossible to
quate design that makes the most of both resources and learning        prevent students from having the possibility of using informa-
opportunities. The opposite supposes to have effects not neces-        tion that does not belong to them by assigning their name. In the
sarily expected. Technology can, in addition to contributing to        educational activity the students work with different activities,
improve learning, cause some problems related to the distraction       exercises, tests or solutions to problems and all the informa-
that may involve not assimilating content and a consequent low         tion is just a few clicks away (Atkins & Nelson, 2001; DeVoss
qualification (Ravizza, Hambrick, & Fenn, 2014).                       & Rosatti, 2002; Moore Howard, 2007). The Internet has been
                                                                       divided into all aspects of our lives, including university class-
1.3 Plagiarism                                                         rooms, and has opened up new ways of finding solutions for class
The writing of academic documents is based on the current state        assignments. Many students seek the quickest solution to tasks,
of knowledge through the incorporation of ideas from different         regardless of the validity of the sources or without respecting the
authors (Pecorari & Petric, 2014). This is a process that is gover-    work of others (Sureda, Comas and Oliver, 2015).
ned by the habit that an author has to comply, with disciplinary          We are focused on the higher education field, where the in-
established practices and shared to get away from accusations          crease in plagiarism has been a constant concern in recent years
of plagiarism (Pecorari, 2008). In recent decades, the arrival of      (Heckler & Forde, 2015), with teachers increasingly concerned
the Internet has led to a growing wealth of readily available and      about the frequency and apparent lack of awareness, into the stu-
easy to plagiarize sources (Hu & Lei, 2012). The incidence of          dents, of the moral implications (Perry, 2010). The results of a
plagiarism is increasing and has generated great concerns in the       survey conducted by the companies Six Degrés and Le Sphinx
academic world.                                                        Développement (2008) showed some significant behaviors of
   There are suggestions about how cultures differ in their un-        students and teachers, identifying the Internet as the main sour-
derstanding and acceptance of plagiarism (Sowden, 2005). Other         ce of documentation and more than 40% of students admitted
researchers (Pecorari, 2008; Rinnert & Kobayashi, 2005) have           that they had never cited their sources. These results are consis-
the idea that difficulties of a second language authors, are proba-    tent with another experiment carried out among 1,025 students
bly the lack of an adequate command of the language, which can         (Comas, Sureda, & Oliver, 2011), which states that 70% of uni-
cause insecurity about their use of language and therefore make        versity students admitted to copying texts or fragments of texts
depend too much on the original texts.                                 for the development of their academic activities, presenting them
   In the Anglo-American academic world, it is considered that         as their own. It is interesting to observe that the greater the wei-
source documentation and paraphrasing are two important stra-          ght of the activity in the final grade, the lower the percentage
tegies to avoid plagiarism (Park, 2003). While the first one is        of plagiarism, which suggests an interesting link between the
reasonably simple and can be performed with adequate training,         perceived importance of the task and the tendency to plagiarize
the second one implies high demand in the knowledge and lin-           (Gómez, Salazar, & Vargas, 2013).
guistic competence (Keck, 2010). Researchers and academic                 About the factors that conduct students to plagiarize, even be-
leaders differ greatly in the standards on what is considered a        fore the Internet era, Ashworth, Bannister and Thorne (1997)
periphrasis. While some ones believe that to get away from pla-        identified four fundamental issues: 1) the students’ lack of
giarism, they should not have be any trace of the textual copy,        awareness of whether they are plagiarizing or not; 2) the low
even of strings of a few words since the original work (Benos et       probability of being detected; 3) the pressure derived from the
al., 2005; Roig, 2001), others adopt softer norms allowing the         level of demand and the deadlines established for deliveries; and
inclusion of more sources in a paraphrase (Keck, 2006; Pecorari,       4) the actual writing of the activities provided by the teachers.
2008).                                                                 These factors are still relevant: a more recent study by Eret and
   To solve the problem of plagiarism, it is necessary to look         Ok (2014) observed that the tendency to plagiarize was increased
beyond the symptoms and reach the root of it (Macdonald &              with the arrival of the Internet, and points out as main reasons
Carroll, 2006). All the factors that contribute to plagiarism are      for plagiarism the limitations of time, excessive workloads and
reduced to a certain deficiency in plagiarists who lack the aca-       a high difficulty of the proposed tasks. Another recent study by
demic integrity, good-will and knowledge necessary to use the          Hussein, Rusdi and Mohamad (2016) found that students were
sources adequately (Pecorari, 2008).                                   fully aware of what plagiarism was and that it is not appropriate
   Teachers have a role to play detecting and responding to pla-       to use it. A study by Kauffman and Young (2015) analyzed how
giarism and educating to avoid this happens. Researchers have          easy the access to copy and paste tools are, and the presentation
paid increasing attention to teachers’ perceptions of plagiarism.      of tasks, influenced attitudes towards plagiarism.
Previous studies found that teachers differ among themselves in           Most studies agree that: access to information has become so
what constitutes plagiarism (Borg, 2009; Flint, Clegg, & Macdo-        immediate that it is perceived by some as a “common knowled-
nald, 2006; Pickard, 2006), and that many had little knowledge         ge” available for everyone to reproduce (Walker, 2010). These
about the institutional definitions of plagiarism and, that this was   generalized problems have led to an academic / technological
not effectively taught (Eriksson & Sullivan, 2008).                    response in search of new ways and tools to detect plagiarism.

1.4 Higher education and plagiarism                                    2    DATA AND METHODS
Plagiarism has become a widespread problem at all levels, and it
is easy to find cases of plagiarism at higher educational levels in    2.1 Data
the media. For example, in recent years we have witnessed the          This study includes a sample of 10,952 face-to-face universities
resignation of two German ministers accused of plagiarism in           students, from 31 universities in Ecuador, which 51.7% corres-
their doctoral thesis (Eddy, 2013). The tools to search and ma-        pond to women and the remaining 48.3% correspond to men.

                                                                                                                                        99
Torres-Diaz, J. C.; Duart, J. M. ; Hinojosa-Becerra, M. / Journal of New Approaches in Educational Research 7(2) 2018. 98-104
A physical survey was applied in each institution, collecting a
significant sample in each case. The calculation of the sample
was obtained using a confidence level of 95% (Z=1.96) and a
sample error of 5%.
The instrument used was based on the questionnaire of The
Internet Catalonia project (UOC, 2003) and on questionnaires
of the Digital Literacy in Higher Education project (DLINHE,
2011). The questionnaire collects general information about the
preferences of students regarding their connection patterns;
it also collects information about the use of technology from
academic activities and collects information about academic
success.
2.2 Methods
The classifications were developed applying the non-hierarchi- Figure 1. Classification based on experience levels
cal K-media algorithm, useful when working with large samples
(Díaz De Rada, 2002). Classifications were built based on the The lower experience group shows the lowest values in the two
use of technological tools into the learning process, and based variables. That is, it connects fewer hours per day and fewer years
on the students’ willingness to use technology. Different options as Internet users in relation to the remaining students; this group
were tested with several groups and the easier to interpret clas- represents 68% of the sample. The higher experience group is the
sifications was chosen in all cases. The classifications based on one with the highest values in the variables levels, representing
experience levels was made using the following variables: 32% of the students. In this classification, the greatest differen-
• Internet connection hours per day. tiation between the groups is given by the number of hours the
• Years as an Internet user. student spends searching for academic information.
The classification based on the interaction activities used the
following variables: 3.1.2 Classification based on interaction
• Number of queries to the teacher. To build the groups based on the interaction activities, it should be
• Number of queries to colleagues. noted that the variables used actually measure academic activities,
• Chat hours on academic topics. however these are more oriented to the exchange of information
• Post number in social networks about academic topics. and messages with other people. This classification refers to the
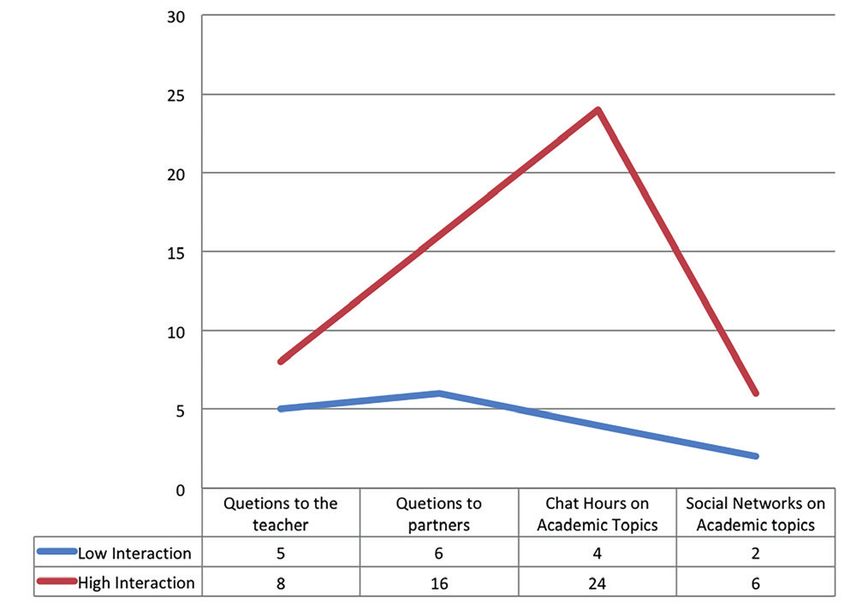
The classification based on the academic activities used the interaction activities of the student and considers the variables
following variables: that can be observed in Figure 2:
• Number of academic videos.
• Hours of research of academic information.
The academic success variable (number of failed subjects) was
constructed using the following variables: number of subjects
enrolled and number of subjects passed. The difference between
the two was extracted and the number of failed subjects was ob-
tained. To measure the level of plagiarism of the students, an
ordinal variable was used in which the student points out a value
between 1 and 10, which indicates the frequency with which he
copies his academic tasks from the Internet. For the relations
search, we used the Chi-square statistic, Pearson’s R, Lineal and
Tobit regression, in which the academic success and level of pla-
giarism were the dependent variable.
3 RESULTS
3.1 Classification of students Figure 2. Classification based on interaction
Applying cluster analysis, three classifications were created ba-
sed on: year of experience, level of interaction and based on the The resulting classification divides the students into two groups:
use of technology for academic activities. in group 1, which is called low interaction, the students’ activity
in terms of writing queries to professors and classmates, writing
3.1.1 Classification based on years of experience on social networks and chatting on academic subjects is low with
Cluster analysis was performed on the variables indicated in Fi- respect to students in group 2. This group is composed with 80%
gure 1, this categorization is based on years of experience and of the students in the sample. In the second group, students’ ac-
the students were divided into two groups. tivity is greater and the queries to classmates and chat hours on
academic topics stand out. This group is composed with 20% of
the students. The biggest difference is given by two variables: the
number of hours the student chats about academic topics and the
number of questions he asks his classmates, which is greater than
the number of questions he asks his teachers
100Plagiarism, Internet and academic success at the University
3.1.3 Classification based on academic activities ternet affects the level of plagiarism, this implies that the higher
the level of knowledge, the higher the level of plagiarism; Ano-
A third classification analyses the student`s work with the tra-
ther variable that has a significant impact is the number of hours
ditional activities carried out by a student when studying using
the student connects per day, as the number of hours increases,
technologies. These activities are considered in the variables in
the level of student plagiarism also increases; the same behavior
figure 3.
has the variable level of income, the higher the level of income,
the higher the level of student plagiarism.
The use that students give to technology affects the level of
plagiarism. Students who use technology in a better way for
academic activities tend to plagiarize less; on the other hand,
students who download less educational resources, watch fewer
academic videos or invest less time searching for information,
tend to have higher levels of plagiarism.
Table 2. Linear regression model Academic_activities and Plagiarism
Tip
Model B Beta t Sig.
error
1 Cons 2,655 0,24 11,057 .000
Figure 3. Classification according to the use of technology in academic Academic_
0,492 0,083 0,057 5,953 .000
activities activities
In general, in this classification, the differences are given by Searching for cause-effect relationships we did the relation
the number of academic videos that are watched, and in a major between the different categories with the academic success
part, by the number of hours spent searching for information. achieved by the students. First, the experience was related to
The academic work group with minimum values in the two academic success and no significant relationship was found (X 2 =
variables represents 89.3% of the students; the medium acade- 0.010, p> 0.05). Something similar happened with the classifica-
mic work group represents 9.9%; and the higher academic work tion based on the levels of interaction and academic performance
group represents only 0.8%. and with the relationship between the levels of academic work
The classifications: interaction and academic activities, are and academic success.
complementary. In both, variables that measure the use of tech- Significant relationships were found between the number of
nology in academic activities are used. This complementarity is queries the student makes to the teacher and academic success.
reflected in a result that indicates this: students who have high The relationship determines that the greater number of queries,
interaction, are those who use technology in a better way for the student tends to fail less. This same effect has the number
their academic work. of hours the student spent seeking information related to their
academic activities. A different result is the one that indicates:
Table 1. Relationship between interaction and use of technology for the greater the participation in academic forums, the probability
academic work of failing increases.
The student’s gender does not have a relationship with the inte-
High Medium Low raction categories (X2 = 1.5, p> 0.05). It also has no relationship
academic academic academic Total with the categories of academic work (X2 = 1.55, p> 0.05). And
work work work in what has to do with the levels of knowledge of technology, we
Low Interaction 43 532 8802 8777 found that the tendency of women to belong to the middle and
high categories is greater (X 2 = 25.86, p 0.05). There is also no significant relationship (X 2 = 360,996,
Total 88 1081 9783 10592
p >0.05) with experience levels; the same applies to the catego-
ries of academic work (X 2 = 58.731, p> 0.05).
It can be observed in the previous chart: the high interaction is
The experience in the management of technology, classified
the majority in the high and medium academic work groups. And
in two levels, implies that the students show works, that are not
the opposite, it is a minority in the low academic work group.
their authorship. If a student change their level of experience
The relation is significant (X 2 = 0.259, p< 0.05).
handling technology to a higher one, the probability that the le-
3.2 Relations vel of plagiarism rise one unit, is of the 10.4%
The levels of plagiarism are affected by different variables, the
incidence is low but significant. The level of knowledge of the in-
101Torres-Diaz, J. C.; Duart, J. M. ; Hinojosa-Becerra, M. / Journal of New Approaches in Educational Research 7(2) 2018. 98-104
Table 3. Correlation with academic success
How many inqui- How many virtual How many hours do
Failed Subjects
ries do you make to forums do you yo look for academic
(academic
your teachers each participate in each information on the
success)
monts? month? Internet, each month?
How many inquiries do you make to your teachers
1 .154** .084** -.035**
each month?
How many virtual forums do you participate in each
.154** 1 0,002 .024*
month?
How many hours do you look for academic informa-
.084** 0,002 1 -.027**
tion on the Internet, each month?
Failed subjects (academic success) -.035** .024* -0,027 1
Note: * pt [95% Conf. Interval]
Academic uses -0,5544231 0,0908543 -6,1 0 -0,732514 -0,3763323
_cons 4835513 0,1060924 45,58 0 4627553 5043473
/sigma 3246986 0,0237882 3200357 3293615
In this case, there is an inverse relationship: if a student raises The interaction levels divided the students into two groups: low
his level of use of technology for academic activities, the proba- interaction and high interaction. When this classification was re-
bility that the level of plagiarism is reduced by one unit, increases lated to academic success, no significant relationship was found.
by 55%. However, relating the number of queries done by the students to
the teacher, and the academic success, the greater the number of
4 DISCUSSION AND CONCLUSIONS queries the student fails less. This have a particularity due to the
variable number of queries to the teacher is part of the variables
The time of connection and the years as an Internet user, allow that make up the interaction classification.
us to define a classification that shows the level of disposition It is strange that we found this: participation in academic
that a student can have to use technology. In this classification forums has a negative impact on academic success, however it
there is a group called “lower experience” (68%) that is the one is necessary to contextualize in this regard, stating that, if the
that presents lower levels of experience and connection time. This forums are not part of the learning activities or are participations
group, is the group with the lowest income, which would explain outside the educational institution, they can be considered distrac-
their situation, this is aligned with the postulates of the digital gap tors and the result is logical. In the case of the forums that are part
theory. There is one additional group called “higher experience” of the academic activities, the theory and studies on the subject
characterized by having more connection time and more years as suggest that in the best of cases there is no incidence (Wittwer &
an Internet user. These groups shows a different behaviour in ter- Senkbeil, 2008). The levels of interaction are not influenced by
ms of gender, which places women as a significant majority in gender, unlike similar studies where it is evident that gender dis-
the high level, unlike what was presented in previous research criminates activity levels. An aspect that was originally evidenced
(Torres-Díaz et al., 2016) where women tended to have less expe- by the concepts of the digital gap and knowledge gap theory is the
rience and connection time. Something important we found, is the one that shows that the higher the level of income, the greater the
determination of incidence of experience levels using technology level of interaction.
in the level of plagiarism of academic papers that after are presen- A third classification putted together the activities that can be
ted as homework (investigation). As this experience increases, the considered appropriate for a training process. In this classifica-
level of plagiarism also increases. tion, the variables that have a higher level of discrimination are
102Plagiarism, Internet and academic success at the University
the number of academic videos that the student watches and the Hargittai, E. (2002). Second level digital divide: Differences in people’s online
number of hours that he seeks information. Because both, the skills. First Monday, 7(4). doi:10.5210/fm.v7i4.942
Heckler, N. C. & Forde, D. R. (2015). The role of cultural values in plagiarism
classification that measures the interaction and the one that mea- in higher education. Journal of Academic Ethics, 13(1), 61-75. doi:10.1007/
sures the academic work, have complementary activities, a direct s10805-014-9221-3 Retrieved from: https://goo.gl/Psd84d
relationship was observed, students who have the most interaction Hussein, N., Rusdi, S. D., & Mohamad, S. S. (2016). Academic Dishonesty Among
are those who have the most academic work, this is a logical and Business Students: A Descriptive Study of Plagiarism Behavior. In 7th Inter-
national Conference on University Learning and Teaching (InCULT 2014)
expected result . The interaction in this work affects the way in
Proceedings (pp. 639-648). Singapore: Springer. Retrieved from: https://goo.
which the student uses the technology but it is not related to age gl/C5kugB
or income levels of the student. The use of technology in aca- Hu G. & Lei J. (2012). Investigating Chinese university students’ knowledge of
demic activities also has an impact on the level of plagiarism of and attitudes toward plagiarism from an integrated perspective. Language
students, the greater the use, the tendency to plagiarism decreases. Learning, 62(3), 813–850. doi:10.1111/j.1467-9922.2011.00650.x
Jara, I., Claro, M., Hinostroza, J. E., San Martín, E., Rodríguez, P., Cabello, T.,
This finding is not necessarily determinative and could be only an Ibieta, A., & Labbé, C. (2015). Understanding factors related to Chilean stu-
expression other than the appropriate use of technology. dents’ digital skills: A mixed methods analysis. Computers and Education,
Level of knowledge of Internet, hours of connection and inco- 88, 387–398. doi:10.1016/j.compedu.2015.07.016
me level affects level of plagiarism, the higher the level of this Junco, R. & Cotten, S. (2011). Perceived academic effects of instant messag-
ing use. Computers & Education, 56(2), 370–378. doi:10.1016/j.compe-
variables, the higher the level of student plagiarism.
du.2010.08.020
Kauffman, Y., & Young, M. F. (2015). Digital plagiarism: An experimental study
REFERENCES of the effect of instructional goals and copy-and-paste affordance. Comput-
Ashworth, P., Bannister, P., Thorne, P., & Students on the Qualitative Research ers & Education, 83, 44-56. doi:10.1016/j.compedu.2014.12.016
Methods Course Unit. (1997). Guilty in whose eyes? University students’ per- Keck, C. (2006). The use of paraphrase in summary writing: A comparison of
ceptions of cheating and plagiarism in academic work and assessment. Studies L1 and L2 writers. Journal of Second Language Writing, 15(4), 261-278.
in higher education, 22(2), 187-203. doi:10.1080/03075079712331381034 doi:10.1016/j.jslw.2006.09.006
Atkins, T. & Nelson, G. (2001). Plagiarism and the Internet: Turning the tables. The Keck, C. (2010). How do university students attempt to avoid plagiarism? A gram-
English Journal, 90(4), 101-104. doi:10.2307/821911 matical analysis of undergraduate paraphrasing strategies. Writing & Peda-
Benos, D. J., Fabres, J., Farmer, J., Gutierrez, J. P., Hennessy, K., Kosek, D., … & gogy, 2(2), 193-222. doi:10.1558/wap.v2i2.193
Wang, K. (2005). Ethics and scientific publication. Advances in Physiology Kim, J., LaRose, R., & Peng, W. (2009). Loneliness as the cause and the effect
Education, 29(2), 59-74. doi:10.1152/advan.00056.2004 of problematic Internet use: The relationship between Internet use and
Borg E. (2009). Local plagiarisms. Assessment and Evaluation in Higher Education, psychological well-being. Cyberpsychology and Behavior, 12, 451–455.
34(4), 415–426. doi:10.1080/02602930802075115 doi:10.1089/cpb.2008.0327
Castaño-Muñoz, J., Duart, J. M., & Sancho-Vinuesa, T. (2014). The Internet in Kubey, R. W., Lavin, M. J., & Barrows, J. R. (2001). Internet use and collegiate
face-to-face higher education: Can interactive learning improve academic academic performance decrements: Early fíndings. Journal of Communica-
achievement?. British Journal of Educational Technology, 45(1), 149-159. tion, 51(2), 366–382. doi:10.1111/j.1460-2466.2001.tb02885.x
doi:10.1111/bjet.12007 Leung, L. & Lee, P. (2012). Impact of Internet Literacy, Internet Addiction Symp-
Chou, C., Condron, L., & Belland, J. C. (2005). A review of the research on Inter- toms, and Internet Activities on Academic Performance. Social Science
net addiction. Educational Psychology Review, 17(4), 363–388. doi:10.1007/ Computer Review, 30(4), 403–418. doi:10.1177/0894439311435217
s10648-005-8138-1 López-Pérez, M. V., Pérez-López, M. C., Rodríguez-Ariza, L., & Argente-Lin-
Comas Forgas, R., Sureda Negre, J., & Oliver Trobat, M. (2011). Prácticas de ares, E. (2013). The influence of the use of technology on student outcomes
citación y plagio académico en la elaboración textual del alumnado universi- in a blended learning context. Educational Technology Research and De-
tario. Revista Teoría de la Educación: Educación y Cultura en la Sociedad de velopment, 61(4), 625–638. doi:10.1007/s11423-013-9303-8
la Información, 1(12), 359-385. Retrieved from: https://goo.gl/jjcouW Macdonald, R. & Carroll, J. (2006). Plagiarism—a complex issue requiring a ho-
DeVoss, D. & Rosati, A. C. (2002). “It wasn’t me, was it?” Plagiarism and the listic institutional approach. Assessment & Evaluation in Higher Educa-
Web. Computers and composition, 19(2), 191-203. doi:10.1016/S8755- tion, 31(2), 233-245. doi:10.1080/02602930500262536
4615(02)00112-3 Markovíc, S. & Jovanovíc, N. (2012). Learning style as a factor which affects
DLINHE. (2011). Digital Literacy in Higher Education. Retrieved from: https://goo. the quality of e-learning. Artificial Intelligence Review, 38, 303–312.
gl/dcQ4gj doi:10.1007/s10462-011-9253-7
Díaz de Rada, J. V. (2002). Técnicas de análisis multivariante para investigación Mohd, N. & Maat, S. (2013). An investigation on ICT application in learning
social y comercial. Madrid: RAMA. mathematics among engineering technology students. World Applied Sci-
DiMaggio, P. & Hargittai, E. (2001). From the “Digital Divide” to “Digital Inequal- ences Journal, 21(6), 825–828. doi:10.5829/idosi.wasj.2013.21.6.59
ity”: Studying Internet Use As Penetration Increases. New Jersey: Princeton Moore Howard, R. (2007). Understanding “Internet plagiarism”. Computers and
University. Composition, 1(24), 3-15. doi:10.1016/j.compcom.2006.12.005
DiMaggio, P., Hargittai, E., Celeste, C., & Shafer, S. (2004). From unequal access Park, C. (2003). In other (people’s) words: Plagiarism by university students: Lit-
to differentiated use: A literature review and agenda for research on digital erature and lessons. Assessment and Evaluation in Higher Education, 28(5),
inequality. In S. Russell & F. Neckerman (Eds.), Social inequality (pp. 355– 471–488. doi:10.1080/02602930301677
400). New York: Rusell Sage Foundation. Pecorari, D. & Petrić, B. (2014). Plagiarism in second-language writing. Lan-
Eddy, M. (2013). German Politician Faces Plagiarism Accusations. The New York guage Teaching, 47(3), 269-302. doi:10.1017/S0261444814000056
Times. Retrieved from: http://goo.gl/GTDUju (2018-01-22). Pecorari, D. (2008). Academic writing and plagiarism: A linguistic analysis. Lon-
Eret, E., & Ok, A. (2014). Internet plagiarism in higher education: tendencies, trigger- don: Continuum.
ing factors and reasons among teacher candidates. Assessment & Evaluation Perry, J. (2010, October 27). Plagiarism in China [Web log comment]. Obtenido
in Higher Education, 39(8), 1002-1016. doi:10.1080/02602938.2014.880776 de https://goo.gl/32ENts
Eriksson, E. J. & Sullivan, K. P. (2008). An investigation of the effectiveness of Pickard, J. (2006). Staff and student attitudes to plagiarism at University College
a Swedish glide+ vowel segment for speaker discrimination. International Northampton. Assessment & Evaluation in Higher Education, 31(2), 215-
Journal of Speech, Language & the Law, 15(1). doi:10.1558/ijsll.v15i1.51 232. doi:10.1080/02602930500262528
Flint A., Clegg S. & Macdonald R. (2006). Exploring staff perceptions of student Ravizza, S. M., Hambrick, D. Z., & Fenn, K. M. (2014). Non-academic internet
plagiarism. Journal of Further and Higher Education, 30(2), 145–156. use in the classroom is negatively related to classroom learning regardless
doi:10.1080/03098770600617562 of intellectual ability. Computers and Education, 78, 109–114. doi:10.1016/j.
Fullana, J. (1992). Revisió de la recerca educativa sobre les variables explicatives compedu.2014.05.007
del rendiment acadèmic: Apunt per a l’ús del criteri de “modificabilitat ped- Rinnert, C. & Kobayashi, H. (2005). Borrowing words and ideas: Insight from
agògica” de les variables. Estudi General, 185–200. Retrieved from: http:// Japanese L1 writers. Journal of Asian Pacific Communication, 15(1), 31-56.
goo.gl/ejXqcc doi:10.1075/japc.15.1
Gómez, J., Salazar, I., & Vargas, P. (2013). Dishonest Behavior and Plagiarism by Six Degrés & Sphinx Developpement (2008). Los usos de Internet en la educación
University Students: An Application to Management Studies. Procedia - So- superior: De la documentación al plagio. Retrieved from: https://goo.gl/
cial and Behavioral Sciences, 83, 766-770. doi:10.1016/j.sbspro.2013.06.144 Xeq3zw (2018/01/13).
103Torres-Diaz, J. C.; Duart, J. M. ; Hinojosa-Becerra, M. / Journal of New Approaches in Educational Research 7(2) 2018. 98-104
Roig, M. (2001). Plagiarism and paraphrasing criteria of college and uni-
versity professors. Ethics & Behavior, 11(3), 307-323. doi:10.1207/
S15327019EB1103_8
Scheerder, A., van Deursen, A., & van Dijk, J. (2017). Determinants of Internet
skills, use and outcomes. A systematic review of the second- and third-level
digital divide. Telematics and Informatics. doi:10.1016/j.tele.2017.07.007
Sowden, C. (2005). Plagiarism and the culture of multilingual students in higher
education abroad. ELT Journal, 59(3), 226-233. doi:10.1093/elt/cci042
Sureda-Negre, J., Comas-Forgas, R., & Oliver-Trobat, M. F. (2015). Academic
Plagiarism among Secondary and High School Students: Differences in
Gender and Procrastination. Comunicar, 22(44), 103-110. doi:10.3916/C44-
2015-11
Tichenor, P., Donohue, G., & Olien, C. (1970). Mass media flow and differ-
ential growth in knowledge. Public Opinión Quarterly, 34, 159-170.
doi:10.1086/267786
Tirado-Morueta, R., Mendoza-Zambrano, D. M., Aguaded-Gómez, J. I., &
Marín-Gutiérrez, I. (2017). Empirical study of a sequence of access to
Internet use in Ecuador. Telematics and Informatics, 34(4), 171–183.
doi:10.1016/j.tele.2016.12.012
Torres-Diaz, J. C., Duart, J., Gomez-Alvarado, H.-F., Marín-Gutiérrez, I., & Se-
garra-Faggioni, V. (2016). Usos de Internet y éxito académico en estudi-
antes universitarios. Comunicar, 48(24), 61–70. doi:10.3916/C48-2016-06
UOC. (Ed.). (2003). Internet Catalonia Project. Retrieved from: http://goo.gl/
G3xmXT (2017-12-20).
Van Dijk, J. (2005). The deepening divide: Inequality in the information society.
London: Sage.
Wainer, J., Vieira, P., & Melguizo, T. (2015). The association between having
access to computers and Internet and educational achievement for prima-
ry students in Brazil. Computers and Education, 80, 68–76. doi:10.1016/j.
compedu.2014.08.007
Walker, J. (2010). Measuring plagiarism: Researching what students do,
not what they say they do. Studies in Higher Education, 35(1), 41-59.
doi:10.1080/03075070902912994
Wittwer, J. & Senkbeil, M. (2008). Is students’ computer use at home related to
their mathematical performance at school? Computers & Education, 50(4),
1558–1571. doi:10.1016/j.compedu.2007.03.001
How to cite this article: Torres-Díaz, J. C, Duart, J. M., & Hinojosa-Be-
cerra, M. (2018). Plagiarism, Internet and Academic Success at the
University. Journal of New Approaches in Educational Research, 7(2),
PP. 98-104. doi:10.7821/naer.2018.7.324
104You can also read