Reference values for resting and post exercise hemodynamic parameters in a 6-18 year old population - Nature
←
→
Page content transcription
If your browser does not render page correctly, please read the page content below
www.nature.com/scientificdata

               OPEN           Reference values for resting and
Data Descriptor               post exercise hemodynamic
                              parameters in a 6–18 year old
                              population
                              Katalin Havasi 1,2,4, Zoltán Maróti2,4, Andrea Jakab2, István Raskó2,3, Tibor Kalmár                   2*
                                                                                                                                          &
                              Csaba Bereczki2*

                              This database is the first large dataset of haemodynamic changes of normal-weight pupils during a field
                              exercise test. Here, we present a dataset for anthropometric and hemodynamic parameters measured
                              both during relaxation and after exercise containing 1,173,342 data segments from 65,345 acquisition
                              points of 10,894 normal weight subjects, covering an age range of 6–18 years collected in a course of
                              12 years. Data acquisition was carried out under standardised measuring conditions and specifications.
                              Hemodynamic parameters were measured in the normal-weight population with a new and simple Fit-
                              Test which could facilitate new projects worldwide to study and compare cardiovascular fitness.

                              Background & Summary
                              Despite advances in diagnosis and treatment over the past 30 years, the disability-adjusted life years (DALY)
                              attributable to hypertension have increased worldwide by 40% since 19901–5. Hypertension in children and ado-
                              lescents is becoming a major concern, not only because of its rising prevalence but because almost half of the
                              adults with hypertension had elevated blood pressure values during their childhood4,6,7.
                                  As already established, elevated blood pressure in childhood correlates with carotid intima-media thickness,
                              atherosclerosis, left ventricular hypertrophy, and kidney failure in adulthood8,9. Consequently, early diagno-
                              sis and control of hypertension in childhood are likely to have an important effect on long-term outcomes of
                              hypertension-related cardiovascular complications10.
                                  Underdiagnosis of hypertension in children and adolescents is the consequence of using only (casual) BP
                              values while they are resting in an office environment. When defining high BP, especially in younger age groups,
                              various influences limit the reliability of the in-office BP measurements11–14. On the other hand out-of-office BP
                              might be a more reliable parameter than casual BP, which has a strong association with cardiovascular disease
                              outcome15. Furthermore, exercise BP and cardiopulmonary fitness has a robust, inverse, and independent associ-
                              ation with cardiovascular and overall mortality risk16–18.
                                  Consequently, the predictive power for cardiovascular disease of an exaggerated BP response during exercise
                              suggested being superior to resting BP not only in adult populations but in childhood and adolescents as well17.
                              Cardiopulmonary exercise testing is an essential tool to assess cardiorespiratory fitness (CRF) in children, since
                              exercise hypertension has been suggested to predict future resting hypertension13,19. While these observations
                              highlight the potential clinical utility of exercise BP measurements for diagnostic and prognostic purposes, they
                              have yet to be widely adopted into clinical (and non-clinical) practice given the limitations, such as the lack of
                              standardized methodology and limited empirical evidence across a wide range of populations. Our knowledge
                              of the CRF and its relevance, especially in relation to the whole population, caused by the physical exercise of
                              children and adolescents, is incomplete, with very few publications19–22.
                                  Currently, only a small number of screening methods enable simple determination of cardiorespiratory fit-
                              ness, particularly in children. Most of these methods need a special environment and special conditions22,23.

                              1
                               Csongrád County Health Care Center Hódmezővásárhely-Makó, Csongrád, Hungary. 2Department of Pediatrics,
                              University of Szeged Albert Szent-Györgyi Medical Center Faculty of Medicine, Szeged, Hungary. 3Inst. of Genetics,
                              Biological Research Center, Szeged, Hungary. 4These authors contributed equally: Katalin Havasi and Zoltán Maróti.
                              *email: kalmar.tibor@med.u-szeged.hu; bereczki.csaba@med.u-szeged.hu

  Scientific Data |   (2020) 7:26 | https://doi.org/10.1038/s41597-020-0368-z                                                                 1
www.nature.com/scientificdata/                                                                       www.nature.com/scientificdata

                            Fig. 1 Measurement/Fit-test Protocol. The duration of the whole experiment was approximately 40–45 minutes.
                            Four pulse (P), systolic (SBP) and diastolic blood pressure (DBP) measurements were collected per subject
                            during a single Fit-test.

                                The Distance Running Test (DRT) is a good alternative to ergometer exercise measuring haemodynamics
                            variables during exercise in childhood. Although the accuracy of the CRF definition outside the laboratory is
                            necessarily lower than that of the laboratory measurements, but since haemodynamic parameters significantly
                            correlate with the maximal aerobic speed (MAS) during the ergometer test, and MAS could have been predicted
                            from average speed during DRT, it gives us a simple, standardisable option to test CRF by measures of haemody-
                            namic parameters, pulse and blood pressure.
                                Here, we suggest a field test (Fig. 1). Specifically, a 1000 meter DRT for 1–4 classes (age between 6–10 years)
                            and a 2000 meter DRT (for 5–13 classes age between 10–18 years) which are the best predictors of cardiorespira-
                            tory fitness (CRF) according to latest studies24–26. It is an alternative to laboratory stress tests for screening CRF
                            and calculating the age and gender-specific percentiles associated with it. Such a test, in addition to establishing
                            the reference values also provides an opportunity to gain new insight into the relationship between later manifes-
                            tations of illness and juvenile burden response.
                                In order to achieve this we tested more than 14,000 6–18 years old pupils for 12 years containing repeated
                            measures on the same individuals. Here we provide the registered anthropometric and cardio-metric data (pre-
                            and post-test blood pressure and pulse values) collected during the Fit-test for those with a calculated BMI within
                            the normal range, according to the published WHO guideline26.

                            Methods
                            Participant characteristics. Ethical License: This research was conducted with the permission of the
                            Research Ethics Committee of the University of Szeged.
                                This investigation was conducted as a prospective, multicenter study in 3 Hungarian cities (Hódmezővásárhely,
                            Mártély and Mindszent), in southern Hungary between 2007 and 2018. In order to exclude the possibility of
                            error in the selection of the examined subpopulation, we aimed to accomplish a comprehensive survey of the
                            students of Hódmezővásárhely, which is the most populated of the three cities. Population: 43,700 (2018) mainly
                            Caucasian type, (http://www.ksh.hu/nepszamlalas/tablak_teruleti_06) self-declaration basis, CSO census: in the
                            region, 1.9% Roma population, other races do not occur in larger numbers). Inward and outward migration was
                            negligible in the period under review.
                                The involvement in the anthropological measurements in the school is compulsory for everyone. Participation
                            in physical education is also mandatory for all students except for those who are excluded from physical educa-
                            tion. The additional BP parameter measurements before and after the running-test was optional, but no one opted
                            out, all participants gave consent.

                            Measurement protocol/data collection. The survey was performed at the beginning and at the end of
                            the school year, except for those who were excluded from physical exercise and data was recorded in an IT system.
                            The measurements were obtained during regular Physical Education (PE) classes for children between 8 and 14.

                            Biometric Data. Anthropometric data including weight, height measured by trained data collectors26. In the
                            school-health offices, certified, calibrated, non stretchable, wall-mounted stadiometer height measuring equip-
                            ment was used for measuring pupils‘ heights. Hair styles and hair accessories were removed or undone. The
                            participant were asked to stand in socks against the stadiometer, with heels together, legs straight, arms at sides,
                            and shoulders relaxed, looking straight and were measured standing with heels, buttocks, shoulders and head
                            touching a flat upright surface of the stadiometer. The perpendicular headpiece brought down to touch the crown
                            of the head had enough pressure to compress the hair. The measurer’s eyes were parallel with the headpiece in
                            order to read the measurement to the nearest cm.
                                A certified, calibrated electronic scale with a tare capability was used to measure the weight of the participants.
                            They were weighed wearing lightweight underwear (shoes, hats or bulky items such as coats/jackets and sweaters

Scientific Data |   (2020) 7:26 | https://doi.org/10.1038/s41597-020-0368-z                                                                      2
www.nature.com/scientificdata/ www.nature.com/scientificdata
were removed) standing, without assistance, in the middle of the scale platform. The weight to the nearest 0.1 kg
was noted and was rounded to whole kg. Every year an external company calibrated all the devices used for
measurements.
In the hours before the measurements, the students were not exposed to significant physical exertion. The
students from the nearby schools came to the survey on foot and from remote schools by school buses. The
anthroplogical measurements carried out before the running test by school doctors/nurses in the office indoor
with calibrated instruments. Blood pressure and pulse values were measured with a validated, automatic
OMRON blood pressure monitor, in accordance with the daily practice of school screening and the Hungarian
Hypertension Society (MHT) protocol27. On arrival they sat on chairs and benches for about 5–10 minutes. From
there the nurse called for a measurement. The whole class was surveyed at the same time, with an average of
20–30 students. A nurse group (of 10 to15 nurses) performed blood pressure and heart rate measurements on
the tables alongside the track. Thus, an experienced nurse usually measured the blood pressure of two students
in turn. The students’ blood pressure and heart rate were measured on a chair with a back rest, with her/his arm
placed comfortably, at heart level (SBP 0′, DBP 0′, Pulse 0′).
The running test was concluded as follows: the whole class (except children excluded from excersice) was
tested outdoors. After the initial measurement, before the survey, the PE teacher performed warm-up exer-
cises with the students. During the test, under the supervision of physical educators, everyone had to run 1000
meters/0.62 miles (1–4 classes age between 6–10) or 2000 meters/1.24 miles (5–13 classes age between 10–18)
as fast as possible on the same 400 meter (0.24 miles) long, flat, oval outdoor track. The PE teacher measured
the run time with a manual stopwatch and recorded the result of the run. After completing the distance, the stu-
dent immediately went to one of the nurses sitting at the tables next to the course, who measured her/his blood
pressure (SBP 1′, DBP 1′, Pulse 1′) and transferred her/him to another chair and informed her/him of the time
of the next measurment. The nurse called the student she had previously measured for both the 5-minute and
10-minute measurements (SBP 5′, DBP 5′, Pulse 5′ and SBP 10′, DBP 10′, Pulse 10′), and recorded the data imme-
diately after each measurement. All BP measurements were carried out once in each time point.
Students were excluded from Physical Education: with severe cardiopulmonary, pulmonary or musculoskel-
etal disorders; acute fever patients, acute exacerbation of asthma, very high BP values and/or complaints were
exempt from the exercise. Students with high blood pressure but no complaints and those who were controlled
by medication for asthma bronchiale, hypertension, diabetes mellitus, cystic fibrosis, and mild scoliosis also
participated.
On average 77.27% of the participants completed the running test, while the rest of them were either excluded
from PE class or were absent from the test due to missing class on the day for any other reason.
De-identification. In the process of creating the dataset, all identifiable personal information has been
removed. Each individual thus has only an ID that links her/his measurements at different dates in the database.
Data screening. To ensure high-quality dataset we performed a data integrity screening for the measured
parameters. Since the actual height of an individual could vary (~1–2 cm) even in a course of a day (as physical
activity alters spinal length) and the measured height also depends on how much the subject draws herself/him-
self up at the measurement time. We would expect a natural variation of height data even when the height of the
individual is the same. Furthermore the measured height was rounded to the nearest integer, so it could also cause
1 cm difference in height without having significant difference measured by the stadiometer.
First all individuals were identified with more than 2 cm difference between consecutive height measurements
and presumed that either the higher or the lower value is potentially invalid. Then logarithmic regression was
performed for all combinations with potentially invalid values. According to the adjusted R-square of the different
models the most unfitting values were excluded from the height data of such individuals. Altogether 1249 height
values of 1182 individuals were excluded from the 102642 records.
We tested for obviously invalid haemodynamic parameters not compatible with life (pulse (P), systolic
(SBP) and diastolic blood pressure (DBP)) in our dataset. Pulse: accepted between 40–200 beat/min (rejected:6
records), SBP: accepted between 70–220 Hgmm (rejected:75 records) and DBP: accepted between 30–120 Hgmm
(rejected:46 records).
Running speed: accepted between 0.5–6.0 m/sec (rejected: 212 records).
BMI and WHO z-score calculation. The BMI was calculated by the formula of BMI = weight2 . The WHO
height
z-scores were calculated by the methodology described in28. We used the WHO age and sex normalized LMS
reference tables (https://www.who.int/growthref/who2007_bmi_for_age/en/). The z-score weight categories were
determined according to the rules set by WHO (z-score < −3 - severely thin, −3 < = z-score < −2 - thin,
−2 < = z-score < 1 - normal, 1 < = z-score < 2 - overweight, 2 < = z-score - obese). We also calculated the stand-
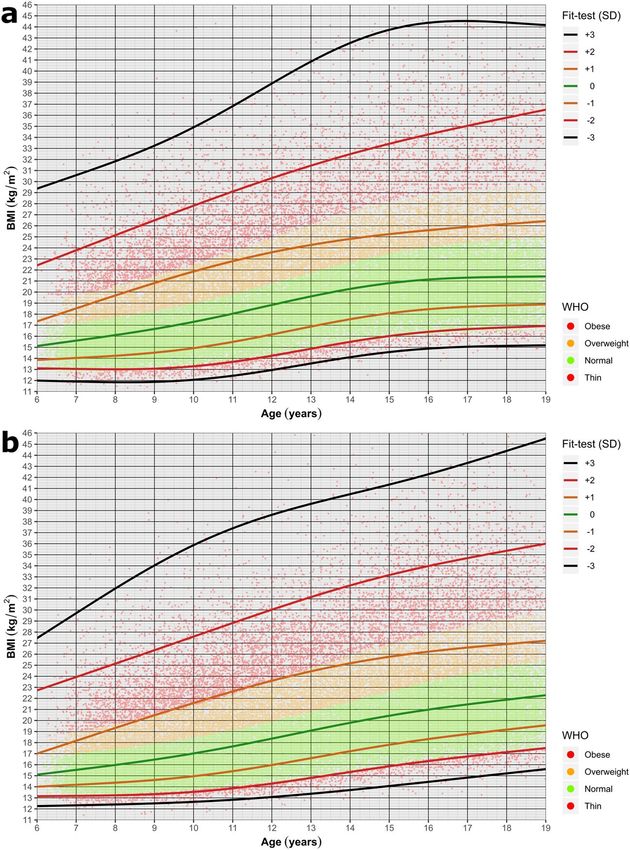
ard deviation (in range of −3 to +3) of experimental BMI values in our dataset for all age and sex categories. To
compare the Hungarian population with the WHO data we visualized our data by colouring the individuals
according to their WHO z-score weight categories and plotting the −3 to +3 standard deviation regression curves
of the experimental BMI values by ggplot2 (Fig. 2).
Generation of normal population hemodynamic dataset. Since obesity and being overweight
influences cardiac parameters we included only the normal-weight subpopulation to generate a representative
exercise-induced cardiac parameter dataset29. The WHO criteria (−2 to +1 SD z-scores) were used to identify
the normal weight population (denoted as green points in Fig. 2). The running speed was calculated using the
running time and distance values of the dataset.
Scientific Data | (2020) 7:26 | https://doi.org/10.1038/s41597-020-0368-z 3www.nature.com/scientificdata/ www.nature.com/scientificdata
Fig. 2 Body Mass Index (BMI) for Age plot. The lines represent SD (+3 to −3) values for BMI calculated for the
whole tested population, for girls (a) and boys (b). Each individual is represented by a dot colour-coded based
on the WHO criteria. Using the WHO criteria (−2 to +1 SD) we identified the normal-weight subpopulation
(denoted as green points).
From this normal subpopulation dataset, we also excluded the outlier measurements of the hemodynamic
(before/after exercise pulse, SBP and DBP) and running speed based on the 1.5 IQR method30.
As the running distance was selected by the class of the participant (1000 m for class 1–4 and 2000 m for class
5–8) and not by their age, we had some measurements of age >10 individuals with a 1000 m running distance and
agewww.nature.com/scientificdata/ www.nature.com/scientificdata
6−10 years girl (1000 m) 6−10 years boy (1000 m) 10−18 years girl (2000 m) 10−18 years boy (2000 m)
160
150
140
pulse (beat min)
130
120
110
100
90
80
70
Pulse 0’ Pulse 1’ Pulse 5’Pulse 10’ Pulse 0’ Pulse 1’ Pulse 5’Pulse 10’ Pulse 0’ Pulse 1’ Pulse 5’Pulse 10’ Pulse 0’ Pulse 1’ Pulse 5’Pulse 10’
6−10 years girl (1000 m) 6−10 years boy (1000 m) 10−18 years girl (2000 m) 10−18 years boy (2000 m)
175
systolic blood pressure (Hgmm)
170
165
160
155
150
145
140
135
130
125
120
115
110
105
100
95
90
SBP 0’ SBP 1’ SBP 5’ SBP 10’ SBP 0’ SBP 1’ SBP 5’ SBP 10’ SBP 0’ SBP 1’ SBP 5’ SBP 10’ SBP 0’ SBP 1’ SBP 5’ SBP 10’
6−10 years girl (1000 m) 6−10 years boy (1000 m) 10−18 years girl (2000 m) 10−18 years boy (2000 m)
diastolic blood pressure (Hgmm)
85
80
75
70
65
60
55
50
DBP 0’ DBP 1’ DBP 5’ DBP 10’ DBP 0’ DBP 1’ DBP 5’ DBP 10’ DBP 0’ DBP 1’ DBP 5’ DBP 10’ DBP 0’ DBP 1’ DBP 5’ DBP 10’
Fig. 3 Pre and post Fit-Test hemodynamic data of the normal-weight subpopulation. Pulse, systolic (SBP)
and diastolic blood pressure (DBP) data organised based on the age groups/running distance (6–10 and 10–18
years) and on the gender.
The calculated gender- and age-specific height, body weight and BMI percentiles (1, 3, 5, 10, 25, 50, 75,
90, 95, 97, 99) and the corresponding number of individuals in this dataset can be found at the XLSX table:
percentiles_anthropometric_all.xlsx.
Exercise induced cardiac parameter dataset. Each data record contains the individual ID (that links
different time series measurement points of the same individual), measurement date, age (in years), age bin
(age category in years), gender, running distance, running speed and the 0′, 1′, 5′ and 10′ pulse, systolic blood
pressure (SBP), diastolic blood pressure (DBP) values collected from normal weight individuals according to the
Fit-test protocol (Fig. 1) This dataset consists of 65345 data points of 10894 individuals (5408 boys and 5486 girls)
and is deposited in the excercise_normal folder as fit_database_exercise_normal.xlsx (and as tsv file as well).
The descriptive statistic (N, mean, SD) of this dataset for the different age and gender categories can be viewed
in the XLSX table: descriptive_ excercise_normal.xlsx.
The calculated gender- and age-specific running speed and cardiac (pulse, systolic and diastolic blood pres-
sures at 0′, 1′, 5′ and 10′ measurement points) for the normal weight Fit-test population can be found at the per-
centiles_runningspeed_exercise_normal.xlsx and the percentiles_cardiac_exercise_normal.xlsx tables.
The number of excluded outliers for each exercise-induced measurement (pulse, SBP, DBP and running speed
are included in the outlier_counts_exercise_normal.xlsx.
Scientific Data | (2020) 7:26 | https://doi.org/10.1038/s41597-020-0368-z 5www.nature.com/scientificdata/ www.nature.com/scientificdata
Technical Validation
Measuring blood pressure. During the 12 years we used three different, ESH validated (https://www.
healthcare.omron.co.jp/english/validation/europe.html) devices for measuring blood pressure (Omron3,
Omron2, and URight TD3128). OMRON M3 blood pressure(BP) monitors are equivalent with the OMRON M6
BP device, which is validated (http://www.dableducational.org/) for children, obese and elderly32–34 and URight
TD3128 Blood Pressure Monitor is also (ESH validation equal to TD3124, CE and FDA validated35.
The appropriate size cuff (small (17.0–22.0 cm), standard (22.0–32.0 cm) or large (32.0–42.0 cm) cuffs of
OMRON devices, and 24–43 cm of TD-3128 devices) to the size of the child’s upper arm was used. If a cuff was
too small, the next largest cuff was used even if it appeared larger than recommended36.
Usage Notes
In the published datasets we provide repeated measurements on the same individuals of various anthropometric
and hemodynamic parameters (102 642 records) of a large (14 267 participants) school-aged (6–18 years of age)
cohort. It is prospective over 8 years (3.44 (SD 2.92) years, and 7.19 (SD 5.21) datapoints of participants).The
anthropometric dataset can be used to analyze age and sex-dependent BMI changes leading to either obesity or
normal body weight to identify risk-groups and proper time of intervention.
Fit-test allowed us to monitor the changes in the cardiovascular parameters before and after the DRT in
normal-weight (age and gender separated) reference children and young adolescent (6–18 years of age) pop-
ulation (Fig. 3). The normal weight cardiac parameter dataset can be used as a standardized reference chart, to
develop complex strategies utilizing exercise-induced parameters to screen for cardiovascular abnormalities.
The datasets are distributed in the normal standard file formats (text, xlsx) and can be read and processed by a
variety of commonly used statistical packages, including SPSS, Matlab, Python, and R.
Received: 24 June 2019; Accepted: 11 December 2019;
Published: xx xx xxxx
References
1. Collaboration, G. B. et al. Worldwide trends in blood pressure from 1975 to 2015: a pooled analysis of 1479 population-based
measurement studies with 19·1 million participants. The Lancet 0, 634–647 (2016).
2. Forouzanfar, M. H. et al. Global Burden of Hypertension and Systolic Blood Pressure of at Least 110 to 115 mm Hg, 1990–2015.
JAMA 317, 165 (2017).
3. Din-Dzietham, R., Liu, Y., Bielo, M.-V. & Shamsa, F. High Blood Pressure Trends in Children and Adolescents in National Surveys,
1963 to 2002. Circulation 116, 1488–1496 (2007).
4. Rosner, B., Cook, N. R., Daniels, S. & Falkner, B. Childhood Blood Pressure Trends and Risk Factors for High Blood Pressure.
Hypertension 62, 247–254 (2013).
5. Ma, M., Tan, X. & Zhu, S. Prehypertension and its optimal indicator among adults in Hubei Province, Central China, 2013–2015.
Clin. Exp. Hypertens. 39, 532–538 (2017).
6. Kelly, R. K. et al. Factors Affecting Tracking of Blood Pressure from Childhood to Adulthood: The Childhood Determinants of Adult
Health Study. J. Pediatr. 167, 1422–1428 (2015).
7. Chen, X. & Wang, Y. Tracking of Blood Pressure From Childhood to Adulthood. Circulation 117, 3171–3180 (2008).
8. Bao, W., Threefoot, S. A., Srinivasan, S. R. & Berenson, G. S. Essential hypertension predicted by tracking of elevated blood pressure
from childhood to adulthood: The Bogalusa heart study*. Am. J. Hypertens. 8, 657–665 (1995).
9. Celermajer, D. S. & Ayer, J. G. J. Childhood risk factors for adult cardiovascular disease and primary prevention in childhood. Heart
(British Cardiac. Society) 92, 1701–1706 (2006).
10. Juhola, J. et al. Combined effects of child and adult elevated blood pressure on subclinical atherosclerosis: The international
childhood cardiovascular cohort consortium. Circulation 128, 217–224 (2013).
11. Koch, V. H. et al. Comparison between casual blood pressure and ambulatory blood pressure monitoring parameters in healthy and
hypertensive adolescents. Blood Press. Monit. 5, 281–9 (2000).
12. Anstey, D. E. et al. Diagnosing Masked Hypertension Using Ambulatory Blood Pressure Monitoring, Home Blood Pressure
Monitoring, or Both? Hypertens. (Dallas, Tex. 1979) 72, 1200–1207 (2018).
13. Williams, B. et al. 2018 ESC/ESH Guidelines for the management of arterial hypertension. Eur. Heart J. 39, 3021–3104 (2018).
14. Cohen, J. B. & Cohen, D. L. Integrating Out-of-Office Blood Pressure in the Diagnosis and Management of Hypertension. Curr
Cardiol Rep. 18, https://doi.org/10.1007/s11886-016-0780-3 (2016).
15. Shimbo, D., Abdalla, M., Falzon, L., Townsend, R. R. & Muntner, P. Role of ambulatory and home blood pressure monitoring in
clinical practice: A narrative review. Annals of Internal Medicine, https://doi.org/10.7326/M15-1270 (2015).
16. Kokkinos, P. Cardiorespiratory Fitness, Exercise, and Blood Pressure. Hypertension 64, 1160–1164 (2014).
17. Hacke, C. & Weisser, B. Reference Values for Exercise Systolic Blood Pressure in 12- to 17-Year-Old Adolescents. Am. J. Hypertens.
29, 747–753 (2016).
18. Mocellin, R. & Rutenfranz, J. Methodische Untersuchungen zur Bestimmung der körperlichen Leistungsfahigkeit (W 170) im
Kindesalter. Zeitschrift für Kinderheilkd. 108, 61–80 (1970).
19. Allison, T. G. et al. Prognostic significance of exercise-induced systemic hypertension in healthy subjects. Am. J. Cardiol. 83,
371–375 (1999).
20. Currie, K. D., Floras, J. S., La Gerche, A. & Goodman, J. M. Exercise Blood Pressure Guidelines: Time to Re-evaluate What is Normal
and Exaggerated? Sport. Med. 48, 1763–1771 (2018).
21. Lurbe, E. et al. European Society of Hypertension guidelines for the management of high blood pressure in children and adolescents.
J. Hypertens. 34, 1887–1920 (2016).
22. Li, A. M. et al. Standard Reference for the Six-Minute-Walk Test in Healthy Children Aged 7 to 16 Years. Am. J. Respir. Crit. Care
Med. 176, 174–180 (2007).
23. Lurbe, E. et al. European Society of Hypertension guidelines for the management of high blood pressure in children and adolescents.
J. Hypertens. 34 1887–1920 (2016).
24. Bellenger, C. R. et al. Predicting maximal aerobic speed through set distance time-trials. Eur. J. Appl. Physiol. 115, 2593–2598 (2015).
25. Mayorga-Vega, D., Bocanegra-Parrilla, R., Ornelas, M. & Viciana, J. Criterion-Related Validity of the Distance- and Time-Based
Walk/Run Field Tests for Estimating Cardiorespiratory Fitness: A Systematic Review and Meta-Analysis. PLoS One 11, e0151671
(2016).
26. WHO Multicentre Growth Reference Study Group. Reliability of anthropometric measurements in the WHO Multicentre Growth
Reference Study. Acta Paediatr. Suppl. 450, 38–46 (2006).
Scientific Data | (2020) 7:26 | https://doi.org/10.1038/s41597-020-0368-z 6www.nature.com/scientificdata/ www.nature.com/scientificdata
27. Magyar Hypertonia Társaság, A hypertoniabetegség felnõttkori és gyermekkori kezelésének szakmai és szervezeti irányelvei. Magyar
Hypertonia Társaság (2011).
28. Cole, T. J. & Green, P. J. Smoothing reference centile curves: The lms method and penalized likelihood. Stat. Med. 11, 1305–1319
(1992).
29. Flynn, J. T. et al. Clinical practice guideline for screening and management of high blood pressure in children and adolescents.
Pediatrics 140 e20171904 (2017).
30. Tukey, J. W. Exploratory data analysis. (Addison-Wesley Pub. Co, 1977).
31. Havasi, K. et al. Data Records. figshare, https://doi.org/10.6084/m9.figshare.9948296 (2019).
32. Takahashi, H., Yokoi, T. & Yoshika, M. Validation of the OMRON HEM-7130 upper arm blood pressure monitor, in oscillometry mode,
for clinic use and self measurement in a general population. (European Society of Hpertension International Protocol 2010).
33. Omron Healthcare Europe BV Comparison of the Omron M2 (HEM-7121-E) with the Omron HEM-7130 (Japanese model) Devices
Omron M2 (HEM-7121-E) Omron HEM-7130 (Japanese model). (dabl Educational Trust Device Equivalence Evaluation Form
2013).
34. Asmar, R., Khabouth, J., Topouchian, J., El Feghali, R. & Mattar, J. Validation of three automatic devices for self-measurement of
blood pressure according to the International Protocol: The Omron M3 Intellisense (HEM-7051-E), the Omron M2 Compact (HEM
7102-E), and the Omron R3-I Plus (HEM 6022-E). Blood Press. Monit. 15, 49–54 (2010).
35. Dauyuan, D. Validation of the Taidoc U-Right TD-3124 upper arm blood pressure monitor, for self measurement. (European Society of
Hypertension International Protocol 2013).
36. de Onis, M. & Lobstein, T. Defining obesity risk status in the general childhood population: Which cut-offs should we use? Int. J.
Pediatr. Obes. 5, 458–460 (2010).
Acknowledgements
We would like to express our great appreciation for their help to: Márta Katona, MD, Professor of Cardiology,
Department of Pediatrics, András Varró, MD, Professor of Medicine, Director of Pharmacology and
Pharmacotherapy Institute, István Baczkó MD, University of Szeged, Albert Szent-Györgyi Medical Center
Faculty of Medicine, Szeged, HUNGARY. László Balogh PhD, Director of Physical Education and Sport
Science Institute, University of Szeged, and Miklós Tóth, MD, Professor of Health Science and Sport Medicine
Department of University of Physical Education, Budapest. We would like to offer our special thanks to Tamás
Gaizer and Ákos Moravcsik for IT system, Institute Régens Plc. Our special thanks are extended to the local
government of Hódmezővásárhely (János Lázár major, the staff of the municipal office, school health service, PE
teachers of Hódmezővásárhely) and all students and their parents for their valuable support. The Fit-test project
was funded by the Hungarian Government and the European Union. “Fit-Test: Developing an interdisciplinary
methodology for national and international use for analyzing and demonstrating the impact of physical activity,
cardiovascular and public health in school-age populations” GOP-1.1.1-11-2011-0081 (to CSB).
Author contributions
K.H. providing substantial contributions to conception and design, analysed and interpreted of the study results,
and wrote the paper. Z.M. analysed and interpreted results, including the key messages and conclusions wrote the
paper and made the revision. T.K. analysed and interpreted results, including the key messages and conclusions
wrote the paper and made the revision. A.J. analysed and interpreted results, including the key messages and
conclusions and wrote the paper. I.R. providing substantial contributions to the conception and design, and
writing the paper. C.S.B. providing substantial contributions to conception and design, acquisition of data, and
wrote the paper.
Competing interests
The authors declare no competing interests.
Additional information
Correspondence and requests for materials should be addressed to T.K. or C.B.
Reprints and permissions information is available at www.nature.com/reprints.
Publisher’s note Springer Nature remains neutral with regard to jurisdictional claims in published maps and
institutional affiliations.
Open Access This article is licensed under a Creative Commons Attribution 4.0 International
License, which permits use, sharing, adaptation, distribution and reproduction in any medium or
format, as long as you give appropriate credit to the original author(s) and the source, provide a link to the Cre-
ative Commons license, and indicate if changes were made. The images or other third party material in this
article are included in the article’s Creative Commons license, unless indicated otherwise in a credit line to the
material. If material is not included in the article’s Creative Commons license and your intended use is not per-
mitted by statutory regulation or exceeds the permitted use, you will need to obtain permission directly from the
copyright holder. To view a copy of this license, visit http://creativecommons.org/licenses/by/4.0/.
The Creative Commons Public Domain Dedication waiver http://creativecommons.org/publicdomain/zero/1.0/
applies to the metadata files associated with this article.
© The Author(s) 2020
Scientific Data | (2020) 7:26 | https://doi.org/10.1038/s41597-020-0368-z 7You can also read