PIV-load determination in aircraft propellers D. Ragni, B.W. van Oudheusden and F. Scarano
←
→
Page content transcription
If your browser does not render page correctly, please read the page content below
16th Int Symp on Applications of Laser Techniques to Fluid Mechanics
                                                                                Lisbon, Portugal, 09-12 July, 2012

                      PIV-load determination in aircraft propellers

                    D. Ragni, B.W. van Oudheusden and F. Scarano
       Department of Aerodynamics Wind-Energy and Propulsion (AWEP), TUDelft, Delft, The Netherlands

Abstract    Stereoscopic particle image velocimetry (SPIV) has been used to measure the
three-dimensional velocity field around a 1/10 scale, two-bladed, Beaver DHC aircraft propeller
model operating at tip Mach numbers of 0.73 and 0.78. Measurements are acquired at several radial
locations in phase-locked mode, encompassing the blade length; specific data post-processing is
aimed at determining the aerodynamic forces, namely the sectional thrust and torque at each
cross-section. The evaluation of the pressure field is based on the integration of the Navier-Stokes
equations with the experimental velocity fields expressed in a frame moving with the propeller
blade. The approach returns the evaluation of the three-dimensional pressure field, in particular over
the blade surface, considerably simplifying the flow visualization and analysis in raising propeller
studies. The velocity and pressure data are further integrated by means of a contour-approach to
yield the propeller thrust and torque, and compared to data directly derived from a multi-component
balance and from the engine power consumption.

1. Introduction

In view of the increase in fuel costs and of the needed reduction of atmospheric emissions, modern
aeronautics is reconsidering the use of propellers in future airliners [1], [2]. Future aircraft
technology concentrates on research devoted to combine highly swept blades with the most
advanced contra-rotating propellers, which have already demonstrated to provide increases of 6-8%
in efficiency compared to single rotors [3], Error! Reference source not found.]. To be
competitive with cruise Mach numbers of commercial aviation, the aircraft propellers have to
operate at high advance ratios, therefore with outbreak of compressibility effects such as
shock-waves on the blade surface [1]. In this regime, key components of the design constraints
become the blade noise and loading prediction, to ensure comfort and integrity of the passengers
and of the entire aircraft [4]. The most relevant loading components are the aerodynamic and
centrifugal forces acting on the blade, which are typically unsteady and three-dimensional.
Numerical simulations addressed the propeller loading and its interaction with the aircraft frame
from different directions. Interactions between the propeller slipstream and the aircraft wing were
modeled by the actuator disk approach, where the propeller flow is replaced by its outflow
characteristics [5], reducing the complexity in combining rotating and stationary models. In
particular, this approach allows separately refining the wing and the blade flow characteristics, by
use of different methods such as reformulations of the finite wing and lifting line theories (see the
small disturbance equations in the transonic regime by Ref. Error! Reference source not found.],
[6]).
With the advances of computational fluidynamics, new codes such as the CANARI [7], [8] or the
DLR-TAU [9] have been released to combine rotating geometries and stationary ones, with the
intent of simulating both the load acting on the blade and to visualize the flow interaction between
the propeller and the aircraft frame. The cost of computations usually increases considerably in
rotors with high aspect ratio blades (e.g. in helicopters or hybrid prop-rotors), due to the structural
deformation caused by the airflow which requires combined fluidynamic/structural calculations (a
comprehensive review was compiled by Ref. [10]). Despite the rapid growth of methodologies able
to cope with three-dimensional phenomena, complex configurations with high deformations,
rotor-to-rotor interactions, or compressible effects still determine a challenge for the correct

                                                   -1-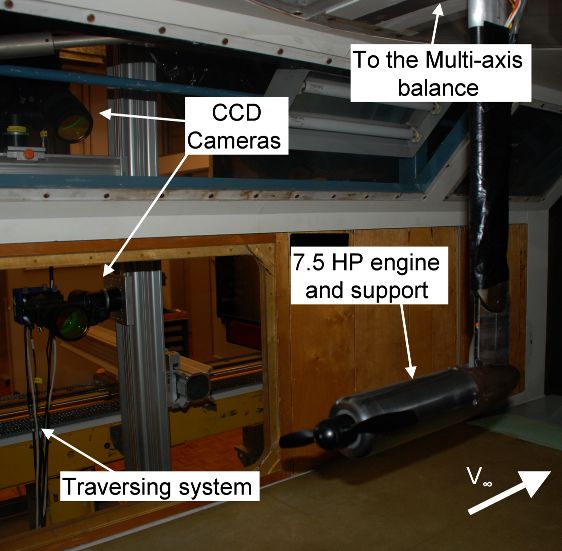
16th Int Symp on Applications of Laser Techniques to Fluid Mechanics
Lisbon, Portugal, 09-12 July, 2012
prediction of the flow field [7].
The strong three-dimensionality of the rotating flow, partially explains the limited availability of
experimental studies. In the last decade, the reconsideration of propellers as propulsive devices
promoted new experimental studies focusing in the wake of the propeller rotor. In particular, several
applications have dealt with both forward-thrust and thrust-reverse conditions [12], in both
propeller-wing interactions [12], and wake investigations in free-axial flight [13]. In the previous
applications, the use of nonintrusive techniques such as particle image velocimetry (PIV) or laser
Doppler anemometry (LDA) have been proven the most suitable to measure the flow with
instantaneous, average or phase-averaged data, and a low degree of flow interference. In addition,
advances in the post-processing of the velocity fields through the Navier-Stokes equations
encouraged the coupling of velocity with loads information in both propellers [14] and airfoil
applications [15].
In the present study, through a modified version of the pressure and load reconstruction from
stereoscopic PIV velocity fields [16], the thrust and torque of a scaled model of a DHC Beaver
propeller are evaluated and further compared to multi-axis balance data. In what follows, the PIV
results are used to investigate the blade performance, giving complementary information to the
balance data. The experimental study shows a typical application in a single-rotor propeller, aiming
at being eventually applied in modern complex configurations such as contra-rotating devices and
prop-rotors. Results are presented for two regimes at a blade-tip relative Mach number of 0.73-0.78,
for both PIV and multi-component balance data.
2. Experimental procedures
2.1 Propeller model and wind-tunnel
Experiments are performed using a 1/10 scale steel model of a two-bladed Beaver DHC aircraft
propeller in the low-turbulence close-circuit tunnel (LTT) of the TUDelft; facility having a
cross-section of 1.8 m width and 1.2 m height, able to operate up to 120 m/s at ambient pressure
(101.3 kPa).
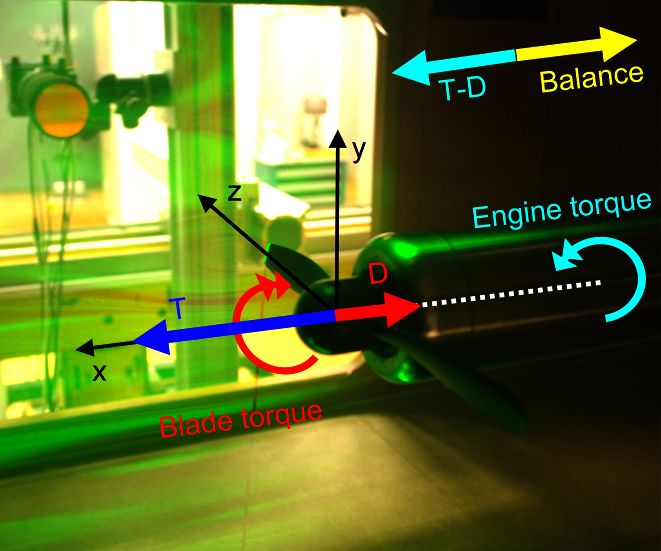
a) b)
Fig. 1 a) Details of the experimental setup; b) scheme of the forces acting on the rotor
The single rotor has been installed in the center of the test-section through a supporting sting
connected to a six-axis multi-component balance, from which the total thrust of the propeller has
been measured. Embedded in the propeller cowling, a 5.5 kW (7.5 HP) electric engine provided the
-2-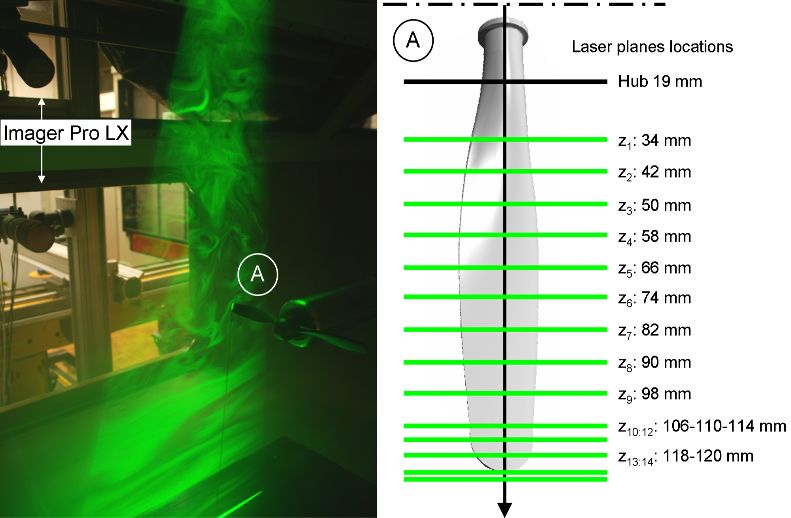
16th Int Symp on Applications of Laser Techniques to Fluid Mechanics
                                                                                       Lisbon, Portugal, 09-12 July, 2012

power input to sustain the rotor motion. The original scaling ensured that the combination of the
propeller sting and of the propeller disk corresponded to an area ratio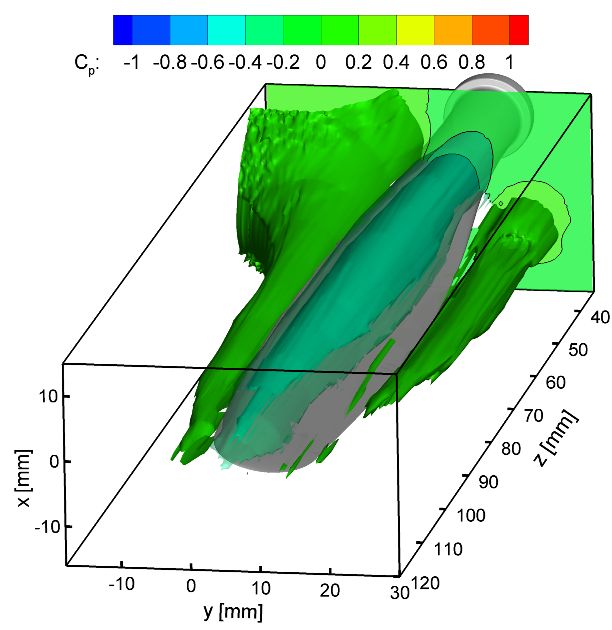
16th Int Symp on Applications of Laser Techniques to Fluid Mechanics
                                                                             Lisbon, Portugal, 09-12 July, 2012

2.3 PIV measurement apparatus

A stereoscopic PIV system has been configured to measure the velocity fields across several planes
perpendicular to the propeller blade axis. Two independent high-precision traversing systems have
been used for the laser and cameras displacement, providing the alignment of the measurement
planes perpendicular to the blade axis, and ensuring the same imaging conditions while traversing
the measurement plane along the radius. Tracer particles with 1 µm median diameter are produced
from a SAFEX Inside Nebelfluide mixture of dyethelene-glycol and water, through a SAFEX Twin
Fog generator. The seeding tracers are introduced downstream the wind-tunnel test-section, to
ensure a uniform concentration while recirculating in the wind-tunnel. Laser light is provided by a
Quantel CFR200 Nd-Yag laser with 200 mJ/pulse energy, illuminating the field of view through
laser optics forming a laser sheet of 2 mm thickness (about 20 cm wide). Two LaVision Imager Pro
LX cameras with 4872 × 3248 pixels (10 bit) equipped with Nikon objectives of 180 mm focal
length at f # 5.6-8 have been used with the LaVision Davis 7.4 software for acquisition and
post-processing. Camera-lens tilt adapters are used to comply with the Scheimpflug condition in
order to align the measurement plane and the focal plane. Sets of 150 image pairs have been
recorded phase-locked at a frequency of 2.5 Hz and a variable amount of 80-120 images per set is
selected for processing (section B III). The recordings are evaluated with a window deformation
iterative multi-grid [18] with window-size down to 12 × 12 pixels at 50% overlap (0.32 mm vector
pitch), and subsequently averaged. Fig. 2 presents a schematic of the setup, together with a
summary of the PIV parameters in Table 2.

            Imaging parameters                                 PIV parameters
  Cameras              2 Imager Pro LX     Software                         LaVision Davis 7.4
                    2
  Sensor format [px ]    4872 × 3248       Imaging resolution [px/mm]              38
  Pixel Pitch [µm]           7.40          Window-size [px2]                     12 × 12
  Focal length [mm]          180           Spatial resolution [vectors/mm]          3
  Magnification              0.28          Pulse separation [µs]                   10
  FOV [cm2]                ~13 × 9         Free-stream shift [px]                  15
  Frequency [Hz]           1.5-2.5         Recordings                            80-100
                 Fig. 2, Table 2 Stereoscopic PIV setup and details of the apparatus
The traversing of the multiple measurement planes is ensured in the span-wise direction of the blade
with an overall accuracy of 0.05 mm relative to a ± 2 mm laser sheet overall movement. A
200-pulse per revolution (PPR) encoder remotely controls the frequency of the propeller blade,

                                                -4-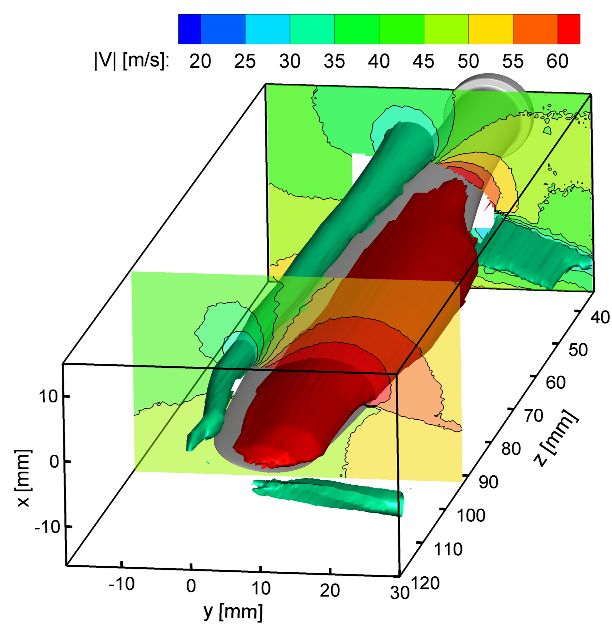
16th Int Symp on Applications of Laser Techniques to Fluid Mechanics
                                                                              Lisbon, Portugal, 09-12 July, 2012

maintaining it constant within ± 0.3 Hz from the prescribed regime (less than 0.1% at 330 Hz). A
second 1-PPR encoder synchronizes the PIV measurement acquisition to keep the blade
perpendicular to the laser sheet, with an uncertainty corresponding to a negligible blade position
jitter the range of 300÷380 Hz.
3. Uncertainty analysis

3.1 Balance thrust and engine torque

The uncertainties associated with the forces measured by the balance have been reported by Ref.
[19] and confirmed by a further calibration by Ref. [20] to be within the range of Table 3. The
balance has been originally designed with a finer accuracy in the x direction, compared to the
vertical one, usually meant to measure the model lift.
               Balance component Force range [N] Uncertainty in the range [N]
                 Fx (horizontal)       0-50                 0.002
                  Fy (vertical)       0-500                 0.005
                   Fz (lateral)       0-100                  0.01
            Table 3 Uncertainty associated with the single forces measured by the balance
The previous values give information on the single force component readout; information on the
random error associated with the thrust measurement can be estimated from the standard deviation
of the force values derived from multiple acquisitions. For this purpose, 250 uncorrelated
measurement values are acquired at an average repetition rate of 1 Hz, and the standard deviation
computed. An attempt of estimation of the velocity increase determined by the slipstream
development conveys an extra drag of 0.6 N, which is reported and used for the force comparison in
section 5.3.

3.2 PIV velocity, pressure and forces uncertainty

Starting from the velocity fields acquired phase-locked with the propeller motion, the random
uncertainties components include the cross-correlation uncertainty, the velocity fluctuations with
respect to the mean and the phase unsteadiness resulting from the jitter in the timing systems. In the
present stereoscopic experiments, a disparity correction procedure is adopted [23], which allows
refining the original target calibration by correlation of the particle images from the two cameras.
The residual average misalignment in the measurement planes is kept within 0.02 px and it is
assumed in the present experiment as a quantification of the registration error. The interrogation
uncertainty results from the cross-correlation analysis is in the range of 0.05-0.1 px [22], with
cross-correlation by multi-pass algorithm starting with a window-size of 32 × 32 pixels. The
previous value, in low turbulence flows, is relatively invariant with the window-size and it
corresponds to 0.35 m/s, or 0.8 % of the incoming wind-tunnel free-stream of 43 m/s. Typical
measured fluctuations in the free-stream value amount in the measured plane to σ = 0.5 ± 0.06 m/s,
reaching values of σ = 8.2 ± 3.9 m/s in the inner part of the propeller wake. Because of the higher
operating regime compared to a previous investigation seen in [16], the 200-pulse per revolution
(PPR) signal could not precisely follow all the blade cycles at 380 Hz, determining some corrupted
images. A reduced amount of recordings (N = 80-120) was therefore used to evaluate the statistics
and to assess the uncertainty on the mean velocity values due to random components to 0.07 m/s of
the free-stream velocity in the steady regions and to 0.92 m/s in the turbulent ones.
   The most relevant systematic sources of uncertainties in the present investigation are associated
with the spatial resolution and the peak-locking of the velocity fields. Aero-optical aberrations and

                                                 -5-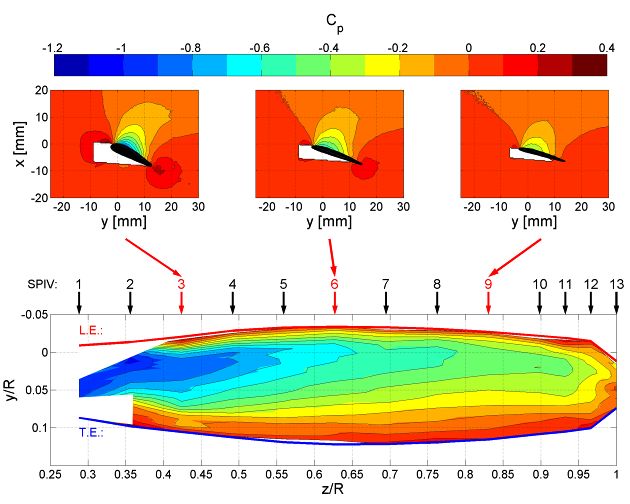
16th Int Symp on Applications of Laser Techniques to Fluid Mechanics
                                                                               Lisbon, Portugal, 09-12 July, 2012

particle tracers relaxation effects [24], [25] have a relatively lower impact than in what encountered
by the authors in the transonic airfoil study Error! Reference source not found.]; mainly due to
the weaker acceleration field (smaller effective incidence angles), combined with the lower
relaxation time of the SAFEX fog (order of 1 µs).
   The uncertainty given by the finite spatial resolution depends on the measurement location and
on the ratio between the typical size λ [mm] of the structure to be resolved and the PIV interrogation
window-size ws [mm]. The vortical flow structures identified in the Karman shedding visible in the
instantaneous measurements show a distribution with frequency of the order of 20 kHz, displacing
vortices of 0.3-0.7 mm, creating a mean wake profile > 2 mm thickness in the field. In order to
judge upon the resolution error in the minimum wake profile, the normalized window-size ws/λ of
0.15 is computed, corresponding to a velocity error of < 0.9 m/s as shown by Ref. 41. The error due
to peak-locking is evaluated from the histograms of particle image displacement expressed in pixel
units. The integral of the approximation error quantifies the peak-locking velocity error to 0.04 px
corresponding to a velocity of 0.15 m/s. The uncertainty on the computed pressure is related to the
error on the relative velocity, εVr/Vr, through a propagation parameter κ, which depends on the local
flow quantities, as discussed in Ref. [16]. In the vortical region, the pressure is integrated from the
three-dimensional momentum equation by a Poisson algorithm with a second order differentiation
of the pressure, already used in Ref. [16].
       Technique         Baseline           Uncertainty           εi / N [SI]   ε / N [SI]
Multi-component balance,                       Thrust                   [-]    0.09-0.15 N *
                          Loads
      engine power                             Torque                   [-]    0.25-0.35 N *
                                      Correlation fluctuations
                                                                    0.93 m/s
                                      Statistical fluctuations
                             Velocity                                             1.27 m/s
                                        Spatial resolution         ≤ 0.90 m/s
           PIV                             Peak locking             0.11 m/s
                             Pressure  Pressure coefficient           0.007        0.007
                                        Thrust and torque          0.1-0.5 N
                              Loads                                              0.2-0.9 N
                                        Force localization     0.5 mm, 0.05 mm
          Table 4 Summary of the experimental uncertainties on the velocity mean values
Investigation of the pressure solver contribution has been found to keep the uncertainty on the Cp of
the same order as the one in the isentropic formulation. The sectional loads possess an uncertain in
their localization z along the blade, and in their values. An overall misalignment εz in the z/R plane
is assumed together with an uncertainty on the plane spacing εdz as indication of the sectional forces
localization. In the present study εz is defined by the position of the laser sheet Gaussian profile,
with a relative uncertainty of 0.5 mm in R = 118 mm, while εdz is driven by the micro-metric bench
actuator with 1/20 mm inaccuracy for dz = 2-8 mm. Finally the uncertainty on the force values
depends upon the combination of the previous sources of inaccuracy in the contour-approach. As a
quantification of the sectional forces computation, the standard deviation resulting from choosing
different surface-boundary contours in the load integration is assumed. Results are shown as error
bars on the computed values in the results section, while in Table 4 a summary of the most relevant
sources of uncertainties is reported.

4. PIV data post-processing

4.1 Pressure evaluation in the moving frame

                                                  -6-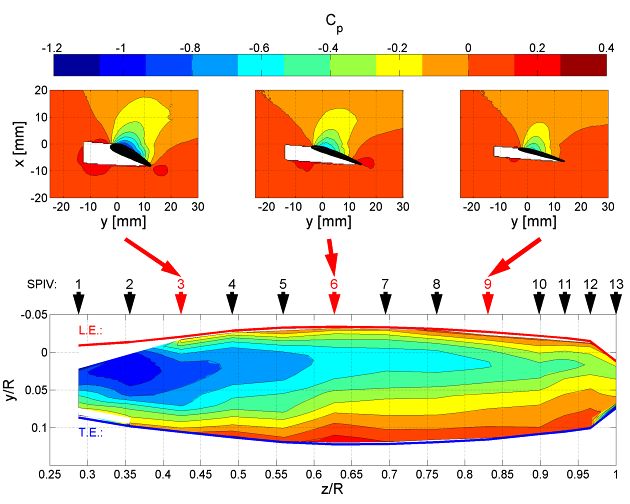
16th Int Symp on Applications of Laser Techniques to Fluid Mechanics
                                                                                                     Lisbon, Portugal, 09-12 July, 2012

   The momentum equation is evaluated in a frame of reference that moves with the blade [16]. The
flow is assumed to be adiabatic in the moving frame and the stagnation flow properties such as the
total pressure, temperature, and density can be computed by adding the contribution of the relative
object motion. In the region around the airfoil exception made for the wake, the flow behavior is
also considered as inviscid, which allows to use the isentropic relations [26] to directly evaluate the
pressure coefficient Cp from the local relative velocity Vr [m/s] and the local Mach number Mr:

                                                          γ / ( γ −1 )
             2       ⎧⎪ ⎡ (γ − 1)        ⎛ V2      ⎞⎤                       ⎫⎪
      Cp =            ⎨ ⎢1 +      M r∞ 2 ⎜1 − r2   ⎟⎥                    − 1⎬                                              (3)
           γ M r2∞    ⎪⎩ ⎢⎣  2           ⎝ Vr∞     ⎠ ⎥⎦                      ⎪⎭

where M is the absolute Mach number, γ is the heat capacity ratio of air, ∞ refers to the free-stream
quantities and r to those evaluated in the moving frame. In the wake, the isentropic relation is not
valid and the pressure can be computed with the Euler equations [15]. Due to the quasi-steady
nature of the flow in the moving frame of reference, the measurement planes have been
phase-locked with the blade motion, and the pressure gradient can be formulated as:

      ∇p                   1
         = ∇ ln ( p ) = −      ⎡Vr ⋅∇Vr + 2ω × r + ω × (ω × r )⎤⎦ + ∇τ                                                     (4)
       p                  RaTg ⎣

   As visible from Eq. (2), the pressure gradient is function of the flow and angular velocities, of
the specific air gas constant Ra [J kg-1 K-1] (for dry air assumed to be 287 J kg-1 K-1) and of the
static temperature Tg [K], which is derived by the adiabatic assumption in the quasi-steady moving
frame as Ref. [16]. The pressure distribution is obtained by rewriting Eq. (4) in the Poisson form
integrated in 3D by a second-order finite-difference scheme, imposing Dirichlet isentropic
conditions on the outer boundary of the volume (free-stream), and Neumann boundary conditions
on the other volume surfaces. Viscous and Reynolds turbulent stresses have been included in the
formulation, even though from the data evaluation, their contribution is found to be negligible for
thrust and torque computation, confirming the results in previous airfoil studies [15].

4.2 Force determination by momentum integral

The aerodynamic force acting on a body immersed in a fluid is the resultant of the surface pressure
p [Pa] and shear stress distributions τ [Pa] [26]. As a reaction to the force exerted, the flow field is
modified from its free-stream conditions by the object presence. By a momentum-integral approach
the force components acting on the body can be computed from the flow reaction by application of
the integral momentum conservation in a volume V [m3] of surface S [m2] around the body, without
the need to evaluate the flow velocities at the surface Sblade [m2]of the body itself.
The horizontal and vertical sectional force components F'x [N], F'y [N] obtained by
decomposition of the sectional resultant R' [N] in the Cartesian x–y–z frame, are then computed
from the following expressions:

           ⎡N ⎤
           ⎣m⎦    S − Sblade
                               (       )
                                        V
                                             ⎣               (
      Fi ' ⎢ ⎥ = − ∫∫ ρ ui V r ⋅ ds i − ∫∫ ρ ⎡ω × ω × r + 2 ω × V r ⎤ dV −
                                                                    ⎦ i
                                                                           )
                                                                           d
                                                                           dz S −∫∫
                                                                                 Sblade
                                                                                        ρ ui wR dxdy − ∫∫ p − τ dsi
                                                                                                      S − Sblade (5)
                                                                                                                    ( )
where i characterizes the required direction and r the relative velocities components. The convective
and pressure terms are the main contributors to the integral, while the stress contribution τ,

                                                                                  -7-
16th Int Symp on Applications of Laser Techniques to Fluid Mechanics
Lisbon, Portugal, 09-12 July, 2012
incorporating both viscous and turbulence effects have been included in the present investigation
notwithstanding their relatively low impact.
5. Results and data analysis
5.1 3D Flow visualization
The fourteen stereoscopic fields are merged into a three-dimensional volume extending over 85% of
the entire blade-span. Phase-locking the measurements with the propeller motion allows imaging
the blade at a fixed phase of the revolution, set perpendicular to the blade passage.
a) b)
Fig 3 3D visualization of absolute velocity (a) and pressure coefficient (b) derived from PIV
The resulting three-dimensional visualization is presented in Fig. 3, where the rotational x-axis of
the propeller is vertically drawn, coherently with the aerodynamic convention maintaining the
relative free-stream coming from the left of the blade profile. Fig. 3-a shows absolute velocity
contours as derived from the stereoscopic PIV at 330 Hz, in the investigated volume of
12.8 × 8.5 × 8.6 cm3 (14 x-y planes with variable 2-8 mm spacing). The flow field around the blade
resembles that of a finite wing moving with rotational motion under the free-stream velocity
directed along -x, as can be seen from Fig. 3-a. The combination of the free-stream and the blade
motion velocity VT [m/s] determines a deceleration region close to the blade leading edge and a
consequent acceleration region on the blade surface. The presence of the root and trailing vortices is
identified in the recovering of the pressure coefficient at the hub and at the tip of the blade, as
visible in the velocity contours of Fig. 3-a. The pressure coefficient contours in Fig. 3-b, derived
from the PIV data, confirm the velocity distribution localizing the suction region on the propeller
surface.
The propeller blade is mounted in the propeller hub at an angle β(3/4 R) = 15º with respect to the z-y
plane. Consequently, with the present wind-tunnel free-stream velocity of 43.0 m/s and the
rotational frequency of 19,800 rpm (330 Hz), the aerodynamic angle of attack at three quarters
radius α(r/R = 75%) results of < 1.5º. This causes the highest flow pressure coefficient to be
relatively contained around Cp = -1.1 and located at about 10% from the blade leading edge, as the
corresponding pressure coefficient contours shows in Fig. 3-b.
-8-16th Int Symp on Applications of Laser Techniques to Fluid Mechanics
Lisbon, Portugal, 09-12 July, 2012
5.2 Surface pressure coefficient
The surface pressure coefficient can be computed from extension of the pressure integration to the
blade surface. In a typical PIV stereoscopic configuration, imaging of both the upstream and
downstream entire blade surfaces is a difficult task, due to perspective effects and reflections.
However, in airfoil and finite wing flows at a relatively low Mach number, high accelerations and
heavy separation are primarily affecting one of the surfaces, and the stereoscopic configuration can
be adapted accordingly. In the present experiments, has been limited to the upper surface, exposed
to the wind-tunnel free-stream. The extraction of the pressure coefficient follows Ref. [25], across
lines normal to the blade profile surface, over the entire blade surface. The obtained surface
pressure distributions for the two investigated regime at 19,800 rpm and 22,800 rpm are presented
in Fig. 4, together with the planar pressure field at three locations along the blade radius. In both
investigated regimes, as can be noted from contours in Fig. 4, most of the blade is actually
contributing to the thrust determination. The pressure difference gradually vanishes at the blade-tip
due to the trailing vortex effect, while at the blade-root the combined effect of shadowing and
reflections make the root vortex effect not clearly visible. The suction maxima are localized mainly
in the first half of the blade, in particular up to z/R = 0.5 for 19,800 rpm and up to z/R = 0.5 for
22,800 rpm. In the fastest regime, the pressure coefficient reaches maxima of the order of -1.2
compared to the -0.9 encountered in the slower one.
a) b)
Fig. 4 PIV Surface pressure distribution on the upper-side of the blade, (a) 330 Hz and (b)
380 Hz
The pressure distribution for the faster regime presents higher values in the first ¾ of the blade
surface, being the remaining part similar to the slower one, showing few differences on the inboard
profiles. The main differences between the two distributions are localized in the first half of the
blade surface, where the faster revolution regime shows a local increase in the pressure coefficients.
On the outer part of the blade, the minima of the pressure coefficient differ of 0.2 at 380 Hz
compared to the slower frequency.
5.3 Propeller performance analysis
To further characterize the propeller performances, the information obtained through the PIV data is
combined and later compared with the one acquired from the multi-component and engine balances.
The propeller thrust and torque are obtained integrating the present distribution assuming the
second blade in symmetrical measurement conditions (two-bladed propeller) and presented in
Fig. 5. The force distribution along the radius is derived in Fig. 5 for the two investigated regimes
-9-16th Int Symp on Applications of Laser Techniques to Fluid Mechanics
Lisbon, Portugal, 09-12 July, 2012
as in Ref. [16]. Integration of the distribution along the blade radius gives the blade thrust and
torque, which in symmetrical conditions can be multiplied by the number of blades and be
compared to the balance values (Table 5).
a) b)
Fig. 5 a) Radial distribution of the local thrust [N/m] integrated in blade thrust [N] in the
legend; b) radial distribution of blade resistance [N/m] integrated in blade torque MR [Nm]
The PIV based methodology determines a cross-sectional thrust in Fig. 6-a bounded within
z/R = 0.2÷1, decreasing down towards the blade root/tip. Coherently with the realization of the
Beaver DHC blade, originally designed with a circular connection between the blade and the hub,
the blade thrust vanishes at z/R = 0.2, before reaching the hub, showing that the profiles at higher
angles of attack are contributing the most to the aerodynamic drag (cfr. Fig. 5-b). With a similar
behavior at the blade-tip, the thrust is brought to zero again by the presence of the trailing vortex,
balancing the pressure difference across the upper and the lower blade surfaces. The two thrust
distributions develop slightly skewed towards the location r/R = 0.8, showing a coherent increase in
the loading with the increase in performances from 330 Hz to 380 Hz. In comparison, the blade
resistance is relatively small and therefore difficult to measure accurately. The integrated blade
values are directly compared in Table 5 with those from the multi-component balance.
Propeller performances comparison
Thrust [N] Torque[Nm]
Regimes [Hz] 330 380 330 380
Multi-component balance (corrected) 15.9±0.54 27.88±0.94 [-] [-]
PIV load determination 16.6±0.38 28.18±1.86 0.14±0.06 0.20±0.14
Table 5 Load comparison from the multi-component balance, from PIV and from numerical data
The thrust estimated from PIV measurement shows a mismatch of 5% and 2% in the two regimes,
slightly higher than what expected from the uncertainty of the measurement. Possible reasons are
other sources of drag not accounted for in the correction, or a small asymmetry in the second blade
that is not accounted in the PIV load determination. The torque has been reported to be almost two
orders of magnitudes lower than the thrust, which partially explains the discrepancy between the
measurements. Both of the techniques prefigure a doubling of the force in passing from 330 Hz to
380 Hz, and values within 0.5 N of the order of the corrections to be applied on the thrust.
6. Conclusions
- 10 -16th Int Symp on Applications of Laser Techniques to Fluid Mechanics
Lisbon, Portugal, 09-12 July, 2012
The use of stereoscopic PIV to investigate the performances of a two-bladed propeller has been
demonstrated by evaluation of the aerodynamic forces and additionally of the blade surface pressure
distribution. The propeller has been operated at two rotational frequencies in the transonic regimes,
and the exerted thrust force has been monitored through a multi-component balance. The PIV-based
technique provides useful additional information to the multi-component balance. In particular, it
was possible to infer the surface pressure distribution and the sectional loads variation along the
radius. This capability will be relevant to the study of cases where the installation of pressure
transducers on the blade is not feasible or economically convenient. The measurements are
conducted in phase-locked mode, simplifying the pressure computation by considering the system
stationary with respect to the periodical blade motion. The measured velocity data have been
reduced into pressure through integration of the momentum equation. Further spatial integration of
the velocity and pressure data by a momentum-integral approach allowed determining the load
distribution on the entire propeller blade. A quantitative analysis of the pressure fields along the
blade radius showed that the blade sectional profiles become less tractive as the measurement plane
moves to the blade edges, respectively due to the presence of the root and tip vortices. In particular,
the blade shape has been generated so to minimize the strength of the trailing vortex, as the blade
torque graph shows with its consistent decrease towards the tip. The sectional PIV computed thrust
shows that the thrust distribution is not symmetrical along the blade, but maintaining a skewed
profile with its maximum at about r/R = 0.70. The blade total thrust is of the order of 8 and 11 N
favorably comparable to the momentum corrected data. In the present investigation, the
experimental sectional resistance, due to the more localized extension of the blade wake and to its
lower impact has been found in the limit of uncertainties.
References
[1] Farassat, F., Dunn, M. H., Tinetti, A. F., and Nark, D. M., “Open rotor noise prediction methods
at NASA Langley-A technology review,” 15th AIAA/CEAS Aeroacoustics Conference (30th
AIAA Aeroacoustics Conference), Art. no. 2009-3133, 2009.
[2] Becker, W., Zhai, J., Rebstock, R., and Loose, S., “Propeller testing in the cryogenic
wind-tunnel cologne DNW-KKK,” ICIASF Record, International Congress on Instrumentation
in Aerospace Simulation Facilities, Art. no. 1569903, 2005, pp. 47-53.
[3] Hager, R., and Vrabel, D., “Advanced Turboprop Project," NASA SP-495, Tech. Rep., 1988.
[4] Gur, O., and Rosen, A., “Multidisciplinary design optimization of a quiet propeller,” Journal of
Power and Propulsion, Vol. 25, 3, 2009, pp. 717-728.
[5] Samant, S. S., and Yu, N. J., “Flow prediction for propfan engine installation effects on
transport aircraft at transonic speeds,” NASA CR 3954, 1986.
[6] Cheng, H. K., Chow, R., and Melnik, F., “Lifting-line theory of swept wings based on the full
potential theory,” Journal of Applied Mathematics and Physics, Vol. 32, 5, 1981, pp. 481-496.
[7] Bousquet, J. M., and Gardarein, P., “Improvements on computations of high speed propeller
unsteady aerodynamics,” Aerospace Science and Technology, Vol. 7, 6, 2003, pp. 465-472.
[8] Moens, F., and Gardarein, P., “Numerical Simulation Of The Propeller Wing Interactions For
Transport Aircraft,” 19th Applied Aerodynamics Conference, 2001, June 11-14, Anaheim,
California.
[9] Gerhold, T., Galle, M., Friedrich, O., and Evans, J., “Calculation of complex three-dimensional
configurations employing the DLR-Tau code,” 35th AIAA Aerospace Sciences Meeting and
Exhibit, AIAA 97-0167, Reno, Nevada.
[10] Datta, A., Nixon, M., and Chopra, I., “Review of rotor loads prediction with the emergence of
rotorcraft CFD,” Journal of American Helicopter Society, Vol. 52, 4, 2007, pp: 287-317.
- 11 -16th Int Symp on Applications of Laser Techniques to Fluid Mechanics
Lisbon, Portugal, 09-12 July, 2012
[11] Stuermer, A., and Rakowitz, M., “Unsteady Simulation of a Transport Aircraft Using
MEGAFLOW”, Applied Vehicle Technology Panel, AVT, Symposium on “Flow Induced
Unsteady Loads and the Impact on Military Applications,” 2005 Budapest, Hungary,
RTO-MP-AVT-123.
[12] Roosenboom, E. W. M., and Schroeder, A., “Flowfield investigation at propeller thrust
reverse,” Journal of Fluids Engineering, Vol. 132, 6, 2010, pp. 061101-1.
[13] Ramasamy, M., and Leishman, J. G., “Benchmarking PIV with LDV for Rotor Wake Vortex
Flows,” AIAA 2006-3479, 24th Applied Aerodynamics Conference, 5-8 June 2006, San
Francisco, California.
[14] Berton, E., Maresca, C., and Favier, D., “A new experimental method for determining local
airloads on rotor blades in forward flight,” Exp. in Fluids, Vol. 37, 2004, pp. 455-457.
[15] van Oudheusden, B. W., Scarano, F., and Casimiri, E. W, M., “Non-intrusive load
characterization of an airfoil using PIV,” Exp. in Fluids, Vol. 40, 6, 2006, pp. 988-992.
[16] Ragni, D., van Oudheusden, B. W., and Scarano, F., “Non-intrusive aerodynamic loads
analysis of an aircraft propeller blade,” Exp. in Fluids, 2011, DOI: 10.1007/s00348-011-1057-7.
[17] Custers, L., G., M., “Propeller-wing interference effects at low speed conditions,” Technical
Report NLR TP 96312, 1996.
[18] Scarano, F., and Riethmuller, M. L., “Advances in iterative multi-grid PIV image processing,”
Exp. in Fluids, Vol. 29, 1, 2000, pp. 51-60.
[19] Veldhuis, L. L. M., “LSW 88-12 Ijking weegsysteem”, Technical Report, TUDelft, 1988.
[20] Molenwijk, L., and Bernardi, S., “Korte kalibratie van de balansen van de LTT windtunnel,”
Technical Report TUDelft, 2008.
[21] Prasad, A. K., and Adrian, R. J., “Stereoscopic particle image velocimetry applied to liquid
flows,” Exp. in Fluids, Vol. 15, 1993, pp. 49-60.
[22] Raffel, M., Willert, C., Wereley, S., Kompenhans, J. “Particle image velocimetry-a practical
guide, 2nd edn.,” Springer Verlag, 2007, Berlin, Germany.
[23] Willert, C., “Stereoscopic digital particle image velocimetry for application in wind-tunnel
flows,” Meas. Sci. Technol., Vol. 8, 1997, pp.1465-1479.
[24] Elsinga, G. E., van Oudheusden, B. W., and Scarano, F., “Evaluation of aero-optical distortion
effects in PIV,” Exp. in Fluids, Vol. 39, 2, 2005, pp. 245-56.
[25] Ragni, D., Ashok, A., van Oudheusden, B. W., and Scarano, F., “Surface pressure and
aerodynamic loads determination of a transonic airfoil based on particle image velocimetry,”
Meas. Sci. and Tech, Vol. 20, 7, 2009, pp. 1-14.
[26] Anderson, J. D., “Fundamentals of Aerodynamics, 2nd Ed.”, McGraw Hill Publishers, 1991.
Acknowledgements
This work is supported by the Dutch Technology Foundation STW (grant n.07645).
- 12 -You can also read