Surface-enhanced Raman spectroscopy with a laser pointer light source and miniature spectrometer1
←
→
Page content transcription
If your browser does not render page correctly, please read the page content below
1435

                  Surface-enhanced Raman spectroscopy with a
                  laser pointer light source and miniature
                  spectrometer1
                  Matthew A. Young, Douglas A. Stuart, Olga Lyandres, Matthew R. Glucksberg,
                  and Richard P. Van Duyne

                  Abstract: The initial steps toward a miniature, field portable sensor based on surface-enhanced Raman spectroscopy
                  (SERS) are presented. It is demonstrated that a low-cost miniaturized Raman system can be used in place of a larger,
                  higher-cost conventional Raman system. This system was developed by sequentially replacing components of a labora-
                  tory scale Raman spectroscopy system with smaller, lower-cost, commercially available components. For example, a
                  green laser pointer was used as the excitation source, a reflectance probe fiber-optic cable was used for laser delivery
                  and collection, and a compact card-based spectrometer was used for dispersion and detection. Spectra, collected with
                  the laser pointer Raman system, are presented of a resonant (Rhodamine 6G) and a non-resonant (trans-1,2-bis(4-
                  pyridyl)ethylene) molecule as well as a self-assembled monolayer (1-decanethiol). Small, low-cost sensors are in de-
                  mand for a variety of applications, and SERS is positioned to contribute significantly with its remarkable sensitivity
                  and molecular specificity.
                  Key words: Raman, SERS, fiber-optics, sensor.
                  Résumé : On présente les étapes initiales dans le développement d’une sonde miniature, à base de spectroscopie Ra-
                  man de surface améliorée (SERS), qui serait utilisable sur le terrain. On a démontré qu’un système Raman miniaturisé
                  et peu coûteux pourrait être utilisé à la place d’un système Raman conventionnel, plus volumineux et de coût plus
                  élevé. Ce système a été mis au point en remplaçant successivement des composants d’un système de spectroscopie Ra-
                  man normal de laboratoire par des composants plus petits et moins coûteux et commercialement disponibles. Par
                  exemple, on a utilisé un laser vert pointeur comme source d’excitation, un câble en fibre optique d’une sonde de ré-
                  flectance pour distribution et la collection du laser ou un spectromètre compact à base de carte pour la dispersion et la
                  détection. Utilisant le système Raman à laser pointeur, on a recueilli les spectres de molécules résonante (Rhodamine
                  6G) et non résonante [trans-1,2-bis(4-pyridyl)éthylène] ainsi que d’une monocouche autoassemblée (décane-1-thiol).
                  Les petites sondes peu coûteuses sont très en demande pour un grand nombre d’applications et la technique SERS est
                  en bonne position pour faire des contributions importantes en raison de sa sensibilité remarquable et de sa spécificité
                  moléculaire.
                  Mots clés : Raman, SERS, fibre optique, sonde.
                  [Traduit par la Rédaction]   Young et al.    1441

Introduction                                                              Unfortunately, Raman spectroscopy is limited in its applica-
                                                                          bility to sensing schemes that require trace analysis because
   In the past few years, surface-enhanced Raman spectros-                of the inefficiency of the Raman scattering process. Since
copy (SERS) has generated significant interest as a method                1977, it has been known that significant enhancement of the
for various sensing applications (1–10). Most chemical sen-               Raman scattering, and subsequent improvement in the detec-
sors rely on properties such as mass, fluorescence, or refrac-            tion, can be realized from molecules adsorbed on specifi-
tive index, which are often not specific for the substance in             cally roughened metal surfaces (11), and tremendous effort
question. In contrast, Raman spectroscopy offers rich molec-              has been expended to explore and exploit this property. Gen-
ular information, and thus often provides unequivocal identi-             erally, in ensemble averaged systems, SERS enhancement
fication of chemical and biological materials of interest.                factors as large as 108 have been realized (12). Under certain

   Received 19 March 2004. Published on the NRC Research Press Web site at http://canjchem.nrc.ca on 21 October 2004.
   M.A. Young, D.A. Stuart, and R.P. Van Duyne.2 Department of Chemistry, Northwestern University, Evanston, IL 60208-3113,
   USA.
   O. Lyandres and M.R. Glucksberg. Department of Biomedical Engineering, Northwestern University, Evanston, IL 60208-3113,
   USA.
   1
       This article is part of a Special Issue dedicated to the memory of Professor Don Irish.
   2
       Corresponding author (e-mail: vanduyne@chem.northwestern.edu).

Can. J. Chem. 82: 1435–1441 (2004)                            doi: 10.1139/V04-098                                      © 2004 NRC Canada
1436 Can. J. Chem. Vol. 82, 2004
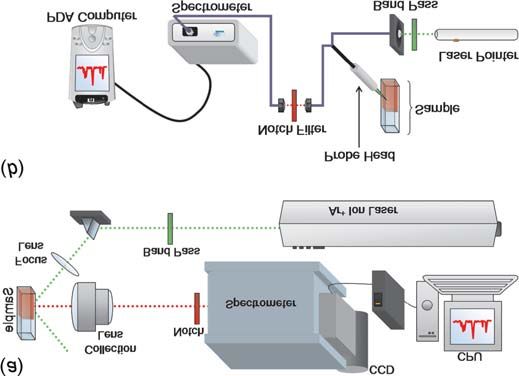
Fig. 1. Experimental set-ups. (a) Conventional Raman system sensing, and environmental sampling. Several small Raman
and (b) miniaturized system assembled with available lab equip- systems have been recently developed to address these is-
ment. Most of the cumbersome and expensive elements have sues. These include systems from InPhotonics (Norwood,
been replaced with compact, off-the-shelf components to realize Mass.), Digilab (Randolph, Mass.), Enwave Optronics
a savings in cost, size, and weight. (Irvine, Calif.), and Delta Nu (Laramie, Wyo.). Towards this
same end, the present work focuses on decreasing the cost
and size of the typical Raman setup. Replacing many of the
classic elements of the Raman setup listed above with
smaller, lower-cost alternatives will be an important step in
the realization of simple, field-worthy spectrometers and
sensors based on the SERS phenomenon.
The work presented in this paper describes the first steps
towards replacing the most cumbersome and costly elements
of a traditional Raman system with significantly smaller and
cheaper components (Fig. 1b). AgFON surfaces are used as
SERS active substrates because they have been shown to be
reproducible and stable in electrochemical, ultrahigh
vacuum, and ambient experimental conditions (30, 32, 33)
Thus, AgFONs are well-suited to the wide range of environ-
ments in which SERS sensors would be deployed. This work
adds substantially to the growing literature demonstrations
that SERS is feasible utilizing low-cost, compact, and
readily available components while retaining the necessary
experimental conditions, enhancement factors of ~1014 have sensitivity for sensing applications.
been achieved (13, 14), making SERS the only vibrational
spectroscopy capable of both detecting and identifying Experimental
single molecules under ambient conditions. With this en-
hancement, SERS provides exquisite sensitivity, which is Materials and equipment
complemented by the molecular specificity inherent to vi- Ag wire (99.99%, 0.04′′ diameter (1 inch = 25.4 mm))
brational spectroscopy. SERS has been employed in the de- was purchased from D.F. Goldsmith (Evanston, Ill.). The Ag
velopment of a myriad of sensors, including those detecting disk electrodes consisted of a Ag rod sealed with an epoxy
chemical and biological agents (15–18), explosives (19, 20), (Torr Seal, Varian) into a Teflon® frame. The glass sub-
glucose (9, 10, 21), aromatics (22, 23), proteins (24, 25), and strates were 18 mm diameter, No. 2 cover slips from Fisher
DNA (26–29). Scientific (Pittsburgh, Penn.). Pretreatment of glass sub-
In addition to being highly sensitive and selective, attrac- strates required H2SO4, H2O2, and NH4OH, all purchased
tive properties for sensors include rapid response, ease of from Fisher Scientific (Pittsburgh, Penn.). Surfactant-free
use, reliability, and low cost. Raman spectroscopy has taken white carboxyl-substituted polystyrene latex nanospheres
several steps in this direction. The developments of sensitive with diameters of 410 nm were obtained from Interfacial
charge-coupled device (CCD) detectors and holographic Dynamics Corp. (Portland, Ore.). Tungsten vapor deposition
notch filters have allowed the rapid and facile implementa- boats were purchased from R.D. Mathis (Long Beach,
tion of Raman spectroscopy in a range of applications. The Calif.). Rhodamine 6G (98%) was purchased from Sigma
development of the silver film over nanosphere (AgFON) (St. Louis, Mo.) and was used as received. trans-1,2-Bis(4-
surface (30, 31), with reproducible nanoscale roughness fea- pyridyl)ethylene (97%), 1-decanethiol (96%), and benzene
tures, has enabled stable and consistent SERS measurements (99%) were purchased from Aldrich (Milwaukee, Wis.) and
to be taken. In addition, Ag colloids have proven to be reli- used as received.
able SERS active substrates and are used by a large number
of researchers. Thus, SERS has become a relatively fast, AgFON surface preparation
simple, and reliable spectroscopy. AgFON surfaces were fabricated with the use of a modi-
There remains a major limiting factor for the implementa- fied Consolidated Vacuum Corporation vapor deposition sys-
tion of Raman spectroscopy to widespread sensing applica- tem. The steps included: (1) polishing an electrode surface
tions. This drawback is that for Raman (and SERS) with 0.3 and 0.05 µm alumina; (2) coating the smooth elec-
experiments, large and expensive equipment is required. The trode surface with 410 nm diameter surfactant-free white
major components of a typical Raman instrument are the la- carboxyl-substituted polystyrene latex nanospheres and al-
ser, the delivery optics, the sample, the collection optics, the lowing to dry; (3) masking off the area where deposited
spectrograph, and the detector (Fig. 1a). Each component metal is not desired; (4) depositing 200 nm Ag; and (5) re-
can take up significant space, be extremely expensive, and moving the mask after metal deposition. When glass was
be difficult to assemble, align, and maintain. These factors, used instead of the electrode surfaces, the same procedure
particularly the physical dimensions and cost, are important was followed, but without the polishing and masking. The
obstacles for the realization of Raman spectroscopy for use glass also required a pretreatment consisting of: (1) piranha
in critical routine situations such as blood glucose monitor- etch, H2SO4 – 30% H2O2 (3:1) at 80 °C for 1 h to clean the
ing, drinking water testing, forensics, remote field defense substrate; and (2) base treatment, H2O – NH4OH – 30%
© 2004 NRC CanadaYoung et al. 1437
Table 1. Comparison of cost, size, and weight between the conventional and miniaturized Raman systems.
Cost Weight
Component (US dollars) Size (cm) (kg) Manufacturer Model No.
Standard
Ion laser 50 000 150×25×25 45 Spectra Physics 2060
Optics 200 10×6 0.3 Edmund —
Notch filter 895 2.5×35 0.1 Semrock NF01-532U-25
Spectrograph 15 000 55×40×40 23 Acton VM-505
CCD 34 000 20×10×5 2 Roper Scientific Spec-10:400B
Computer 600 50×50×20 4 Dell —
Monitor 100 30×30×20 9 Dell —
Total 100 795 250 810 cm3 83.4 — —
Miniature
Laser pointer 99 15×1.5 72 JD Photonics Green-GLP
Fiber probe 549 1000×0.5 100 Ocean Optics R200-REF
Long pass filter 420 2.5×0.35 25 Semrock LP01-532RU-25
Spectrometer 2 000 14.1×10.49×4.09 390 Ocean Optics SD2000
CCD Integrated — — — —
PDA 600 13.8×8.4×1.59 200 HP iPAQ n5555
Total 3 668 1313 cm3 787 — —
Note: The miniaturized system is about 4% the cost and 0.5% the size of the standard system.
H2O2 (5:1:1) with sonication for 1 h to render the surface Results and discussion
hydrophilic.
Clearly, experimental Raman spectroscopy has tradition-
Raman spectroscopy ally been an expensive endeavor. In addition to being costly,
Sequential instrumental configurations were implemented the large components have prevented an easily portable sys-
to evaluate the efficiency and performance characteristics of tem. Figure 1 depicts our miniaturized (and lower cost)
the miniature Raman system. A variety of molecules were Raman setup and compares it to a traditional system. Table 1
probed to establish the applicability and utility of the instru- summarizes the approximate cost, size, and weight of the
ment to the detection of molecules differing in chemical components for both the conventional and miniature Raman
structure and scattering cross sections. In the first series of instruments. This does not depict the lowest-cost or highest-
experiments, the AgFON substrates were incubated in both cost systems that one could construct. It is an estimate based
resonant and non-resonant molecules. The first instrumental on the systems used in our lab. Readily available compo-
configuration closely approximates that used in conven- nents have been used to demonstrate the feasibility of
tional, lab-scale Raman spectroscopy. The first step taken in performing SERS experiments with a small and relatively in-
this work was to replace the excitation Argon ion laser expensive setup. Obviously, conventional setups have many
(Spectra-Physics, Mountain View, Calif.) with an inexpen- advantages (e.g., wavelength selection, more power, higher
sive CW green laser pointer (JD Photonics, Renton, Wash.). sensitivity, and high resolution) over the presented low-cost
The battery powered green laser pointer consists of a high prototype. However, for many applications this approach
power IR laser diode at 808 nm pumping a tiny block of presents an attractive alternative. The significant savings in
Nd:YVO4, which generates light at 1064 nm. This feeds a resources and space generously offsets the compromise in
KTP intracavity frequency doubling crystal to produce the resolution and sensitivity. Additionally, a miniaturized sys-
green beam at 532 nm. The Raman instrument was further tem will increase the use of Raman and SERS for portable
modified by replacing the bulky collection and focusing op- environmental testing and in undergraduate teaching labora-
tics with a low profile 200 µm core reflection fiber-optic tories.
probe (Ocean Optics, Dunedin, Fla.). Raman spectra for the We have used an aufbau approach to demonstrate the con-
resonant and non-resonant molecules were collected by fo- cept of an economical, miniaturized SERS instrument. We
cusing the output of the fiber onto the entrance slit of the have systematically built up this system by consecutively re-
large scale Acton VM-505 dispersion spectrograph (Acton, placing components of a conventional system with lower-
Mass.) with a Roper Scientific (Trenton, N.J.) Spec-10:400B cost, smaller items. The project began with the replacement
liquid N2 cooled CCD detector. Finally, we evaluated the use of the traditional excitation source (Ar+, Ti:S, HeNe, or dye
of a compact, off the shelf, card-based, USB interface Ocean laser) with a simple green laser pointer (GLP), λ ex =
Optics (Dunedin, Fla.) model SD2000 spectrometer as a re- 532 nm. Figures 2 and 3 show the applicability of the GLP
placement for the critical dispersion and detection compo- as a SERS excitation source for both resonant and non-
nents. The dual channel spectrometer is configured with a resonant molecules. While Rhodamine 6G (R6G) is resonant
600 lines mm–1 grating and a 1200 lines mm–1 grating. Con- at 532 nm, trans-1,2-bis(4-pyridyl)ethylene (BPE) is not.
veniently, the fiber-optic bearing the Raman scattered light BPE is a relatively strong Raman scatterer and it has been a
can be coupled directly into this spectrometer, allowing for molecule of interest for many SERS studies (34–38). For the
quick and simple alignment. R6G experiment, the AgFON on a polished electrode was
© 2004 NRC Canada1438 Can. J. Chem. Vol. 82, 2004
Fig. 2. SER spectrum of R6G on a AgFON electrode (dry). Fig. 3. SER spectrum of BPE on a AgFON electrode in flow
λ ex = 532 nm (GLP). (a) P = 0.25 mW, acquisition time = cell. λ ex = 532 nm (GLP). (a) P = 1.5 mW, acquisition time =
300 ms. (b) Laser delivered and collected with reflectance probe 5 s. (b) Laser delivered and collected with reflectance probe
fiber-optic. P = 10 µW, acquisition time = 10 s. fiber-optic. P = 0.25 mW, bin 3, acquisition time = 40 s.
incubated in 2.4 µmol L–1 R6G solution for 10 min., then be removed by background subtraction since they are con-
rinsed carefully with water and allowed to dry. In the case of stant at a given excitation power.
BPE, a 0.5 mmol L–1 solution was introduced into a flow In addition to strong scatterers such as R6G and BPE, it is
cell containing a AgFON on a polished Ag electrode. Fig- important to demonstrate the acquisition of spectra of mole-
ures 2a and 3a show high quality SER spectra acquired us- cules with smaller Raman scattering cross sections. Many
ing the GLP as the excitation source. The spectra exhibit analytes of interest in sensing applications are not strong
intense, well-defined peaks characteristic of the given mole- scatterers. Figure 4 depicts an SER spectrum with a laser
cule. pointer utilizing a self-assembled monolayer (SAM) of 1-
A second set of experiments was conducted to determine decanethiol (1-DT). SAMs have generated enormous interest
the effect of altering the collection optics and light delivery in many areas of chemistry, including SERS; and they are
of the system. Figures 2b and 3b show the case where the vital for many sensing applications including their use as
light delivery, focusing, and collection optics are replaced by species selective partition layers (9, 10, 27, 39–42). 1-DT is
a fiber-optic probe. The light was delivered from the GLP to a relatively poor Raman scatterer, but a SER spectrum was
the sample through the probe, and the scattered light was readily obtained using the GLP as the excitation source.
collected by the probe and focused onto the slit of the Acton The final components to be replaced in the conventional
spectrometer. The spectra compare quite favorably to those Raman apparatus are the spectrograph and detector. We re-
using conventional delivery and collection optics. In the case placed these components by coupling the collection fiber di-
of R6G, little to no signal intensity is lost with the fiber- rectly into an SD2000 spectrometer from Ocean Optics.
based delivery and collection. For BPE, the signal is slightly Because these spectrometers are designed for UV–vis spec-
attenuated, but an ample amount of Raman scattered light is troscopy, it was necessary to determine if the sensitivity of
transmitted back through the fiber to generate a strong SER the detector would be adequate for the low level of radiated
spectrum in a short collection time. The broad featureless photons generated by SERS and if the grating would provide
peaks on the right side of the BPE spectrum (~1225, ~1075, sufficient dispersion to adequately resolve the narrow Raman
and ~840 cm–1) are due to Raman scattering generated in- peaks. While small laser diodes are available with adequate
side the fiber itself. Altering the filter design of the fiber- power (e.g., >10 mW), the GLP used in the above experi-
optic probe can eliminate these broad peaks. They could also ments supplies only 3 to 4 mW. Therefore, for this experi-
© 2004 NRC CanadaYoung et al. 1439
Fig. 4. SER spectrum of 1-DT on a AgFON on clean glass Fig. 6. Raman spectrum of neat benzene recorded with SD2000
(dry). λ ex = 532 nm (GLP). P = 0.5 mW, acquisition time = spectrometer. λ ex = 632.8 nm. Acquisition time = 30 s. S/N ~ 7.
60 s.
lines. It is clear that grating 2 has significantly higher resolu-
tion. Following Sommer and Stewart (43), band fitting of
Fig. 5. Mercury emission lines recorded with SD2000 spectrome- the 577 and 579 emission lines of the Hg lamp gave values
ter. (a) Grating 1 (600 lines/mm) and (b) grating 2 (1200 lines/mm). of 0.32 nm and 0.37 nm at FWHM. These values were used
to determine that the spectral resolution of this instrument is
~10 cm–1 at 632.8 nm excitation. Although the spectrometer
was not originally optimized for the high resolution gener-
ally demanded for Raman spectroscopy, it gives sufficient
resolution for identification of Raman signatures. This is
clearly demonstrated in Fig. 6, which shows a normal
Raman spectrum of benzene, with an estimated signal-to-
noise ratio of ~7. While this is certainly less than ideal
relative to spectra obtained on a commercial FT-Raman in-
strument, it is a positive step in the development of the min-
iaturized system. The measurement of a Raman spectrum of
neat benzene is, however, substantially different than in a
typical SERS experiment, in which the concentration of the
analyte is significantly lower. Figure 7 directly compares
SER spectra collected with the Acton spectrograph and the
SD2000 spectrograph with R6G on a dried AgFON as the
analyte. Figure 7a corresponds to the SER spectrum re-
corded on the Acton and Fig. 7b to the SER spectrum
recorded on the SD2000 spectrograph. The intensity of the
7a spectrum was significantly reduced so that 7a and 7b
could be on the same scale. The spectra compare quite fa-
vorably. While there is much room for improvement, this
demonstration of SERS utilizing such a small and low-
resolution piece of equipment is significant. The signature of
R6G is clear and represents a considerable step towards the
miniaturization of SERS instrumentation.
Conclusions
Here, we demonstrated that a low-cost miniaturized
Raman system could be used in place of a larger, higher-cost
ment ~20 mW of laser light was coupled into the fiber using conventional Raman system. There are clearly several ad-
a Coherent (Santa Clara, Calif.) model 590 dye laser operat- vantages that remain with the larger and more expensive
ing at λ ex = 632.8 nm. This was done simply to allow more components of a Raman setup. In addition, the components
power to be coupled into the fiber, and to decrease the ac- that have been used in this work as a technology demonstra-
quisition time. The SD2000 spectrometer used here is con- tion test-bed are far from optimized. While the ability to ob-
figured with two different gratings. Figure 5 shows a tain adequate SERS spectra with small and cheap equipment
comparison of the two gratings using mercury emission has been clearly shown, the components used were selected
© 2004 NRC Canada1440 Can. J. Chem. Vol. 82, 2004
Fig. 7. SER spectrum of R6G on a AgFON on clean glass (dry). 6. K. Kneipp, A.S. Haka, H. Kneipp, K. Badizadegan, N.
λ ex = 632.8 nm. (a) Acton VM-505 spectrometer, P = 1.8 mW, Yoshizawa, C. Boone, K.E. Shafer-Peltier, J.T. Motz, R.R.
acquisition time = 10 s. (b) Ocean Optics SD2000 spectrometer, Dasari, and M.S. Feld. Appl. Spectrosc. 56, 150 (2002).
acquisition time = 30 s. 7. K. Kneipp and H. Kneipp. Can. J. Anal. Sci. Spect. 48, 125
(2003).
8. R. Sulk, C. Chan, J. Guicheteau, C. Gomez, J.B.B. Heyns, R.
Corcoran, and K. Carron. J. Raman. Spectrosc. 30, 853 (1999).
9. K.E. Shafer-Peltier, C.L. Haynes, M.R. Glucksberg, and R.P.
Van Duyne. J. Am. Chem. Soc. 125, 588 (2003).
10. C.R. Yonzon, C.L. Haynes, X.Y. Zhang, J.T. Walsh, and R.P.
Van Duyne. Anal. Chem. 76, 78 (2004).
11. D.L. Jeanmaire and R.P. Van Duyne. J. Electroanal. Chem. 84,
1 (1977).
12. C.L. Haynes and R.P. Van Duyne. J. Phys. Chem. B, 107, 7426
(2003).
13. S.M. Nie and S.R. Emery. Science, 275, 1102 (1997).
14. K. Kneipp, Y. Wang, H. Kneipp, L.T. Perelman, I. Itzkan, R.
Dasari, and M.S. Feld. Phys. Rev. Lett. 78, 1667 (1997).
15. S. Christesen, B. MacIver, L. Procell, D. Sorrick, B. Carrabba,
and J. Bello. Appl. Spectrosc. 53, 850 (1999).
16. S. Farquharson, L. Grigely, V. Khitrov, W. Smith, J.F. Sperry,
and G. Fenerty. J. Raman. Spectrosc. 35, 82 (2004).
17. S. Farquharson, W.W. Smith, V.Y.-H. Lee, S. Elliott, and J.F.
Sperry. Proc. SPIE, 4575, 62 (2002).
18. W.R. Premasiri, R.H. Clarke, and M.E. Womble. Proc. SPIE,
4577, 205 (2002).
19. J.M. Sylvia, J.A. Janni, J.D. Klein, and K.M. Spencer. Anal.
Chem. 72, 5834 (2000).
20. J.A. Janni, J.M. Sylvia, S.L. Clauson, and K.M. Spencer. Proc.
primarily for being convenient, readily available, off the SPIE, 4577, 230 (2002).
21. M.F. Mrozek and M.J. Weaver. Anal. Chem. 74, 4069 (2002).
shelf components. Vast improvements in sensitivity and res-
22. W. Hill, V. Fallourd, and D. Klockow. J. Phys. Chem. B, 103,
olution can be made by carefully selecting each component
4707 (1999).
(e.g., using smaller filters, altering the probe configuration, 23. B. Wehling, W. Hill, and D. Klockow. Int. J. Environ. Anal.
more sensitive detector, etc.). With continued optimization, Chem. 73, 223 (1999).
smaller and less expensive equipment will allow SERS to 24. M.H. Chowdhury, B. Atkinson, T. Good, and G.L. Cote. Proc.
enter into a variety of field-sensing applications that will SPIE, 4965, 111 (2003).
contribute to public safety and improved quality of life. 25. S. Habuchi, M. Cotlet, R. Gronheid, G. Dirix, J. Michiels, J.
Vanderleyden, F.C. De Schryver, and J. Hofkens. J. Am.
Chem. Soc. 125, 8446 (2003).
Acknowledgements 26. T. Vo-Dinh, L.R. Allain, and D.L. Stokes. J. Raman. Spectrosc.
33, 511 (2002).
The authors gratefully acknowledge Amanda J. Haes,
27. M. Culha, D. Stokes, L.R. Allain, and T. Vo-Dinh. Anal. Chem.
Adam D. McFarland, and Chanda R. Yonzon for helpful
75, 6196 (2003).
comments and technical assistance. Funding for this work 28. D. Graham, L. Fruk, and W. Ewen Smith. Analyst (U.K.), 128,
was provided by the Institute for Bioengineering and 692 (2003).
Nanoscience in Advanced Medicine at Northwestern Univer- 29. D. Graham, B.J. Mallinder, and W.E. Smith. Biopolymers, 57,
sity, the National Institutes of Health (EY13002, EY13015, 85 (2000).
and DK066990), the National Science Foundation (DMR- 30. L.A. Dick, A.D. McFarland, C.L. Haynes, and R.P. Van Duyne.
0076097), and the Air Force Office of Scientific Research J. Phys. Chem. B, 106, 853 (2002).
MURI program (F49620-02-1-0381). 31. R.P. Van Duyne, J.C. Hulteen, and D.A. Treichel. J. Chem.
Phys. 99, 2101 (1993).
32. M. Litorja, C.L. Haynes, A.J. Haes, T.R. Jensen, and R.P. Van
Duyne. J. Phys. Chem. B, 105, 6907 (2001).
References
33. P. Freunscht, R.P. Van Duyne, and S. Schneider. Chem. Phys.
1. Y.W.C. Cao, R.C. Jin, and C.A. Mirkin. Science, 297, 1536 Lett. 281, 372 (1997).
(2002). 34. R.G. Freeman, R.M. Bright, M.B. Hommer, and M.J. Natan. J.
2. Y.C. Cao, R.C. Jin, J.M. Nam, C.S. Thaxton, and C.A. Mirkin. Raman. Spectrosc. 30, 733 (1999).
J. Am. Chem. Soc. 125, 14 676 (2003). 35. L. He, M.J. Natan, and C.D. Keating. Anal. Chem. 72, 5348
3. W.E. Doering and S.M. Nie. Anal. Chem. 75, 6171 (2003). (2000).
4. A. Tao, F. Kim, C. Hess, J. Goldberger, R. He, Y. Sun, Y. Xia, 36. R. Aroca, P. Corio, and J.C. Rubim. Ann. Chim-Rome 87, 1
and P. Yang. Nano Lett. 3, 1229 (2003). (1997).
5. A. McCabe, W.E. Smith, G. Thomson, D. Batchelder, R. Lacey, 37. W.H. Yang, J. Hulteen, G.C. Schatz, and R.P. Van Duyne. J.
G. Ashcroft, and B.F. Foulger. Appl. Spectrosc. 56, 820 (2002). Chem. Phys. 104, 4313 (1996).
© 2004 NRC CanadaYoung et al. 1441
38. S. Bernard, N. Felidj, S. Truong, P. Peretti, G. Levi, and J. 41. L.A. Dick, A.J. Haes, and R.P. Van Duyne. J. Phys. Chem. B,
Aubard. Biopolymers, 67, 314 (2002). 104, 11 752 (2000).
39. A. Loren, J. Engelbrektsson, C. Eliasson, M. Josefson, J. 42. D.H. Murgida and P. Hildebrandt. J. Phys. Chem. B, 105, 1578
Abrahamsson, and K. Abrahamsson. Nano Lett. 4, 309 (2004). (2001).
40. R.A. Sulk, R.C. Corcoran, and K.T. Carron. Appl. Spectrosc. 43. A.J. Sommer and S.A. Stewart. Appl. Spectrosc. 53, 483
53, 954 (1999). (1999).
© 2004 NRC CanadaYou can also read