Structural Changes in the Bio-Products Sector: An Investment Perspective - Don Roberts CEO, Nawitka Capital Advisors Ltd. November 27, 2017 New ...
←
→
Page content transcription
If your browser does not render page correctly, please read the page content below
Structural Changes in the Bio-Products Sector:
          An Investment Perspective

  .

                     Don Roberts
           CEO, Nawitka Capital Advisors Ltd.

                 November 27, 2017

           New Value of Bioeconomy Seminar
            Pellervo Economic Research PTT
                    Helsinki, Finland

            ..
Situation
Analysis
• The global bio-products sector is vertically integrated, and
comprised of multiple industries and market segments.
• It is undergoing transformational change related to a series of
demographic, technological, societal and environmental shocks.
ü Within the paper industry, communication papers are in secular
decline, while packaging & tissue papers are continuing to grow
• These shocks are affecting both the demand and supply-side of
the market, and creating winners and losers amongst traditional
players.
• How is Finland positioned to deal with this disruption?
|1
Outsiders’
  View
  of
  Finland
                     National Innovation Report Card
        Grade
  A        Grade
  B      Grade
  C       Grade
  D
        Finland           U.S.A.          Canada           Ireland
        Denmark           Switzerland     Germany
        Sweden            Netherlands     Japan
                          Austria         Australia
                          Norway          Belgium
                                          U.K.
                                          France

• Overall, how innovative is Finland perceived to be by outsiders?

• According to the Conference Board of Canada (2015), Finland is one of only 3
  countries to receive a Grade A in terms of national innovation – the top rank.

• According to Nawitka Capital (2017), the “continental leaders” in the forest products
  industry regarding bio-products innovation are:
     • UPM-Kymmene in Europe
     • Fibria in Latin America
     • Georgia Pacific in North America
                                                                                        |2
     • Oji Paper in Asia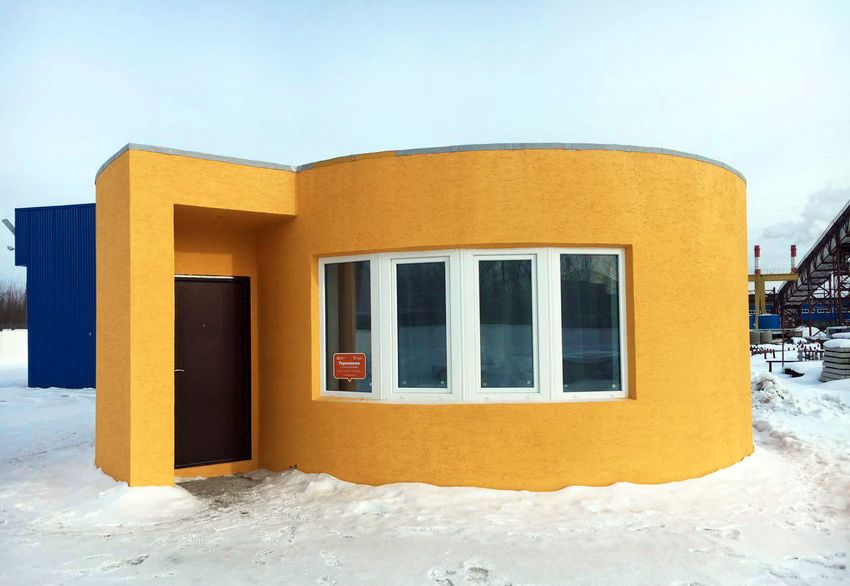
Finland’s
Response?
Nine major new and pending projects related to Bio-Products in Finland
In addition to
Investor Location Year Product/
Investment type pulp, this includes
bio-materials
Metsa-‐ Aanekoski 2017 -‐ NBSK &
NBHK
pulp (eg., MFC, MCC,
Fibre -‐ Micro
Fibrillated
intermediate for
Cellulose
(MFC)] viscose) and
biofuels.
UPM-‐ Kouvola 2017 -‐ NBSK/NBHK
pulp
Kymmene Pietarsaari 2019 -‐ NBSK/NBHK pulp Metsa’s EUR 1.2B
bioproduct mill is
Stora-‐ Imatra 2019
-‐ MFC the largest
Enso Uimaharju 2019 -‐ Dissolving
pulp investment in the
history of
Boreal
Kemijarvi 2020 -‐ NBSK
&
dissolving
pulp Finland’s forest
Bioref -‐ Micro
Crystalline products industry
Cellulose
If all the planned
KaiCell Paltamo 2021 -‐ Biorefinery with
NBSK
&
product is
Fibers intermediate
for
viscose exported, it
would likely
FinnPulp Kuopio 2021 -‐ NBSK
pulp boost Finland’s
bio-products
Kaidi Kemi 2021 -‐ Biodiesel &
bio-‐gasoline trade by more
than 2 billion
NEB Kajaani 2017 -‐ Bioethanol euros/year.
|3
SEB Kouvola 2019 -‐ Bioethanol Source: Prof. Olli Dahl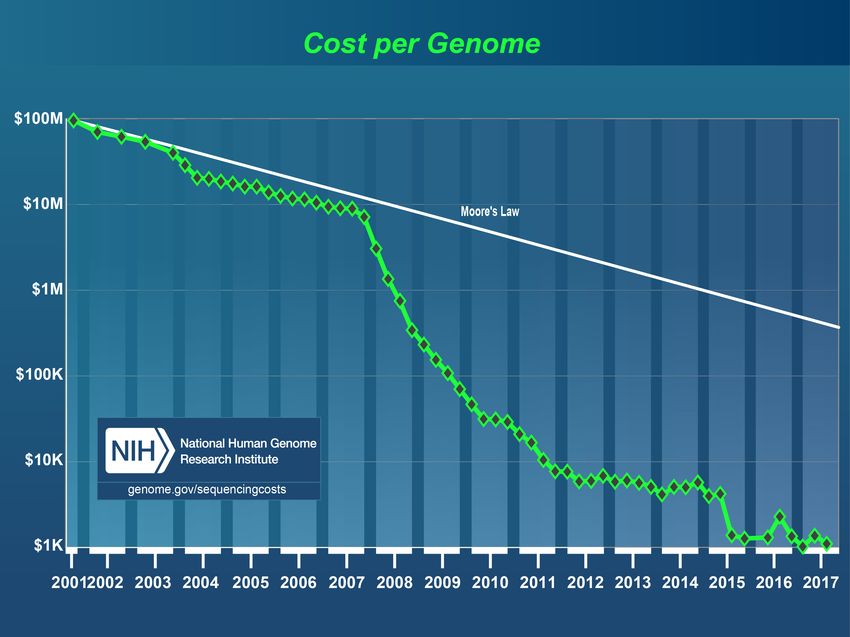
Three
  Fundamental
  Questions
This keynote presentation explores three fundamental questions
facing the Bio-Products sector.

1) Are key transformational technologies strengthening or weakening
   the traditional competitive advantage of countries like Finland &
   Canada?

2) Is renewable energy a meaningful opportunity for the bio-
   products industry – or a potential threat?

3) Given demographic changes and low fossil fuel prices, can
   governments afford to financially support the production of clean
   bio-products?

                                                                   |4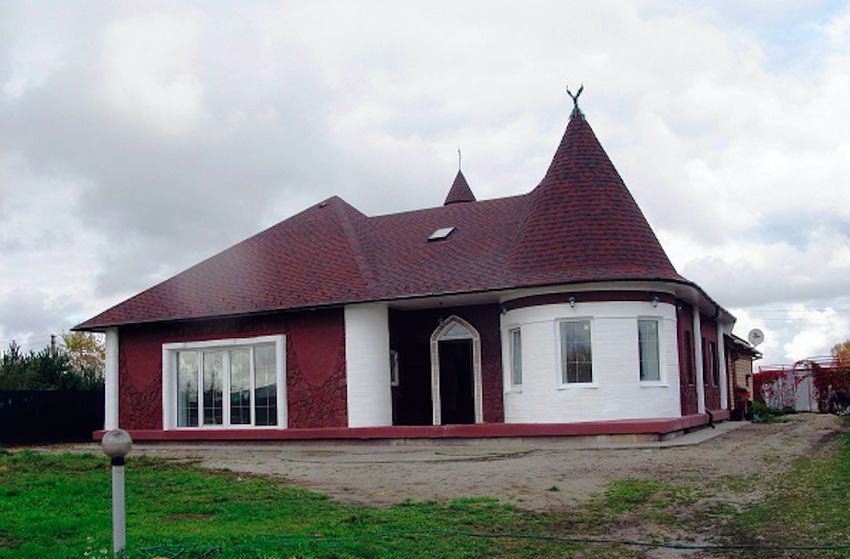
Question
  #1
Are key transformational technologies strengthening or
weakening the traditional competitive advantage of
countries like Finland?

• Fiber strength resulting from slow growing trees has historically
  been a key competitive advantage of both the pulp and solidwood
  industries in northern countries.

                                                                  |5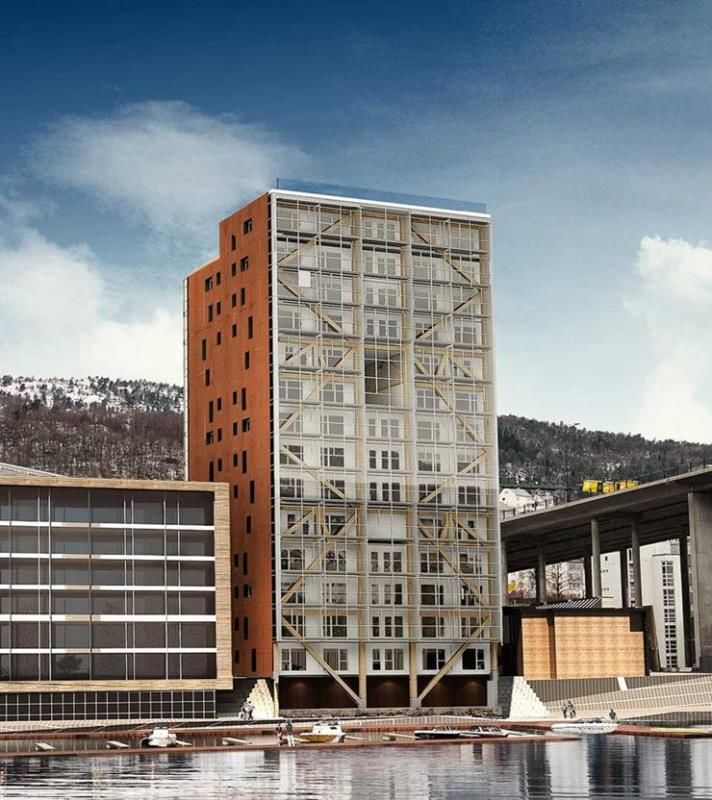
Value
of
Long
vs
Short
Fiber: Recent
Data
Point
Ø Consider an interesting data point generated in September
• A subsidiary of Asia Pulp & Paper paid a very high premium
for El Dorado’s pulp mill and expansion option in Brazil
• Reflected a particularly bullish view from Asia.
• Paid $2,810/tonne of pulp capacity
ü ~70% premium over average Brazilian peers (Fibria,
Suzano)
ü > 500% premium over the NBSK producer Canfor Pulp
• Interesting perspective on the future demand for pulp, and
relative attractiveness of southern hardwood and northern
softwood pulp.
Ø Does this suggest that northern countries like Canada and
Finland have a bad case of “pulp chauvinism”?
|6
Next-‐Generation
Genomics
Ø Cost of DNA sequencing is falling even faster than that suggested by
Moore’s Law – from ~$100 million per genome in 2000 to ~$1,000 in
2017
Ø It is not “if” this dramatic cost reduction in DNA sequencing will have
a meaningful impact on the bio-products value chain, it is “how” &
“when”.
|7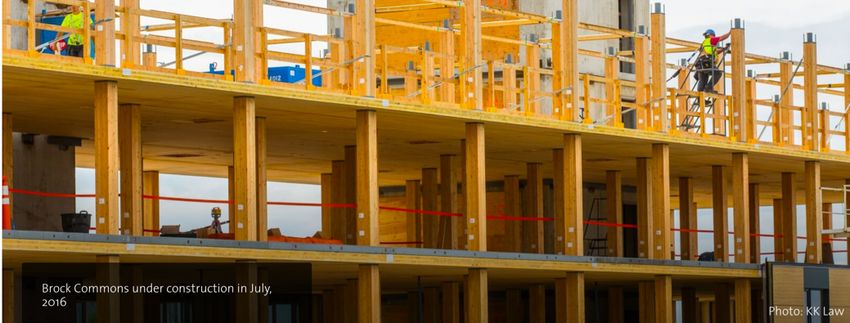
Next-‐Generation
Genomics
Ø A technological “fix” can increasingly be used to enhance the
natural attributes of biomass.
Ø For example, Brazilian forest companies have already enhanced
genetics to produce energy oriented eucalyptus clones:
§ Have high lignin content/calorific value – superior for
generating energy, but cannot be used to produce pulp
§ Forest yield ~60-80 m3/ha/year (vs ~35-50 for pulp
oriented clones)
§ Harvest in 2-3 years (vs 7 years for pulp)
Ø Can the Brazilians also produce fast growing trees that can be
processed into stronger pulp? Likely.
|8
Biomaterials/Biochemicals
Wood is roughly 1/3 cellulose, 1/3 hemicellulose, and 1/3 lignin.

Focus on fractionating the biomass - extracting, separating and
processing each of the three components.

For example:

• Aside from being used to produce paper, cellulose can be used to
  produce intermediates for things like films (eg., cellophane), and a
  range of pharmaceutical applications.

• Use hemicellulose to produce xylose – an input into the sweetener
  market.

• Use lignin to replace phenols in the wood adhesives market, or
  processed into a substitute for carbon fibre composites.
                                                                    |9
Biomaterials/Biochemicals
Nanocellulose is nano-sized cellulose fibrils (eg. Micro-fibrillated
cellulose, Nano Crystalline Cellulose).
• Nanocellulose can enhance the performance of paper in terms of,
strength, stiffness, printability.
• If we want to produce Nanocellulose at scale, we don’t have to
constrain ourselves to the paper industry.
ü Schlumberger is finding the application of NCC and Cellulose
Filaments show positive results in the oil and gas industry, with
respect to cement well casing, drilling fluid and enhanced oil
recovery.
• The greatest financial returns will likely be applications outside the
paper industry. (eg., Personal & Health Care, Electronics)
| 10Solidwood
The solidwood industry has historically been the cornerstone of a
competitive forest sector in Scandinavia and Canada.
It’s use in the construction industry generates a high value per m3 of
roundwood, and helps pay for removing lower quality biomass from
the forest.
| 11Structural
Wood
Products
Opening
up
New
Markets
• Cross Laminated Timber is an engineered mass timber product that
utilizes smaller dimension lumber (2x4, 2x6, 2x8, etc.) to create large,
lightweight, made-to-order panels. CLT was first developed and used in
Austria in the early 1990s
• Glue Laminated Timber or Glulam is a product similar to CLT and is an
established product in the North American market. Like CLT it is made by
laminating smaller dimension lumber together, but in one direction as
opposed to alternating each layer.
CLT Glulam
CLT
panel.
Photo
Courtesy
of
Structurlam
Products,
Ltd. Glulam
beam.
Photo
courtesy
of
BMC
West
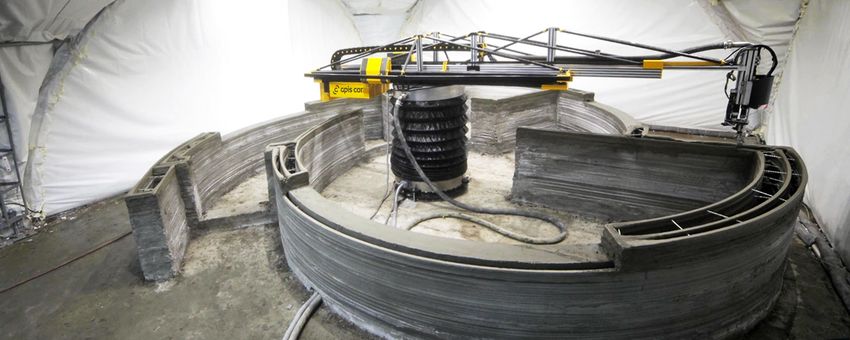
. 12UBC’s
Brock
Commons,
Vancouver
18-‐storey
student
residence,
primarily
made
of
wood
(CLT)
Mid
&
High
rise
buildings
open
up
a
whole
new
market
for
wood.
Constructed
in
9
½
weeks.
13 Source:
Naturally
WoodUBC’s Brock Commons • H=53.5m – the tallest wood- based building in the world. • Hybrid structure • Two-way point-supported CLT floor system • Gravity loads taken by glulam and PSL columns • Lateral system consists of floor panels and 2 concrete cores 14
UBC’s
Brock
Commons:
Environmental
Footprint
Source:
Naturally
Wood
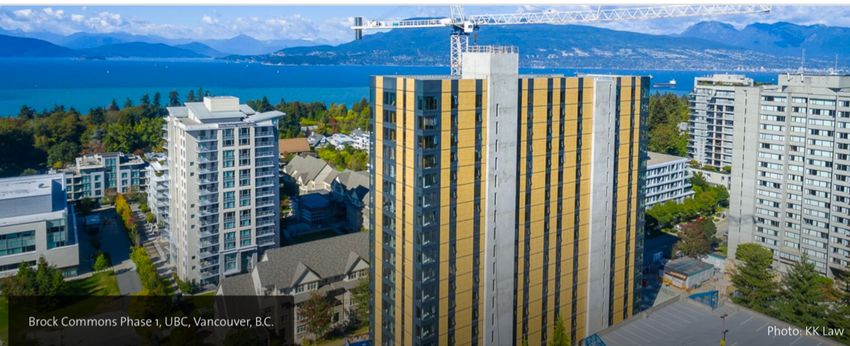
15CLT
is
already
in
Scandinavia
• The
Treet Building
in
Bergen,
Norway
14-‐storeys
51m
– the
world’s
second
tallest
contemporary
wood
building
• Stora Enso
is
a
champion
of
CLT
in
Europe,
and
the
largest
producer.
16CLT
Wind
Turbines,
Germany
• H= 100 m with a ladder and lift system
• Turbine rotor diameter of 77 m weighs 100 tons 1,500 kW of electricity
17Implications
of
New
Markets
for
Structural
Wood
Products?
The good news?
• Potentially opening up the mid & high-rise market for wood,
with the associated economic and environmental benefits
The bad news?
• Given the newer panel technologies, we do not necessarily
need slow growing wood for structural applications (eg.,
Eucalyptus is also good for CLT).
. 183D
Printing
3D Printing has been called
“the source of the next industrial
revolution”.
• It allows for mass customization.
• It is a manufacturing process that builds layers to create a three
-dimensional solid object from a digital model on a computer.
• A range of alternative materials are being assessed for building
with 3D printers – including woody biomass.
• China and the Netherlands are the global leaders in exploring this
application.
ü Winsun, a Chinese construction company, has already built
flats using 3D printing.
| 193D
Printing
a
House
Using a 3D The team
printer in 2016 sprayed a
Apis Cor built polyurethane-
this 400 ft2 based mixture
structure for for insulation,
~$10,000. then installed
the house's
The walls, windows and
partitions and finishes, like
building envelope countertops and
were all printed. cabinets, and
painted it bright
yellow.
The workers
and the 3D
printer
finished
everything in
about 24
hours.
| 20Finished
3D
Printed
House
All the walls,
decorative
elements and
tower were printed
off-site, and then
assembled like a
Lego kit
It is estimated that
the use of 3D
printing technology
reduces the
construction
time by 8 to 12
times, which in
turn increases
efficiency and
reduces production
costs.
| 21Why
3D
Printing
for
Construction?
Ø Labor productivity in the Construction sector has been declining.
Ø Construction is the last remaining manufacturing sector to
not be automated. There is a large economic incentive to
change the way we build – and 3D Printing will become one
option.
Non-farm productivity index
Construction Productivity
indexImplications
of
3D
Printed
Structures?
The good news?
• Potential dramatic increase in labor productivity and reduced
time for construction and waste.
• Improved value proposition for wood in construction IF biomass
is the preferred substrate.
The bad news?
• Most of the substrate used for 3D printing is Polymers
(petrochemical plastics), metal alloys and modified cement.
• Biomaterials are currently less than 1% of the market.
| 23Answer
to
Question
#1?
Are key transformational technologies strengthening or
weakening the traditional competitive advantage of slow
growing temperate forests?
• It depends on the specific technology, but on balance they are
likely to decrease the traditional advantage of “strong-northern
fibers”
• Especially true with respect to
ü Next Generation Genomics
ü Tall-timber building
ü 3D Printing
• Less clear with respect to Biomaterials/Biochemicals, whose
applications may depend more on close co-operation & proximity
to major customers.
| 24Question
#2
Is renewable energy a meaningful opportunity for
the bio-products industry – or a potential threat?
| 25Isn’t
Bio-‐Energy
Unique?
Bio-energy is unique in that it:
• Creates base-load power which is dispatchable
• Generates relatively high employment compared to other
sources of renewable power.
ü ~5.5 permanent jobs per MW of capacity versus
0.7/MW for wind power and 0.2 for solar power.
• Can be converted into liquid fuels.
| 26Trend
in
Bio-‐Energy
Investment
Global Investment in Bio-energy ($US Billion),
2004-2016
Ø After peaking at over $US 50 billion in 2007, annual global investment
in bioenergy has trended down to ~$US 9 billion in 2016.
Ø An aggregate decline of ~80% over the last ten years, and the fall | 27
was even greater for liquid biofuels than power projects.Global
Investments
in
Bio-‐Power
Ø Investment down significantly from the recent peak in 2011 due to:
ü Low fossil fuel prices (natural gas & coal);
ü Uncertainty over feedstock supply & future price;
ü Falling prices of solar & wind energy; and,
ü Government efforts to rein in subsidies on renewable power.
Ø A few large coal-to-biomass conversions in Europe and Asia are still
being financed. Stand-alone plants are very challenging to finance.
Ø Smaller CHP plants are still being funded – especially where power
prices are relatively high.
Ø Some growth in wood pellet demand from Europe and Asia, but
forecasts have been revised downward.
Ø From a purely financial perspective, most bio-power
investments are not attractive.
. | 28Benchmark
Levelized Cost
of
Electricity:
H2 2016 ($/MWh)
Marine - wave
Marine - tidal
STEG - LFR
STEG - parabolic trough w/ storage
Nuclear (AMER)
STEG - tower & heliostat w/storage
Wind - offshore
Nuclear (EMEA)
Biomass - anaerobic digestion
Biomass - incineration
PV - c-Si tracking
Biomass - gasification
PV - thin film
PV - c-Si
Natural gas CCGT (EMEA)
CHP (AMER)
Coal fired (EMEA)
Municipal solid waste
Geothermal - binary plant
Natural gas CCGT (APAC)
CHP (EMEA)
Wind - onshore
Natural gas CCGT (AMER)
Small hydro
Large hydro
Coal fired (AMER)
Coal fired (APAC)
Geothermal - flash plant
Landfill gas
0 100 200 300 400 500 600
Source: Bloomberg New Energy Finance,
• There is a large variation in the cost of producing electricity across the
sources of electricity. (Also large variation within technologies)
• Bio-power is not the lowest cost source of electricity.
• This is a snap shot as of H2/2016, but what is the trend over time?Wind
and
Solar
Experience
Curves
SOLAR
PV
MODULE
COST
($/W) ONSHORE
WIND
LEVELISED
COST*
($/MWH)
100
1976 SOLAR
COSTS
HAVE
1,024
WIND
COSTS
HAVE
-0.30
y = 3,582.42x
FALLEN 1985
FALLEN
R² = 0.91
>99%
SINCE
1976 512 50%
SINCE
2009
1985
90%
since
2009
10 256
2003 2008
2009
128 1999
2025
1 2012 64
2016
2016 Learning rate = 19%
32
Learning
rate
24.3% 16
0.1
100 1,000 10,000 100,000 1,000,000
1 10 100 1,000 10,000 100,000 1,000,000
Cumulative capacity (MW)
Source: Bloomberg New Energy Finance, Maycock Source: Bloomberg New Energy Finance
• Dramatic cost reductions for solar and wind continue to be driven
by technological improvements and scaling of the supply chain.
• ….Largely due to the delivered cost of biomass, the cost of bio-
power has remained relatively flat over time.Unsubsidised
Clean
Energy
World
Records
Set
in
2016/17
Solar
PV Onshore
wind Offshore
wind
Country: Mexico Country: Morocco Country: Germany
Bidder: FRV Bidder: Enel
Green
Power Bidder: DONG/EnBW
Signed: September
2016 Signed: January
2016 Signed: April
2017
Construction:
2019 Construction: 2018 Construction: 2024
Price: US$
2.69
c/kWh Price: US$
3.0
c/kWh Merchant
Price: US$
4.9
c/kWh
• Note: The offshore wind merchant price is estimated based on project LCOE in real 2016 terms • Source: Bloomberg New Energy Finance; ImagesSiemens; Wikimedia Commons
By comparison, what is the typical cost of stand alone bio-
power plants? ~ US$ 10 c/kWh?Lithium-‐ion
Battery
Experience
Curve
($/kWh)
and
Cumulative
Capacity
2010-‐2030E
(GWh)
Lithium-‐ion
Battery
Price
Forecast .
• Source: Bloomberg New Energy Finance
• Cost of power storage fell by more than 70% from 2010-2016,
and is expected to drop by another 75% by 2030.
• Lower costs of storage are improving the value proposition for
| 32
intermittent sources of power like wind & solar PV vs biomassGlobal Investment in Biofuels, by Technology
Q1 2005–Q2 2015 ($m)
GLOBAL
INVESTMENT
IN
FIRST-‐GENERATION
35,000 GLOBAL
INVESTMENT
IN
NEXT-‐GENERATION
BIOFUELS, BIOFUELS,
30,000 3,000
25,000 2,500
20,000 2,000
15,000 1,500
10,000 1,000
5,000 500
0 0
2005
2006
2007
2008
2009
2010
2011
2012
2013
2014
2015
2005
2006
2007
2008
2009
2010
2011
2012
2013
2014
2015
• Investors are switching from First-Generation to Next-Generation Biofuels.
Large concern over ethanol’s blend wall constraint and food vs fuel debate.
• Almost $9 billion has been invested globally in developing Next
Generation biofuels over the past five years. The industry is emerging
beyond the initial stage.
Ø There are 12 small-scale next-generation commercial plants currently in
operationUS
Oil
Production
and
Rig
Efficiency
New-well Production per Rig US Monthly Oil Production (mbbl)
(bbl/day)
800 350
700 300 2007–17
2007–17
600 Up
83%
Up
1,300% 250
500
200
400
150
300
100
200
100 50
0
2007 2008 2009 2010 2011 2012 2013 2014 2015 2016 2017 2007 2008 2009 2010 2011 2012 2013 2014 2015 2016 2017
Source: EIA
• BUT - The technological revolution in fossil fuel extraction is still
under appreciated. It started in N. America, but has yet to be
meaningfully deployed around the world.
• True for oil……..US
Gas
Production
and
Rig
Efficiency
US monthly natural gas
New-well production per rig (‘000
production (bcf)
cf/day)
4,000 3,000
3,500 2007–17 2,500
3,000 Up
388%
2,000
2,500
2,000 1,500
1,500 2007–17
1,000
1,000
Up
35%
500
500
0 0
2007 2008 2009 2010 2011 2012 2013 2014 2015 2016 2017 2007 2008 2009 2010 2011 2012 2013 2014 2015 2016 2017
Source: EIA
• .....also true for natural gas
• Don’t bet that high fossil fuel prices will be what makes bio-
based fuels & chemicals more cost competitiveAnswer
to
Question
#2
Is renewable energy a meaningful opportunity for
the bio-products industry – or a potential threat?
• Combined Heat & Power (CHP) applications integrated into
bio-refineries continue to offer a compelling value proposition.
• Although there are local exceptions, bio-power is already
generally less competitive than other forms of renewable
power (eg., hydro, solar, wind).
• With improving battery storage technology, even liquid
biofuels will be threatened in the long-term.
| 36Question #3
Given demographic changes and low fossil fuel
prices, can governments afford to financially
support the production of clean bio-products?
| 37Is Carbon Pricing Enough?
Fundamental problem is that there is a disconnect between
the private and public value of bioenergy. Without some
form of gov’t intervention, we expect very few bioenergy
projects to be financially viable.
Carbon pricing? – right idea, but are levels high enough in
most countries to actually change behavior? No.
Ø In 2016, the three highest national carbon prices in the
world were $131 in Sweden, $86 in Switzerland and $65
in Finland.
Ø ….but only ~$25 in France, ~$23 in B.C., $13 in
California, $8 in China (Beijing Pilot), and $5 in EU ETS
| 38Options for Governments? Many countries still do not price carbon, and ~3/4 of the carbon emissions subject to carbon pricing in 2016 were priced below $10. UK Government estimates the Social Cost of Carbon to be in the range of $41-$124, with a central estimate of $83. If carbon pricing remains well below the Social Cost of Carbon, what are the best options? Most governments are under fiscal pressure, and the problem is likely to grow. • Rising cost of pensions, health care, etc. • The affordability of subsidies for the bio-economy will be a challenge. ”Smart Regulations” may be one option (eg., California’s | 39 Low Carbon Fuel Standard)
Focus on Fuel Standards

Renewable and Low Carbon Fuel Standards can play an
important role in stimulating investment in advanced biofuels

Fuel Standards can be viewed as a “Compliance Tool” as
opposed to an “Incentive Tool”.

•    Anecdotal evidence suggests the former are more stable
    than the latter, and thus tend to be more effective in
    driving investment due to lower regulatory risk over time.

Globally, the U.S.’s Renewable Fuel Standard 2 and
California’s Low Carbon Fuel Standard are likely the most
important and effective Fuel Standards.

                                                            | 40
U.S. Experience
40,000
RFS2 Blending Mandates 2016-2022
(millions of gallons)
35,000
30,000
25,000
20,000
15,000
10,000
5,000
0
2016 2017 2018 2019 2020 2021 2022
Corn
Ethanol Biodiesel
Advanced
Cellulosic
• RFS2 established mandates on the oil refining sector to integrate up to 36
billion gallons of specific types of renewable fuels by 2022.
• A plant-by-plant review suggests that over 80% of the global capacity in cellulosic
biofuels has been built in response to the RFS2 – including those plants in Canada
and Brazil.
• California has implemented a similar (but better) Low Carbon Fuel
Standard, which focuses on decreasing the Carbon Intensity of fuel in the State.| 41Value of the RFS2 and California LCFS to Investors:
Case Study of a Bio-Crude Oil Plant ($US)
• Given a $47/barrel market price of oil, prevailing C-RIN/ LCFS
Credit prices & an estimated Carbon Intensity of ~0.20 gCO2/MJ,
qualifying under the California/RFS2 regimes add an additional
$153/barrel in value – total comes to $200/barrel.
ü Fuel Value = $47 barrel;
ü RFS2 = $122/barrel;
ü California LCFS = $26/barrel;
ü California Cap & Trade Credit = $5/barrel
• The capital cost of a 75 million liter bio-crude plant is ~US$120
million, with an operating cost of ~$42/barrel – cash flow
positive, but not profitable without a subsidy.
ü BUT, it generates ~$80 million/year in regulatory savings (to be
shared between the bio-crude oil plant & oil refiner).
ü Significant incentive to produce bio-crude oil…..and it doesn’t
cost the public treasury.
| 42Answer to Question #3
Given demographic changes and low fossil fuel prices, can
governments financially support the production of clean bio-
products without over burdening the public treasury?
• It will be difficult. Production subsidies and tax breaks can be a
very significant tax burden.
• Meaningful carbon taxes are the best bet, but
ü Generally too low to change behavior (but not in Finland)
ü A competitive disadvantage for industry if not applied in other
countries.
• Targeted capital subsidies for R&D through to first commercial
plants can make sense. Gov’t procurement also has a role,
especially to establish an early market for emerging products.
• Explore “Smart regulations” which set Carbon Intensity targets,
are technology neutral, and create a ”credit market” involving
obligated parties so governments don’t have to pay. | 43Why
should
we
be
embracing
the
Bio-‐Economy?
Climate-related flood risk at Mar-a-Lago Club, Miami, Florida:
(i.e., President Trump’s ”Winter White House”)
Note: Blue areas
indicate risk of
flooding in 2045 2016
2030
Source: Coastal Risk Consulting © Mapbox, © OpenStreetMap Graphic: Jan Diehm/The Guardian
Don’t you want to save Donald’s golf course from flooding?
| 44.
APPENDIX:
U.S. INCENTIVES FOR LIQUID BIOFUEL
| 45U.S. Renewable Fuel Standard:
RIN Credit and Pricing Overview
Ø RFS2 credits are generated by displacing,
blending or processing fossil fuels with Historical
C-‐RIN
Pricing
(US$/C-‐RIN
Credit)
renewable fuel, yielding Renewable Identification
Numbers, or RIN Credits, which are used for
compliance
Ø Four types of RIN credits can be generated
based on the different types of biofuel that are
blended:
– Cellulosic Biofuel - C-RIN
– Biomass Based Biodiesel - B-RIN (Conventional Biodiesel)
– Advanced - A-RIN (Sugar cane ethanol, Renewable
Source:
OPIS
Diesel)
RFS2
Market
Value
per
Barrel
of
Biocrude
– Conventional - R-RIN (Corn Ethanol)
Ø C-RINS are the most valuable category of RINS, US$2.60
= US$122
and are primarily created when wood is used as Per
C-‐RIN Value
t
per
barrel
of
Biocrude
the feedstock. The price is strongly influenced by
a legislative formula that is inversely correlated to
oil prices – this provides a premium over other
RIN categories.
.
Ø Unlike the price of R-RINS (corn ethanol), that of
C-RINS did not drop in response to the U.S.
election….investors perceive less political risk.
54California Low Carbon Fuel Standard (LCFS):
Credit and Pricing Overview
Historical
LCFS
Credit
Pricing
(US$/MTCO2e)
• LCFS credits are measured in Metric Tonnes of
Carbon Dioxide Equivalent (MTCO2e) and priced
in US$
• LCFS credit trading is currently limited to
primary market trading between obligated
parties and producers of credits
• LCFS credit prices have averaged US$90 over
the last year, US$89 over the last two years and Source:
OPIS
are currently priced at US$70
LFCS
Value
per
Barrel
of
Biocrude
• LCFS credit prices are expected to rise further
due to the high marginal costs of compliance in US$90
= US$26
the transportation fuels sector Per
MTCO2e Value
Per
barrel
Biocrude
• LCFS credit prices are capped at a US$200
ceiling which is increased each year by a CPI
factor
.
56California Cap and Trade:
Allowance Credit and Pricing Overview
• The instrument used to measure emissions Historical
Cap
and
Trade
Credit
Pricing
(US$/MtCO2e)
reductions under the California Cap and Trade
program is referred to as Allowances. Allowances
are denominated in dollars per Metric Ton of
Carbon Dioxide Equivalent (US$/MTCO2e)
• The Quebec and California Cap and Trade
Programs are now linked, and Ontario’s will be
linked next year.
• California’s Cap and Trade system started with a Source:
California
Air
Resources
Board
price floor in 2012 of US$10.00, which is
escalated each year by 5% plus the CPI inflation C&T
Value
per
Barrel
of
Biocrude
to
Project
factor, ensuring a growing compliance cost
• Market prices for Allowances averaged
US$15 = US$5
Value
per
barrel
of
Biocrude
~US$15/MTCO2e in July/August 2017. Per
MTCO2e
• The carbon price will likely trend higher since:
– The transportation sector is now covered
under the California program and free
allocations of emissions credits are
mandated to decline .
– The Ontario market is expected to be short
of credits.
58You can also read