Woven Natural Fibre Reinforced Composite Materials for Medical Imaging - MDPI
←
→
Page content transcription
If your browser does not render page correctly, please read the page content below
materials
Article
Woven Natural Fibre Reinforced Composite Materials
for Medical Imaging
Robert H. Morris 1, *, Nicasio R. Geraldi 1 , Johanna L. Stafford 1 , Abi Spicer 1 , James Hall 1 ,
Christopher Bradley 2 and Michael I. Newton 1
 1   School of Science and Technology, Nottingham Trent University, Nottingham NG11 8NS, UK;
     nicasio.geraldi02@ntu.ac.uk (N.R.G.); johanna.stafford2016@my.ntu.ac.uk (J.L.S.);
     abi.spicer02@ntu.ac.uk (A.S.); jim.hall@ntu.ac.uk (J.H.); michael.newton@ntu.ac.uk (M.I.N.)
 2   Faculty of Science, University of Nottingham, Nottingham NG7 2RD, UK;
     christopher.bradley@nottingham.ac.uk
 *   Correspondence: rob.morris@ntu.ac.uk

 Received: 7 March 2020; Accepted: 1 April 2020; Published: 4 April 2020

 Abstract: Repeatable patient positioning is key to minimising the burden on planning radiotherapy
 treatment. There are very few materials commercially available which are suitable for use in all
 common imaging and treatment modalities such as magnetic resonance imaging (MRI), X-Ray
 computed tomography (CT) and radiotherapy. In this article, we present several such materials
 based on woven natural fibres embedded in a range of different resin materials which are suitable
 for such applications. By investigating a range of resins and natural fibre materials in combination
 and evaluating their performance in terms of MRI and X-Ray imaging, we show that a woven cotton
 material impregnated with a two-part epoxy resin provides a 15% improvement in passage of X-Rays
 and has no impact on the MRI signal (unlike the 40% MRI signal attenuation from carbon fibre),
 whilst also retaining a flexural modulus up to 71% of that of carbon fibre. These results demonstrate
 that natural fibre composites produced using such materials provide desirable properties for use in
 patient support and positioning devices for multi-modal imaging, without the need to significantly
 compromise on the strength of the material.

 Keywords: natural fibre composite; magnetic resonance imaging; radiotherapy; X-Ray; woven;
 medical imaging

1. Introduction
     As cancer treatments are becoming increasingly advanced, there is a growing demand for treatment
plans to be based upon images from more than one imaging modality [1,2]. The repeatable positioning
of patients in the different modalities has required that flat patient supports, also referred to in
the literature as table tops, be made available for the range of different manufacturers’ machines.
These supports are optimised for the individual modalities, meaning that the same patient support
cannot simply be moved between machines which would allow for optimum positioning. In addition,
they must have sufficient strength and be light enough for safe and convenient operator removal.
Current materials used in the production of patient supports include carbon fibre and glass fibre
composites [3,4]. In a recent article [5] we presented a composite comprising wood pulp-derived fibres
embedded in polyester resin and bonded to expanded polystyrene cores. We compared these to the
standards of glass fibre reinforced honeycomb cored composite (GFC) and carbon fibre reinforced
composite (CFC). The new material outperformed them both in terms of Magnetic Resonance Imaging
(MRI) Radio Frequency (RF) shading and distortion. It gave similar performance to the CFC with regard
to megavoltage imaging homogeneity and outperformed the GFC by 56%. This natural fibre-based

Materials 2020, 13, 1684; doi:10.3390/ma13071684                               www.mdpi.com/journal/materials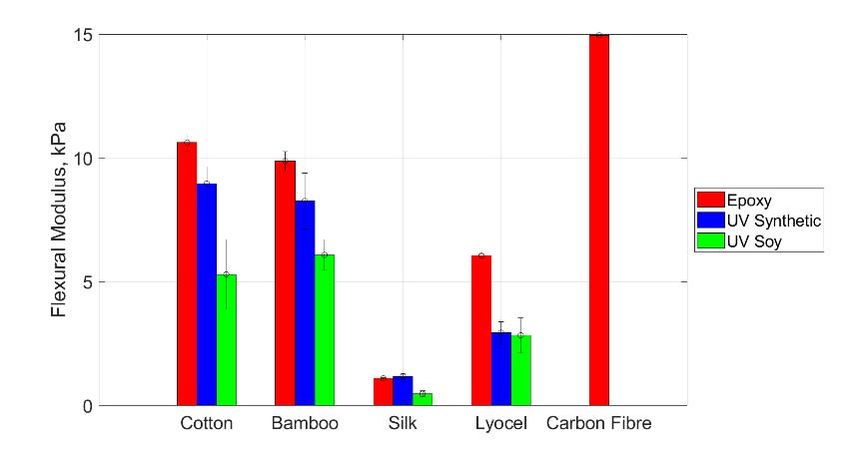
Materials 2020, 13, 1684                                                                             2 of 10

composite had somewhat poorer performance in mechanical testing but still performed within the
required limits. It should be noted that contact between the patient and these materials is minimal
since they are typically covered in a disposable paper roll which is changed between the patients who
are typically clothed. Where contact is expected, it is typically less than 30 minutes.
     Composites are an important class of materials which by definition are formed by the combination
of two dissimilar materials to produce a new, with better properties than the individual components.
The most common composite materials are formed by combining a thermoset resin, such as a two-part
epoxy, as a binder, with some form of filler as a matrix. There are, however, a wide range of composite
materials known and commercially available, ranging from cement binders loaded with amorphous
SiO2 nanospheres [6] or fly ash [7] for use in construction, down to composite bearings for machine
tooling (miler). Composites are also used to replace components, such as the bearings in the last
example, in environments where corrosion of metals would normally limit use, such as in sea water [8].
Composites can also be produced from waste materials such as earthquake resistance isolators produced
using fibre reinforced recycled rubber [9]. Within a clinical setting, composites have been replacing
their ceramic counterparts for a number of decades in dental work [10] and in more recent years for
the production of hip replacement hip implants [11].
     With an ever-growing focus on the environmental impact of materials and processes, using natural
fibres as the filler or matrix in composite materials has become more commonplace. Natural fibres
can be plant based, such as flax, jute, cotton, or bamboo, or animal derived, such as silk and wool.
Many natural fibres have drawbacks, such as being less homogeneous than glass or carbon fibres,
higher in moisture absorption and lower compatibility with conventional resins [12–16]. Most natural
fibres are, however, more eco-friendly and biodegradable than their synthetic counterparts.
     Unlike other studies into natural fibre composites, we focus on the need to reduce x-ray attenuation
and maintain MRI compatibility so we expect to require some compromise on mechanical metrics.
In this article we investigated a range of natural fibres combined with an ultraviolet (UV) photocuring
soy-based resin, which we compare to conventional epoxy and a fully synthetic (UV) photocuring
resin to determine the viability of creating a composite material based on natural components.

2. Materials and Methods
     A full assessment of the trade-off between imaging performance and mechanical properties was
undertaken on a range of samples. The steps needed to process the materials and the techniques used
to assess their performance are detailed in this section.

2.1. Material Processing
      A range of sheet materials produced from natural fibres were acquired to allow for the influence
of the composition to be determined. Materials tested are detailed in Table 1. A brushed cotton was
initially also tested but the composites which it produced were far too thick to be of relevance for
such a product. A range of coatings were applied to such materials during production to achieve
desirable qualities for the end user which interfered with the process of creating composite materials.
To address this, all materials were boiled in tap water for 10 minutes. These sheet materials all had
relatively tight weaves with varying levels of fibre smoothness. The ultimate strength of the composite
material was dependent on a number of factors, including: the quantity of resin per unit area; the
extent to which the resin keyed into the fibres (which increased with fibre roughness); and the overall
strength of the fibre reinforcement. To improve the ability of the resin to penetrate into the fibre matrix,
we investigated the use of a sodium hydroxide solution to modify the surface structure of the fabric
sheets (known in the textile industry as mercerization) based on two methods in the literature [17,18].
A highly concentrated solution (4.5 mol.dm−3 ) was made up with water in which the range of materials
was bathed for either 30 seconds or between 1 and 5 minutes in 1-minute intervals. The effect on the
fibres was then determined using a tensile test and scanning electron microscopy. For comparison
Materials 2020, 13, 1684 3 of 10
purposes, a sample of carbon fibre composite material was also prepared using the epoxy resin (since
UV curing is not possible with black opaque materials).
Table 1. Details of matrix materials selected.
Material Name Composition Source Planar Density
Silk 100% Habotai Silk Midland Textiles, Birmingham, UK 35 gsm
Cotton 100% Egyptian Cotton Sainsburys, London, UK 120 gsm
Lyocel 40% Lyocel 60% Cotton IKEA, Milton Keynes, UK 120 gsm
Bamboo 100% Bamboo Fibre Bamboo Panda Textiles, Cheshire, UK 160 gsm
Carbon Fibre 100% Carbon Fibre EasyComposites, Staffordshire, UK 200 gsm
2.2. Assessment of Fabric Properties
Scanning electron microscopy was undertaken (Model Number JSM-7100F, Jeol, Tokyo, Japan) for
10mmx10mm squares of each material which were mounted onto 10mm round stubs with carbon tape
and sputter coated (Q150R ES, Quorum Technologies Ltd, Sussex, UK) with 4nm of gold. Each stub was
in turn placed into the Scanning Electron Microscope (SEM) chamber and imaged at 100× magnification.
Images were acquired with an isotropic resolution of 1µm.
The tensile strength of 30mm wide samples, prepared in accordance with ISO standard 13924, was
tested for elongation and breaking force using an automated testing rig (6000R, Lloyd Instruments,
Hampshire, UK) with a 3 kN head (NLC, Lloyd Instruments, Hampshire, UK). Data were acquired
using a USB multifunction I/O computer interface (USB-6210, National Instruments, Austin, TX, USA)
with a custom software interface to log the results (produced in LabView, National Instruments,
Austin, TX, USA). Samples were acquired with 14-bit precision with full scale represented by the
maximum load of the head. Thus, for these measurements, we had a resolution of 18 mN. A single
sodium hydroxide processing time was then selected for each material based upon the balance between
increasing fibre roughness and reducing tensile strength. Samples were tested in triplicate.
2.3. Composite Creation
Composite sheets were then created from each of the natural fibre composites which had been
boiled for 10 minutes in tap water and also for sheets processed in sodium hydroxide for a time as
determined in the previous section. Four layers of the natural fibre sheet of interest were placed
on a flat high-pressure laminate surface which had been waxed using Meguiar’s #8 Mirror Glaze
Mould Release Wax (EasyComposites, Staffordshire, UK) for epoxy resins or glass for UV curing
resins. A layer each of peel ply, infusion mesh and single use vacuum bag film (PP230 Aero-Grade
Nylon 66, FM100 Infusion Mesh and VB200 Vacuum Bagging Film respectively, all Easy Composites,
Staffordshire, UK) were placed on top and sealed to the high pressure laminate using gum tape. For the
epoxy samples, epoxy resin was then mixed with a fast hardener as detailed in Table 2 and drawn into
the dry layup using a vacuum pump (6i, Edwards, West Sussex, UK). Once the resin had permeated all
of the fabric, the inlet and outlet were clamped off and the system was left to cure for 24 hours at room
temperature. For the UV samples, either white synthetic based resin or a soy-based resin, also detailed
in Table 2, was drawn into the fabric in the same way without the use of infusion mesh to allow for
maximum penetration of UV light. After clamping, it was cured for 10 minutes under ultraviolet light
using a custom-built assembly of 6 UV tubes (TLAD 15W/05, Phillips, Netherlands) while held under
vacuum. These processes resulted in a composite material in which the natural fibres were fully sealed.
Final products would however ultimately be sealed with a non-porous lacquer for the purposes of
infection control.Materials 2020, 13, 1684 4 of 10
Table 2. Details of resins used in composite formation.
Resin Name Type Source Curing Type
Epoxy Infusion-IN2 Easy Composites, Staffordshire, UK Two-Component chemical
Synthetic Resin 3D printer-FLGPWH01 Formlabs, Somerville, MA, USA UV
Soy-based resin 3D printer–Eco UV Resin Anycubic, Shenzhen, China UV
2.4. Evaluation of Mechanical Properties
The mechanical properties of the resulting composite skins were tested using the same testing
machine as for fabric evaluation in compression mode with a 20N head (DLC, Lloyd Instruments,
Hampshire, UK) using a standardised 3-point bend fixture. The Flexural modulus is calculated
according to Equation (1).
L3 m
Ef = (1)
4bd3
where L, m, b and d are the support span (50 mm with 10 mm diameter soft points), the gradient of the
linear portion of the deflection curve, the width of the test sheet (20 mm) and the thickness of the test
sheet, respectively. The higher the flexural modulus, the stiffer the material. Samples were tested in
duplicate from different areas of the sample.
2.5. Clinical Imaging Assessment
Images of 6-well plates (140675, Sarstedt, Nümbrecht) with each well placed above a different
sample of composite skin (or without composite in the case of controls) were acquired using a Philips
Achieva 3T MRI system and a Siemens Avanto 1.5T MRI system. The wells were filled with 2ml of fluid
as used in the ACR phantom [19] (a common calibration phantom used for MRI which replicated the
properties of human tissue in terms of conductivity and relativity) and imaged coronally. The signal
from each well was divided by the signal in the absence of sample to provide a ratio. If there was any
distortion or signal loss caused by the material, then this would be less than 1 (within error). Samples
were tested in duplicate.
X-ray attenuation was assessed using a benchtop X-ray imaging system (554 801 with 554 821,
Leybold UK ltd, Chessington, UK) at 35 kV and 1mA filament current. Samples of 2 cm width were
stacked in a stepped arrangement with heights from 3 to 6 cm to provide a range of thicknesses in
a single image. The mean signal from each of the overlapping materials was used to determine the
attenuation coefficient as the gradient of the signal intensity against the natural log of the thickness.
Error bars represented the mean plus and minus 5 standard deviations within the measurement area.
Data were collected and averaged from pixel values in a wide strip encompassing 80% of the sample
width for samples in duplicate.
3. Results
3.1. SEM
The SEM images for each of the fibre types are collected (SEM Model Number JSM-7100F, Jeol,
Tokyo, Japan) and shown in Figure 1 for immersion times of 30 s, 2 minutes and 5 minutes in sodium
hydroxide to demonstrate the evolution of the matrix over time. All images are shown at 100×
magnification to provide an overview of both the bulk surface topography and the morphology of the
individual yarns that comprise the fabrics.
It can be seen from Figure 1 that there is a variable effect of sodium hydroxide, with the most
pronounced effect present on the bamboo fibres while silk experiences negligible change. Where
changes are seen, they are similar between fibres within an individual yarn; initially swelling then
appearing to merge together, ultimately eroding. The effect on the tensile strength of this process was
then investigated.magnification to provide an overview of both the bulk surface topography and the morphology of
the individual yarns that comprise the fabrics.
It can be seen from Figure 1 that there is a variable effect of sodium hydroxide, with the most
pronounced effect present on the bamboo fibres while silk experiences negligible change. Where
changes2020,
Materials are13,
seen,
1684 they are similar between fibres within an individual yarn; initially swelling5then
of 10
appearing to merge together, ultimately eroding. The effect on the tensile strength of this process
Figure 1. Time course of the effect of of sodium
sodium hydroxide
hydroxide on natural
natural fibres. Labels on the left refer to
all images in
in that
thatrow.
row. The
Thetime
timeininseconds
secondsofofexposure
exposure detailed
detailed across
across thethe
toptop
of of
thethe figure
figure refer
refer to
to all
all images
images in that
in that column.
column. The
The redred scale
scale bar
bar ininthe
thebottom
bottomright
rightrepresents
representsaalength
lengthofof 500μm
500µm on the
images, all of which have the same scale.
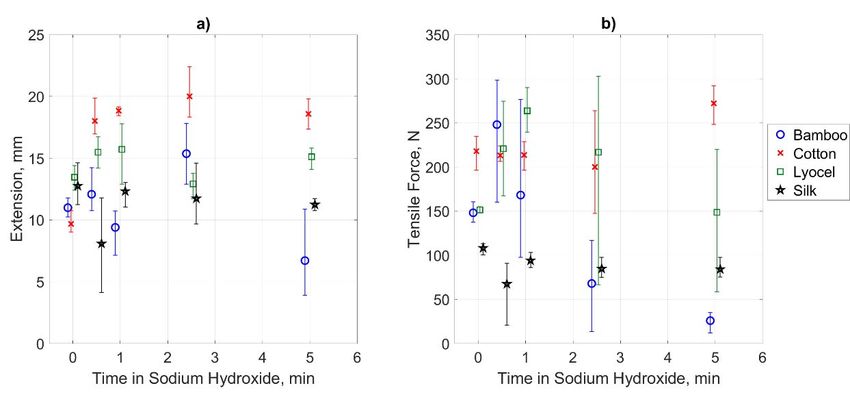
3.2. Fabric Tensile
3.2. Fabric Tensile Testing
Testing
The
The results
resultsofofthe tensile
the testing
tensile are are
testing shownshownin Figure 2, with
in Figure 2, range
with bars
range forbars
the triplicate samples.
for the triplicate
This verifies the findings of the SEM imaging with a variable effect on the fibre
samples. This verifies the findings of the SEM imaging with a variable effect on the fibre strength. strength. The bamboo,
as
Theexpected
bamboo,from the significant
as expected from thechange in morphology,
significant change insees the greatestsees
morphology, change in tensilechange
the greatest strength
in
which
tensile initially
strengthincreases before significantly
which initially increases before falling to becomefalling
significantly the weakest sample.
to become the Its ductility
weakest does
sample.
not change significantly
Its ductility does not change as indicated
significantlyby as
relatively
indicated constant extension
by relatively at break.
constant The at
extension cotton
break.has a
The
consistent
cotton hasand significantand
a consistent breaking strength,
significant whilststrength,
breaking the silk has a consistent
whilst the silk but
haspoor breakingbut
a consistent strength.
poor
The ductility of the cotton is however, almost doubled by treatment with sodium
breaking strength. The ductility of the cotton is however, almost doubled by treatment with sodium hydroxide for any
duration,
hydroxidewhilst
for anythe duration,
silk retainswhilst
a similar
the ductility.
silk retainsFinally, the lyocel
a similar sample
ductility. experiences
Finally, an increased
the lyocel sample
breaking force for intermediate treatment times and retains similar ductility
experiences an increased breaking force for intermediate treatment times and retains similar throughout.
Based
ductility on these findings, the bamboo, cotton, lyocel and silk will be treated for 30 seconds,
throughout.
300 seconds,
Based on60these
seconds and 30the
findings, seconds,
bamboo, respectively,
cotton, lyocel in the
andfollowing
silk willsample
be treatedproduction.
for 30 seconds, 300
seconds, 60 seconds and 30 seconds, respectively, in the following sample production.Materials
Materials2020, 13,13,
2020, x FOR
1684 PEER REVIEW 6 of 1110
6 of
Materials 2020, 13, x FOR PEER REVIEW 6 of 11
Figure
Figure2.2. (a) Breaking force
(a) Breaking forceofof fabric
fabric samples
samples as a as a function
function of timeofintime in hydroxide.
sodium sodium hydroxide. (b)
(b) Elongation
Figure 2. (a) Breaking force of fabric samples as a function of time in sodium hydroxide. (b)
Elongation at breaking
at breaking force. force.
Elongation at breaking force.
3.3.Three
3.3. ThreePointPointBend
BendTest
TestofofSkins
Skins
3.3. Three Point Bend Test of Skins
Thefull
The fullthree‐point
three-pointbend bend test
test results
results are areshown
shownininsupplementary
supplementary information
information Figure
Figure S1.S1.There was
There
no The full three‐point
significant difference bend testthe
between results
samples arewhich
shownwere in supplementary
treated in sodium information
hydroxide Figure
and S1. There
those which
was no significant difference between the samples which were treated in sodium hydroxide and
was
wereno not. significant
This would difference
suggest between
thatsuggest the of
the role samples which were treated in sodium hydroxide and
those which were not. This would thatthe
thefibre
role morphology has little
of the fibre morphology impact on
has little the resulting
impact on
those which
flexural were
modulus. not.
As This
such, would
the twosuggest
data that
sets the
are role of
averaged the fibre
to morphology
provide greater has
ease little
in impact
interpretingon
the resulting flexural modulus. As such, the two data sets are averaged to provide greater ease in
the
otherresulting
findings, flexural modulus.
thefindings,
results of whichAs are
such, the twoFigure
data sets
3. Itinare averaged to provide is agreater ease in
interpreting other the results ofshown
whichinare shown can be seen
Figure 3. Itthat
canthere
be seen dependence
that there is aof
interpreting
the flexuralof other
modulus findings,
primarilythe results
on resin of which
type with are shown
epoxytype in
resin Figure
yielding3. It can be seen that there is a
dependence the flexural modulus primarily on resin with epoxythe resinhighest flexural
yielding the modulus
highest
dependence
followed of the flexural
by the followed
syntheticby modulus
UV primarily on resin type with epoxy resin yielding the highest
flexural modulus theresin, followed
synthetic by thefollowed
UV resin, soy-based UV soy‐based
by the resin in allUV cases
resin other
in allthan
casesfor
flexural
the silk. modulus followed by the synthetic UV resin, followed by the soy‐based UV resin in all cases
other than In forthis case,Inhowever,
the silk. this case,the resulting
however, thematerials
resulting are all very
materials arethin in comparison
all very to the other
thin in comparison to
other
fabric than
types, forresulting
the silk. Inin this
less case,
overallhowever,
difference the between
resultingthe materials
samples. areTheall very thin in comparison
relationship between to
these
the other fabric types, resulting in less overall difference between the samples. The relationship
the other
values fabric
isthese
not types, resulting
significantly in less
influenced byoverall
dividing difference
them between thedensity,
samples. The relationship
between values is not significantly influenced bybydividing
the samplethem by thesuggesting
sample density, that the
between these
overall stiffness values
is indeedis not significantly influenced by dividing them by the sample density,
suggesting that the overall due to the
stiffness is interplay
indeed due between
to the the fabric matrix
interplay between andtheresin
fabricand not simply
matrix and
suggesting
dependent that
on thequantity
the overall of stiffness
the is indeed
resin. The due fibre
carbon to thehasinterplay
a higher between
flexural the fabricthan
modulus matrix
the and
other
resin and not simply dependent on the quantity of the resin. The carbon fibre has a higher flexural
resin and not
materials, with simply
theother dependent
next on the from
highest coming quantity of the cotton
the highest
epoxy resin. The carbon
material at 71% fibreofhas a higher flexural
modulus than the materials, with the next coming from the epoxyits value.
cotton Range
material bars
at
modulus
are of
shown than the
in theRangeother materials,
figure,bars
encompassing with the next highest coming from the epoxy cotton material at
71% its value. are shownall inreadings
the figure, for encompassing
that class of sample to highlight
all readings for thatthe variation
class of
71% of
which to its value.
is experienced. Range bars are shown in the figure, encompassing all readings for that class of
sample highlight the variation which is experienced.
sample to highlight the variation which is experienced.
Figure 3. Comparison of the flexural modulus of samples produced using different resin and matrix
Figure
types.3.Range
Comparison
bars areof the flexural
presented basedmodulus of samplesfrom
on measurements produced usingin
all samples different resin
that class, e.g.,and
thematrix
average
Figure 3. Comparison of the flexural modulus of samples produced using different resin and matrix
and range
types. Rangebars
barsonare
thepresented
epoxy cotton data
based onare based on measurements
measurements of bothinrepeats
from all samples of both
that class, e.g.,weave
the
types. Range bars are presented based on measurements from all samples in that class, e.g., the
directions
average andwith and
range without
bars on thesodium hydroxide
epoxy cotton data treatment, representing
are based on eightof
measurements samples.
both repeats of both
average and range bars on the epoxy cotton data are based on measurements of both repeats of both
weave directions with and without sodium hydroxide treatment, representing eight samples.
weave directions with and without sodium hydroxide treatment, representing eight samples.
3.4. Clinical Imaging
3.4. Clinical ImagingMaterials 2020, 13, 1684 7 of 10
3.4. Clinical Imaging
The results of the clinical imaging assessments are plotted against flexural modulus in Figure 4 to
allow their overall performance to be predicted for clinical use. The most desirable position for the
CT data plotted in Figure 4a is the bottom right hand corner, which represents a material with high
flexural modulus and minimal X-Ray attenuation. It can be seen that all samples, with the exception of
soy resin with a silk matrix, outperform carbon fibre in terms of X-Ray translucency. The epoxy cotton
composites offer
Materials 2020, the maximum
13, x FOR strength, while the minimal attenuation is seen for the synthetic
PEER REVIEW 8 of 11 UV
resin with bamboo.
4. Overview
Figure Figure of performance
4. Overview of performanceforfor
X-ray
X‐ray(top)
(top)and
and magnetic resonance
magnetic resonance imaging
imaging (MRI)(MRI) (bottom) as
(bottom)
a function
as aof flexural
function of modulus. The optimum
flexural modulus. The optimumposition for X-Ray
position is bottom
for X‐Ray right,
is bottom thetheoptimum
right, optimumposition
for MRIposition for MRIColours
is top right. is top right. Coloursdifferent
represent represent fibres
different
asfibres as detailed
detailed in thein the legend.
legend. TheThe shapes
shapes represent
represent
different resins as different resins
follows: as follows:
circles circles (O)
(O) epoxy, epoxy,()
squares squares (□) synthetic
synthetic UV, diamond
UV, diamond (3) soy(◇) UV.
soy Finally,
UV. Finally, untreated are open and treated are filled.
untreated are open and treated are filled.
4. Discussion
There is some correlation between the breaking force of the unimpregnated fabrics and the
resulting flexural moduli of the composites. The variance is, however, too high to be able to
accurately predict the behaviour of the final composite. These data are shown in the supplementaryMaterials 2020, 13, 1684 8 of 10
The results of the MRI experiments at 1.5T are plotted in Figure 4b again against the flexural
modulus. The optimum position on this plot is the top right-hand corner, representing minimal
attenuation of the MRI signal as a result of RF shading with the highest flexural modulus. The dotted
lines on the plot represent the range of values which have been found for the control samples owing
to the spatial variation in the RF and static magnetic field homogeneities. It can be seen that all
natural fibre composite samples fall within this range, demonstrating the minimal effect which it
has on the RF reaching the fluid. The carbon fibre, on the other hand, is below the minimum value,
demonstrating that it is less suitable for MRI imaging. The results from the 3T imaging system are
shown in supplementary information Figure S2. Although they have more scatter than the 1.5T system,
owing to greater distortion of the static magnetic field over the imaging region, the natural fibre
composites all fall within the range of the controls in contrast to the carbon fibre.
4. Discussion
There is some correlation between the breaking force of the unimpregnated fabrics and the
resulting flexural moduli of the composites. The variance is, however, too high to be able to accurately
predict the behaviour of the final composite. These data are shown in the supplementary material
Figure S3. In terms of medical imaging performance, all-natural fibre composite materials which have
been produced, with the exception of the soy resin in silk, outperform the carbon fibre samples in
terms of X-Ray attenuation and MRI RF shading. The flexural modulus of the carbon fibre exceeds that
of all-natural fibre composites. The epoxy cotton provides the highest flexural modulus of the natural
fibre composites at 71% of the value of carbon fibre. There is little to distinguish the performance of
the bamboo and cotton composites, thus for practical applications the trade-off between strength and
X-ray performance must be individually determined.
The optimum materials for use are either epoxy-impregnated cotton, offering the highest flexural
modulus, or synthetic UV resin-impregnated bamboo, which offers the minimum X-Ray attenuation
without significant compromise of flexural modulus. Further investigation of these materials, partnered
with a suitable supportive internal core, to create a multilayer composite material are needed to fully
conclude on the suitability to produce a complete support structure. However, since many of the
resulting properties of such materials are heavily dependent on the skin, these two candidates are
likely to yield useful structural pieces with most core materials which are readily available.
The so-called mercerization process of bathing the fabrics in a concentrated solution of sodium
hydroxide was found to have minimal impact on the resulting properties of the composite materials.
Where a difference was seen, it did not result in an improvement of the final composite material in
terms of strength or imaging performance.
In all cases except for silk, the epoxy resins result in the highest flexural moduli. The soy-based
UV curing resin, on the other hand, was found in this usage case to perform poorly and produce
composite materials which are not well suited to applications in patient support for medical imaging
and treatment.
5. Conclusions
We have demonstrated through tensile testing, three-point bend assessment of flexural modulus
and clinical imaging using MRI and X-ray that natural fibre composites represent an exciting alternative
to the ubiquitous carbon fibre skin in exchange for a slight reduction in flexural modulus.
The optimum materials were found to be unmercerized cotton or bamboo-based fibres infused
with an epoxy or UV matrix respectively, providing minimal visibility on all modalities and a flexural
modulus at 71% that of carbon fibre.
Such materials will allow for the production of multimodal composite patient positioning devices
thanks to their suitability for use in MRI and X-Ray applications with minimal impact on the resulting
images. This will address a growing need in radiotherapy treatment planning for a truly multimodal
patient positioning and support device.Materials 2020, 13, 1684 9 of 10
6. Patents
A patent has been filed (PCT/GB2020/050449) for the natural fibre composite materials with a
manufacturer of patient positioning products, Medibord Ltd.
Supplementary Materials: The following are available online at http://www.mdpi.com/1996-1944/13/7/1684/s1,
Figure S1: Comparison of treated and untreated samples for compressional testing, Figure S2: MRI data collected
at 3T plotted as a function of flexural modulus for each of the material samples, Figure S3: Comparison between
the tensile force of the fabric and the resulting flexural modulus of the composites.
Author Contributions: R.H.M.—Concept of study, experimental design, data analysis; N.R.G.—Experimental
Design, SEM imaging, X-Ray Imaging, production of Epoxy samples; J.L.S.—Production of UV cured resin samples,
A.S.—1.5T MRI imaging, X-Ray Imaging; J.H.—Preparation of samples for tensile testing and treatment of fabrics;
C.B.—3T MRI imaging, M.I.N.—Concept of study, Experimental Design. All authors have read and agreed to the
published version of the manuscript.
Acknowledgments: The authors wish to extend their thanks to Mike Perkins for the creation of test fixtures for
tensile and compressional testing.
Conflicts of Interest: This work is covered under the above patent with a manufacturer of patient positioning
products, Medibord ltd who had no role in the design of the study; in the collection, analyses, or interpretation of
data; in the writing of the manuscript, or in the decision to publish the results.
References
1. Pereira, G.C.; Traughber, M.; Muzic, R.F. The Role of Imaging in Radiation Therapy Planning: Past, Present,
and Future. BioMed Res. Int. 2014, 2014, 1–9. [CrossRef] [PubMed]
2. Rehman, J.U.; Zahra; Ahmad, N.; Khalid, M.; Asghar, H.N.U.H.K.; Gilani, Z.A.; Ullah, I.; Nasar, G.;
Akhtar, M.M.; Usmani, M.N. Intensity modulated radiation therapy: A review of current practice and future
outlooks. J. Radiat. Res. Appl. Sci. 2018, 11, 361–367. [CrossRef]
3. Jafar, M.M.; Reeves, J.; Ruthven, M.; Dean, C.; MacDougall, N.D.; Tucker, A.T.; Miquel, M. Assessment of
a carbon fibre MRI flatbed insert for radiotherapy treatment planning. Br. J. Radiol. 2016, 89, 20160108.
[CrossRef] [PubMed]
4. Langmack, K. The use of an advanced composite material as an alternative to carbon fibre in radiotherapy.
Radiogr. 2012, 18, 74–77. [CrossRef]
5. Morris, R.; Trabi, C.L.; Spicer, A.; Langmack, K.; Boersma, W.; Weightman, J.S.; Newton, M.I. A natural fibre
reinforced composite material for multi-modal medical imaging and radiotherapy treatment. Mater. Lett.
2019, 252, 289–292. [CrossRef]
6. Szymanowski, J.; Sadowski, Ł. Functional and adhesive properties of cement-based overlays modified with
amorphous silica nanospheres. J. Adhes. 2019, 96, 207–228. [CrossRef]
7. Golewski, G. Estimation of the optimum content of fly ash in concrete composite based on the analysis
of fracture toughness tests using various measuring systems. Constr. Build. Mater. 2019, 213, 142–155.
[CrossRef]
8. Miler, D.; Škec, S.; Katana, B.; Žeželj, D. An Experimental Study of Composite Plain Bearings: The Influence
of Clearance on Friction Coefficient and Temperature. Stroj. Vestn. J. Mech. Eng. 2019, 547–556. [CrossRef]
9. Chen, B.; Wang, J.; Yan, F. Comparative investigation on the tribological behaviors of CF/PEEK composites
under sea water lubrication. Tribol. Int. 2012, 52, 170–177. [CrossRef]
10. Sengsri, P.; Marsico, M.R.; Kaewunruen, S. Base isolation fibre-reinforced composite bearings using recycled
rubber. IOP Conf. Ser. Mater. Sci. Eng. 2019, 603, 022060. [CrossRef]
11. Gresnigt, M.M.; Cune, M.; Jansen, K.; Van Der Made, S.; Özcan, M. Randomized clinical trial on indirect
resin composite and ceramic laminate veneers: Up to 10-year findings. J. Dent. 2019, 86, 102–109. [CrossRef]
[PubMed]
12. Bandoh, S. The Development of Composite Stem for Hip Joint: 2 Design Concepts. In Proceedings of the
16th International Conference on Composite Materials, Kyoto, Japan, 8–13 July 2007.
13. Faruk, O.; Bledzki, A.K.; Fink, H.-P.; Sain, M. Biocomposites reinforced with natural fibers: 2000–2010.
Prog. Polym. Sci. 2012, 37, 1552–1596. [CrossRef]
14. Faruk, O.; Bledzki, A.K.; Fink, H.-P.; Sain, M. Progress Report on Natural Fiber Reinforced Composites.
Macromol. Mater. Eng. 2013, 299, 9–26. [CrossRef]Materials 2020, 13, 1684 10 of 10
15. Sanjay, M.; Madhu, P.; Jawaid, M.; Senthamaraikannan, P.; Senthil, S.; Pradeep, S. Characterization and
properties of natural fiber polymer composites: A comprehensive review. J. Clean. Prod. 2018, 172, 566–581.
[CrossRef]
16. Gholampour, A.; Ozbakkaloglu, T. A review of natural fiber composites: Properties, modification and
processing techniques, characterization, applications. J. Mater. Sci. 2019, 55, 829–892. [CrossRef]
17. Zhang, K.; Wang, F.; Liang, W.; Wang, Z.; Duan, Z.; Yang, B. Thermal and Mechanical Properties of Bamboo
Fiber Reinforced Epoxy Composites. Polymer 2018, 10, 608. [CrossRef] [PubMed]
18. Siroky, J.; Blackburn, R.; Bechtold, T.; Taylor, J.; White, P. Alkali treatment of cellulose II fibres and effect on
dye sorption. Carbohydr. Polym. 2011, 84, 299–307. [CrossRef]
19. Clarke, G.D. Overview of the ACR MRI Accreditation Phantom. 1999. Available online: https://www.aapm.
org/meetings/99AM/pdf/2728-58500.pdf (accessed on 15 January 2020).
© 2020 by the authors. Licensee MDPI, Basel, Switzerland. This article is an open access
article distributed under the terms and conditions of the Creative Commons Attribution
(CC BY) license (http://creativecommons.org/licenses/by/4.0/).You can also read