Solar Energy Generation Potential Estimation in India and Gujarat, Andhra, Telangana States
←
→
Page content transcription
If your browser does not render page correctly, please read the page content below
Smart Grid and Renewable Energy, 2014, 5, 275-289
Published Online November 2014 in SciRes. http://www.scirp.org/journal/sgre
http://dx.doi.org/10.4236/sgre.2014.511025

       Solar Energy Generation Potential
       Estimation in India and Gujarat, Andhra,
       Telangana States
       T. Harinarayana1, K. Jaya Kashyap2
       1
        Gujarat Energy Research & Management Institute (GERMI), Gandhinagar, India
       2
        Malla Reddy Engineering College, Hyderabad, India
       Email: harinarayana@germi.res.in, kashyap.thewall@gmail.com

       Received 15 September 2014; revised 30 September 2014; accepted 9 October 2014

       Copyright © 2014 by authors and Scientific Research Publishing Inc.
       This work is licensed under the Creative Commons Attribution International License (CC BY).
       http://creativecommons.org/licenses/by/4.0/

       Abstract
       It is well known that the rampant increase for the demand of electricity and rapid depletion of the
       fossil fuels has called for immediate response in the direction of energy sufficiency. To accomplish
       this, one of the important tasks is to identify the locations of high potential for renewable energy
       generation. It is a well-established fact that solar energy proved to be the most sought after source
       for energy generation. Although, solar energy potential maps of India have been prepared based
       on solar irradiation maps in the earlier studies, the present research study has been carried out
       with a focused attention directly on solar energy generation considering various parameters. In
       this work it is shown that solar energy generation does not depend on solar radiation alone at a
       location. Instead, there are various other factors that influence the energy generation. Some of
       them are ambient temperature, wind velocity and other parameters like weather and topographic
       conditions. In this study the locations with high and low solar energy generation potential in India
       have been identified through systematic analysis by computing the solar energy parameters at
       every grid point (1˚ × 1˚). The work has been extended with more detailed study for Gujarat,
       Andhra Pradesh and the newly formed Telangana states. The data points considered for the states
       are 0.25˚ × 0.25˚ having resulted in adding more number of locations. Our results indicate that the
       total annual energy generation in India varies from 510,000 KWH to 800,000 KWH per acre of
       land. The least energy generation location pertains to the eastern parts of Arunachal Pradesh and
       eastern part of Assam and the highest annual solar energy generation has been identified in the
       eastern parts of Jammu & Kashmir and eastern part of Uttarakhand.

       Keywords
       Solar Energy, Estimation, Financial Benefits, Gujarat, Andhra Pradesh, Telangana, India

       How to cite this paper: Harinarayana, T. and Jaya Kashyap, K. (2014) Solar Energy Generation Potential Estimation in India
       and Gujarat, Andhra, Telangana States. Smart Grid and Renewable Energy, 5, 275-289.
       http://dx.doi.org/10.4236/sgre.2014.511025
T. Harinarayana, K. Jaya Kashyap

       1. Introduction
       Solar energy incident on the Earth’s surface also known as insolation, is dependent on many parameters such as
       geographic location, earth-sun movements, tilt of earth’s rotational axis, atmospheric parameters, suspended
       particles etc. Quantification of solar energy potential in any region depends mainly on the intensity of insolation
       [1]. The grid-tied renewable energy from the installed PV capacity is around 6% in India [2]. The solar insola-
       tion of India is very much encouraging. The daily global radiation on an average is around 5 KWH per square
       meter per day and in a year the sunshine ranges from 2300 to 3200 hours [2]. Another advantage is that India
       lies in an ideal geographical location between the equator and tropic of cancer and has an average annual tem-
       perature ranging from 25˚C to 27.5˚C. All these advantages can be effectively and strategically used if we can
       identify the locations of high potential solar energy generation. This helps to achieve the target of Jawaharlal
       Nehru Solar Mission which is 20 GW power by the year 2022 [3].
          Among all possible alternative energy options, for example, wave energy, geothermal energy, solar energy,
       wind energy, and hydroenergy, solar energy is becoming more popular in India. This is mainly due to 1) the
       availability of plenty of sunlight in all the seasons and also at all the locations of India and 2) the initiation of
       solar mission by the government of India with attractive incentives to the developers [4]. If we look at the total
       renewable energy generation of the world, which is around 5 × 10²⁰ J per year, solar thermal contributes to
       0.5%, wind 0.3%, geothermal 0.2%, bio-fuel 0.2%, and solar photovoltaic (PV) is only about 0.04% as per sta-
       tistical review of world energy during 2007 [5]. In recent years, the technology upgradation has made solar
       photovoltaic technology as a viable technology with competitive price. It is projected that by the year 2030, the
       solar PV electricity will dominate compared to other sources of energy [6]. From the study growth of photovol-
       taic, an average about 45% annual increase is noticed during the years 2000 to 2009 [6]. From the study of cost
       economics of a solar photovoltaic power plant, PV modules cost about 40% - 45% and the other 55% - 60% is
       due to its components [7]. Additionally, cost of the power plant also depends on the land value. If the solar
       power plant is close to the substation near the populated area, the transmission of energy losses will be mini-
       mum, but the cost of the land will be high [8]. If the power plant is at a remote location, the cost of the land is
       low but the energy losses will be high. On the other hand, with less population and in a remote location, the use
       of energy is limited to the local community. Ideally, the solar power plant needs to be located at a place where
       the energy generation from the plant can be connected directly to the power grid at an optimum distance from
       the plant. Apart from the government of India’s national solar mission program, the recent initiation by the gov-
       ernment of Gujarat to establish the solar photovoltaic plants is commendable. During 2012, while Gujarat alone
       crossed 600 MW power through solar, the rest of the country was far behind with only about 200 MW. The
       Gandhinagar Photovoltaic Rooftop Programme for solar energy generation using PV modules has set an exam-
       ple by government of Gujarat to save the land cost (see http://www.gpclindia.com/gpcl_rsg/index.html). Anoth-
       er way to save the land cost is to adopt a new methodology to get maximum output from the solar power plant in
       a limited area (Ref: 2 layer panel). In India, the cost of the land has grown up five to ten times for the last 10
       years. This is true in all the urban and semi-urban regions of India.
          There are many places in the world still suffering to use the electricity for their needs. It is reported that many
       islands around the world are facing acute shortage of electricity. For instance, Papua New Guinea, Fiji islands,
       Ports of Andaman & Nicobar and Lakshadweep islands in India are some of the examples. Major electricity
       generation in these islands is based on using diesel generators, for which diesel oil needs to be transported from
       nearby main land to these islands [9]. For effective use of renewable energy, storage and conservation are the
       important factors. In fact, many nations are now looking at various renewable resources available with them and
       plan to utilize them optimally. In this direction nations like Nigeria have taken several steps on the use of energy
       utilization for equipment, lighting, machines and engines in the industry and also new designs for buildings to
       make them energy-efficient [10]. In the same direction we have suggested earlier to use the national highways
       for solar energy generation by putting the solar panels at a reasonable height of 5.7 meters above the road. This
       helps to save the land use [11] [12]. Realizing the importance of climate change and global warming, use of re-
       newable energy is on the rise in many countries, especially the grid-connected PV solar installations [13] [14].
       For example there is a 55% increase in solar PV with a cumulative installed capacity of around 3.1 GW during
       the year 2005 as compared to 2 GW during the year 2004 in the world [15]. India’s solar energy scenario is also
       following a similar growth rate for the past few years. This is mainly due to new initiatives taken by the gov-
       ernment, for example subsidies to the developers with tax exemption. The other necessity factors are the large

                                                            276
T. Harinarayana, K. Jaya Kashyap

gap between the energy generation and demand. It is very much an evident fact that since India has entered into
a phase of rapid development, the energy and in particular the electricity demand would always be on the rise as
illustrated in the Figure 1 [16]. As seen from Figure 1, the present (2014) electricity generation in India is close
to 248 GW. If India plans to increase its rate of growth by 7% or 8% or 9%, the target energy generation also
needs to be increased. By 2034 (after 20 years) our target will be 960, 1156 and 1390 GW respectively. This
means the target is close to 4 to 6 times the present value. All these challenges would require meticulous plan-
ning and start with the identification of strategic locations with high energy generation potential. The present
study is aimed towards this direction. Thus the main objective of this research work is to estimate the solar
energy potential at different locations of India with high and low energy regions.

2. Methodology
The methodology followed in our study is through modelling. The modelling has been carried out using PVsyst,
Google Earth and Surfer software programs. A brief description of these software programs is presented in the
following.
   PVsyst: PVsyst simulation software is a popular tool among solar energy engineering community. It is being
used extensively to analyze the detailed performance of the solar plant in field conditions. It can be used in
many ways, for example, to investigate different loads on the system, to estimate the size of the system, to de-
termine the optimal size of the system, to assess the energy production in the system etc. One of the most im-
portant features of PVsyst is that the economical evaluation of the solar photo-voltaic installation can be accom-
plished with reasonable accuracy. Other capabilities and options available in the PVsyst software can be seen in
[17]. In the present study the 6.25 version of the PVsyst software [17] has been used.
   Surfer: It is graphical software that can be used for contouring the values, 2D and 3D visualization of the data.
The software runs on Windows operating system. It can also be used for bathymetric, terrain modelling studies,
visualization of the landscape, watershed analysis, interpolation, extrapolation, gridding, digitization etc. [18]. In
the present study, this software has been used to digitize the map boundaries, creation and plotting the contour
maps. In addition to these features numerous other features mostly related to extrapolation, interpolation, and
other statistical algorithm do exist.
   Google Earth: It is also software that can be used to visualize the imagery for the satellite maps, 3D buildings,
terrains etc. [19]. It also superimposes the various images, derived from aerial photography records, satellite im-
agery maps having the same coordinating system. Additionally, digital elevation map can also be prepared from
the data derived from SRTM (Shuttle Radar Topography Mission) of NASA [20]. One of the key features is to
obtain an altitude of a location for a given geographic parameter such as latitude and longitude. Some of these
parameters are used in our study.

                            Figure 1. Projected energy generation for the next 20 years
                            from the year 2014 until 2034. Initial energy generation is as-
                            sumed as 248 GW of electricity.

                                                     277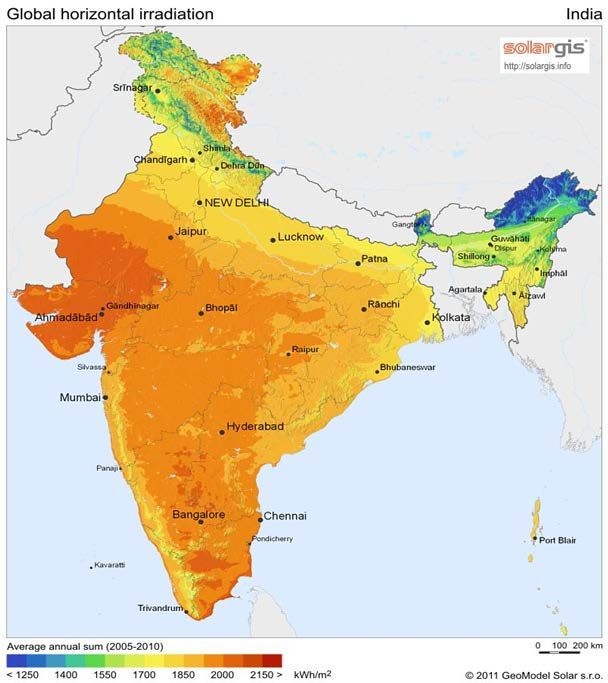
T. Harinarayana, K. Jaya Kashyap

       3. Site Selection
       Since the main objective of the study is to estimate the total solar energy potential of India, the site selection
       should be carried out in such a way that it effectively and uniformly covers the entire land mass of India. For
       this purpose, 1˚ × 1˚ grid by varying the latitude and longitude has been considered. This has rendered a total of
       286 geographical locations covering the entire land mass of India. Similar method has been extended to the
       states of Gujarat, Andhra Pradesh and Telangana. In order to acquire high density values for individual states,
       the latitude and longitude has been reduced to 1/4˚ (15 arc minutes). This has been done to obtain more geo-
       graphical locations that would subsequently aid in obtaining better and accurate results. Detailed computation
       has been carried for three states owing to the following reasons:
          Rajasthan and Gujarat are the two states in India which lie in the sunny belt (>2000 KWH per Km) having
       bright sunlight weather for more than 250 to 300 days in a year. This way these two states receive maximum
       amount of annual global radiation [4] [7] [12] [21]. The newly formed states of Andhra Pradesh and Telangana
       are badly in need of electricity and require well directed plans aiming at energy independence.

       4. The Data
       In the present study grid-connected system is chosen. The basic input parameters required are PV component
       database, grid inverter database, geographical site information and monthly meteorological data for horizontal
       global irradiance and temperature. More details of the parameters are provided in Table 1.
          The PV module chosen in the modelling is DelSolar (D6P 230 A3E). Each module has a maximum power
       output of 230 W. The module dimensions are 1.62 m in length and 0.99 m in width. Although the module meas-
       ures 1.62 m in length an additional space of 0.05 m (5 cm approximately) has been given for easy operations, by
       taking mechanical aspects of the panel etc into consideration. Among the various inverters, Siemens’ inverter
       has been chosen.
          The meteorological data has been acquired from meteonorm version 6.1 (Fabrikstrasse, Bern, Switzerland)
       [21]. We have a choice of using meteorological data acquired from meteonorm or NASA-SSE data [22].
          The meteonorm software has inbuilt database with a monthly irradiation data for 1200 stations with an aver-
       age values for 20 years from 1981 to 2000. Data related to Indian region is clearly documented in meteonorm.
       Additionally, different European countries’ data are also available. Apart from this, data for a new site can be
       easily derived through interpolation of values, usually carried out between three nearest stations [18]. The
       NASA data contains monthly average data in a region of 1˚ × 1˚ for the whole world for the years 1983 to 1993.
       Accordingly, the data from meteonorm data available with us is more accurate and recent as compared to NASA
       data. For this purpose in our study we have used meteonorm data.

       Table 1. Details of the PV module and the corresponding grid inverter.

                                 Area considered                                   1 acre (~=4047 Sq·m) (63 × 63 m)

                      Name of the manufacturer (PV module)                                     Del Solar

                            Technology (PV module)                                      Silicon-Polycrystalline

                                       Pmpp                                                    230 Wp

                                       Impp                                                     7.8 A

                                      Vmpp                                                     29.49 V

                     Name of the manufacturer (grid inverter)                                  Siemens

                        Nominal AC power (grid inverter)                                       465 kW

                        Total No. of PV modules in 1 acre                                        1944

                           Dimension of the PV module                           L = 1.67 m (1.62 m + 0.05 m) W = 0.99 m

                     Active (sensitive) area of the PV modules                                 3129 m2

                                   Source of data                                          Meteonorm V6.1

                                                                 278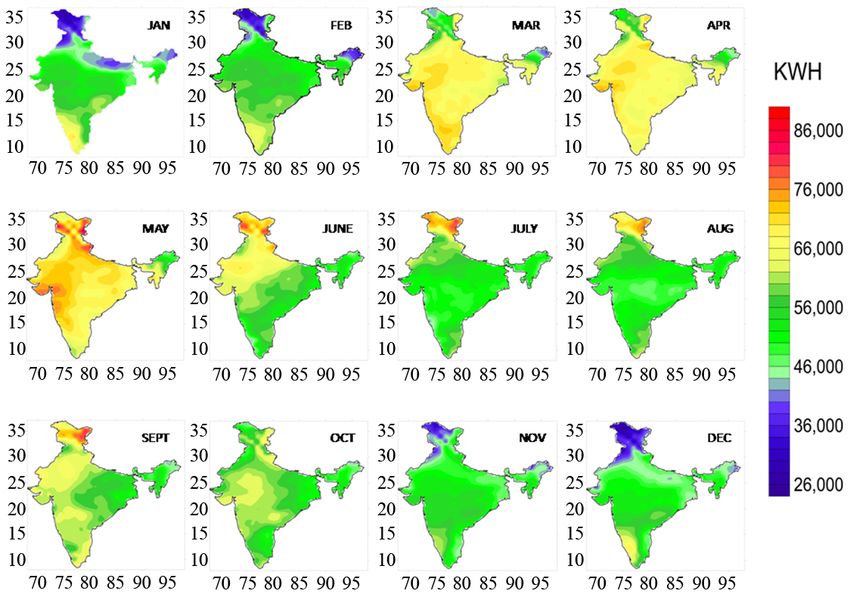
T. Harinarayana, K. Jaya Kashyap

5. Solar Panel Configuration
The area and solar panel orientation have been carried out on similar lines mentioned in the previous papers [12]
[23]. The solar panels have been arranged in an area of 1 acre (4047 m2). This can be conveniently approximated
to a square with dimensions of 63 m × 63 m. The solar panels have been placed horizontally on the ground. This
facilitates the accommodation of maximum number of panels. The thumb rule of solar panel placement in gen-
eral states that the azimuth of the solar panel should be equal to the latitude of the place [23]. But this has been
disregarded in the present work and all the panels have been placed in horizontal direction. This has been done
to provide a standard and a uniform platform for energy computation throughout the present study covering the
whole country. One such typical configuration is presented in Figure 2.
   In the current study, the solar panels pertaining to the above mentioned configuration and orientation have
been placed at numerous geographical locations of India considering 1 × 1 degree. For individual states, with
more focused attention given to the states of Gujarat, Andhra Pradesh and Telangana considering smaller area
covering 0.25 × 0.25 degree at each location. Grid locations used in our study in all the four cases, namely, In-
dia, Gujarat, Andhra and Telangana regions are shown in Figure 3. A total of 286 locations in India, 266 in Gu-
jarat, 231 in Andhra Pradesh and 165 in Telangana state have been obtained. As can be seen at each location, we
have computed solar energy generation for all the months and also for the annual generation. This has generated
large data base of 948 locations for analysis. All these results are described in the following for each case.

6. Results
Results derived in our present study are solar energy generation at every location for each month and also the
total energy for the year. All these values at each location have been considered and contouring has been carried
out using gridding method. The total annual energy generation for India is presented in Figure 4(a) varies from
510,000 KWH to 800,000 KWH per acre of land. In Figure 4(b) [24], different states of India are shown. The
least energy generation location pertains to the eastern parts of Arunachal Pradesh and eastern part of Assam.
The highest annual solar energy generation (750,000 - 800,000 KWH/acre) potential has been identified in the
eastern parts of Jammu & Kashmir and eastern part of Uttarakhand. Major part of Indian landmass has the solar
energy generation potential ranging from 680,000 KWH - 730,000 KWH, among which southern parts of Sau-
rashtra, eastern part of Rajasthan, southern part of Karnataka and western part of Tamil Nadu region have shown
the average annual energy generation close to 730,000 KWH. Northern part of Rajasthan and Punjab, Haryana
states and northern part of Jammu & Kashmir, West Bengal, Bihar, Nagaland, Manipur, Meghalaya and western

                        Figure 2. Typical field design of solar panels considered in one acre of
                        land. In this design, all the panels are symmetrically arranged in a hori-
                        zontal direction and giving a small area all around the land.

                                                      279
T. Harinarayana, K. Jaya Kashyap

                      Figure 3. Data locations considered in our study. The grid locations used in our study for
                      the entire country India (1˚ × 1˚), Gujarat, Andhra Pradesh and Telangana states (0.25˚ ×
                      0.25˚).

       part of Assam have shown average annual energy generation values ranging from 620,000 KWH - 650,000
       KWH. The results derived from the present study gave a clear evidence that major portion of Indian sub-conti-
       nent has substantial solar energy potential except in the area of Arunachal Pradesh & eastern part of Assam
       states. Figure 5 gives the solar energy generation averaged for each month. Annual seasonal variation of weath-
       er parameters is normal in India. It is almost cyclic in each year. June to August months are considered to be
       monsoon months. Due to the effect of monsoon, solar radiation on the surface of the Earth decreases. This af-
       fects the solar energy generation. This can be seen clearly from Figure 5. The monthly energy generation picks
       up from the month of September. Similarly, March to May is considered as summer months. During this period,
       solar energy is maxima as compared to other months.
          Similarly, in the state of Gujarat, solar annual energy generation ranges from 630,000 KWH to as much as
       800,000 KWH (Figure 6(a)). Different districts of Gujarat can be seen in Figure 6(b) [25]. Figure 7 shows
       monthly energy generation for Gujarat. The maximum solar energy generation (800,000 KWH) is limited to
       small area in the district of Junagarh. Interestingly, this small area has shown a near-circular shape. The reason
       might be attributed to the higher solar radiation received in this small area. This can be understood from the ob-
       servation of the elevation map of Gujarat. This small area is located in the well-known Gir forest region where
       the elevation of Girnar hills is close to 1000 m. The energy generation is least in the northern part of Rann of

                                                            280
T. Harinarayana, K. Jaya Kashyap

                                                          (a)

                                                          (b)

                       Figure 4. (a) Annual solar energy generation potential map for India es-
                       timated from the present study. Blue colour shows the low energy gen-
                       eration and Red indicates the high energy generation as shown in the
                       Index; (b) India map showing different states.

Kutch region and northern part Kutch district. Majority of the region in Gujarat has the potential to generate
energy with magnitude ranging from 700,000 KWH - 730,000 KWH. Due to low monsoon effect as compared
to the rest of India, Gujarat solar energy is affected only during parts of July to August.
   In the case of Andhra Pradesh state, the annual solar energy generation map, has shown a variation from
670,000 KWH - 740,000 KWH (Figure 8(a)). Different districts are shown in Figure 8(b) [26]. The least an-
nual generation has been identified in the area of eastern part of Kurnool, northern part of Kadapa, major portion
of Ongole and Guntur districts. The maximum energy potential (730,000 KWH - 740,000 KWH) is limited to
the western part of Ananthapur district. The districts of Srikakulam, Vizianagarm, Vizag, east and west Godavari

                                                    281
T. Harinarayana, K. Jaya Kashyap

                              Figure 5. Solar energy generation for India, showing the variation of en-
                              ergy in different months. Lowest is about 26,000 KWH and the highest is
                              close to 86,000 KWH.

                                                                  (a)

                                                                  (b)

                              Figure 6. (a) Annual solar energy generation for the Gujarat state. South-
                              ern part of Saurashtra shows high potential compared to northern part; (b)
                              Gujarat map showing distribution of different districts.

                                                            282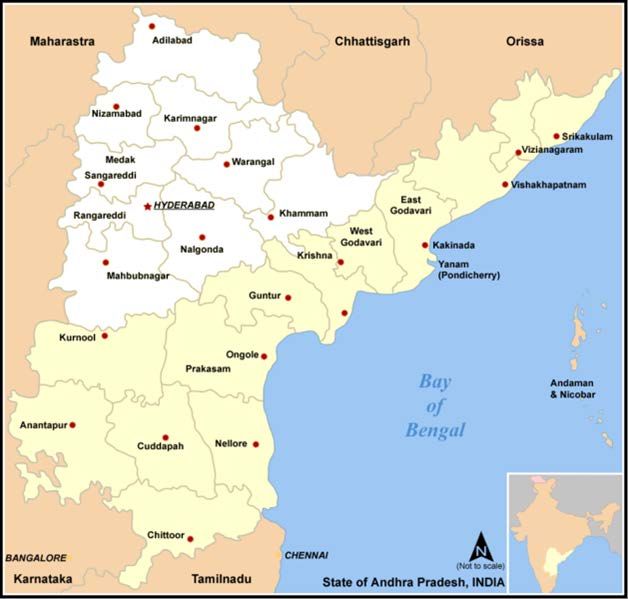
T. Harinarayana, K. Jaya Kashyap

Figure 7. Monthly solar energy generation for Gujarat state, showing the
variation in different months.

                                    (a)

                                    (b)

   Figure 8. (a) Annual solar energy generation potential map for
   Andhra Pradesh state. Highest being about 740,000 KWH and the
   lowest being 670,000 KWH; (b) Andhra Pradesh map showing dif-
   ferent districts of the two states, Andhra and Telangana.

                              283
T. Harinarayana, K. Jaya Kashyap

       and northern part of Krishna district have shown a variation ranging from 695,000 KWH - 715,000 KWH.
       Monthly variation can be seen in Figure 9. Due to frequent cyclonic effects, coastal districts show low energy
       generation during the months of October-November-December.
          In the newly formed Telangana state, northern part of Adilabad district and southern part of Mahboobnagar
       district have the least energy generation potential ranging from 670,000 KWH - 690,000 KWH (Figure 10(a)).
       The district map of Telangana region is shown in Figure 8(b) [27]. The districts of Khammam and western parts
       of Medak seem to have the highest energy potential ranging from 715,000 KWH - 725,000 KWH. In all other
       districts, solar energy generation varies from 695,000 KWH - 710,000 KWH. Monthly variation can be seen in
       Figure 11. Similar to other states, Telangana region showed low energy generation during July and Aug com-
       pared to other months.
          The results generated from our study are close to the results reported in earlier studies [12] [23]. For instance,
       in Ahmedabad district, we have shown the energy generation value close to 710,000 KWH, whereas in earlier
       studies, 678,574 KWH. This small variation is due to data considered in our study being meteonorm data, whe-
       reas in other studies NASA-SSE data is considered. Thus our study is close to the previous studies.

       7. Discussion
       An attempt has been made in our study, to estimate the solar energy generation for the whole country of India in
       a regional scale and more focused detailed study for three different states—Gujarat, Andhra and Telangana. It is
       observed that solar energy generation at a particular place does not solely depend on the solar irradiation or solar
       insolation. Earlier studies have made attempts in estimating the solar potential of India using solar irradiation
       data alone. Although the amount of solar radiation plays a significant role in energy generation, it is observed
       that there are other parameters which tend to influence the energy generation to a great deal [28]. Some of these
       parameters are ambient temperature, altitude of the place, wind velocity, weather conditions etc. The fact that
       weather conditions influence the energy generation can be seen from the monthly energy generation plots of In-
       dia and the individual states of Gujarat, Andhra Pradesh and Telangana. It is a well-conceived fact that higher
       the altitude at a particular place lower is the ambient temperature. This combination of high altitude and low
       ambient temperature plays a crucial role in the efficient performance of the PV modules. The optimum wind ve-
       locity is also a deciding factor in the energy generation process from the view point of heat transfer.
          Examination of the yearly energy generation map of India (Figure 4(a)) would reveal that eastern part of the
       states of Jammu & Kashmir and Uttarakhand which house the Himalayas have shown great potential of solar
       energy generation. One noteworthy remark to be made in this context is that although the radiation in these re-
       gions is low when compared to the rest of the country, the energy generation potential is high. The reason for
       this might be attributed to the ideal combination of solar radiation, ambient temperature and wind velocity. In
       Figure 12, the results presented in earlier sections are shown as 3D perspective diagram indicating elevated hills
       and valleys. Higher the elevation, greater the solar energy generation and vice versa.
          From comparison of solar radiation maps of India in Figure 13(a) [29], and that of Germany in Figure 13(b)

                              Figure 9. Monthly solar energy generation for Andhra Pradesh state, by
                              showing the variation in different months.

                                                           284
T. Harinarayana, K. Jaya Kashyap
(a)
(b)
Figure 10. (a) Annual Solar energy generation for Telangana state; (b)
Different districts of Telangana state.
[29] offers a platform for some interesting observations. It is a well established fact that Germany is heading
towards solar super power with the aid of its research and development capabilities. The solar radiation map of
Germany reveals that it is making tremendous strides in solar energy generation with minimal amount of radia-
tion it receives as compared to India. Examination of maps reveal that maximum amount of solar radiation re-
ceived by Germany is approximately equal to the minimum amount of solar radiation received by India. This
fact clearly lays emphasis on the abundance of resources India possesses owing to its ideal geographical loca-
tion. The present day reported solar energy generation in India is close to 2.6 GW [30], whereas Germany’s so-
lar energy generation is close to 22 GW as of 25th May, 2012 [30]. From the comparison of land area between
Germany and India, Indian land mass is approximately 9.2 times greater than Germany. This is another good
reason to indicate that India needs to give priority in solar energy generation and formulate policies more ag-
gressively.
285T. Harinarayana, K. Jaya Kashyap
Another useful result that can be drawn from our study for solar developers in India is the number of solar
panels required for a fixed amount of energy generation and the cost factor involved. These results are summa-
rized in Table 2. For example, in India one can generate a maximum annual energy generation ranges from
Figure 11. Monthly solar energy generation for Telangana state, showing the variation in
different months.
Figure 12. 3D representation of annual solar energy potential. Elevated area indicates high
energy potential and the less elevated area shows low energy potential.
286T. Harinarayana, K. Jaya Kashyap
(a)
(b)
Figure 13. (a) Global horizontal irradiation map for India; (b) Global
horizontal irradiation map for Germany (Courtesy: Geomodel Solar).
287T. Harinarayana, K. Jaya Kashyap
Table 2. Financial analysis keeping the target solar energy generation.
Annual energy
Annual target Area of land Number of Cost of solar
generation Indian rupees
energy (acres) panels panels ($)
in an area KWH
800,000 800,000 1.00 1944.00 291,600 17,496,000
750,000 800,000 1.06 2060.64 309,096 18,545,760
700,000 800,000 1.43 2779.92 416,988 25,019,280
650,000 800,000 1.23 2391.12 358,668 21,520,080
600,000 800,000 1.33 2585.52 387,828 23,269,680
550,000 800,000 1.45 2818.80 422,820 25,369,200
500,000 800,000 1.60 3110.40 466,560 27,993,600
500,000 - 800,000 KWH per acre of land. In general we keep a wide gap between the rows of panels. For the
sake of uniform computation throughout the country and also to estimate the maximum energy possible, we
have kept the panels, as described earlier, in horizontal direction. Thus the values provided in our study are the
maximum possible energy at any given location. For this type of energy generation, at a high energy (800,000
KWH) potential location, one requires 1944 panels. To achieve the same amount of energy generation in an area
of 500,000 KWH potential per acre of land, one need to have 1.6 acres of land and nearly 3110 number of pa-
nels. This can be looked from the view point of financial terms as well. For example, with the assumption of 230
W solar panel cost equal to 150 $, one need 291,600 $ (nearly Rs. 1.74 crores @ 1 $ = Rs60/-) for 1944 solar
panels. To achieve the same amount (800,000 KWH) of energy generation, in the low energy potential area one
requires 466,460 $ (nearly 2.8 crores). This thumb rule hopefully helps the solar developers to estimate the
energy generation correctly for better planning before deciding on the solar plant development in an area.
8. Conclusion
Thus, the present research study has been carried out with a focused attention directly on solar energy generation
considering various parameters, such as ambient temperature, wind velocity and also other parameters like
weather and topographic conditions. In future, we plan to carry out a detailed analysis on the affecting factors
and determine their priority.
Acknowledgements
We would like thank the Vice Chairman, GERMI, Sri Tapan Ray for his continuous encouragement and support
to this work. Discussions with Dr. Sagar and Dr. Jani and the entire solar team are very helpful at various stages.
We thank Ms. KSV Vasavi for her help in many ways in finalizing the manuscript. Coordination of the summer
Intern programme by Sri Ankur Bhatnagar, Dharmik Lay, Prashant Gopiyani and Ms. Sandhya are gratefully
acknowledged.
References
[1] Ramachandra, T.V., Jain, R. and Krishnadasa, G. (2011) Hotspots of Solar Potential in India. Renewable and Sustain-
able Energy Reviews, 15, 3178-3186. http://dx.doi.org/10.1016/j.rser.2011.04.007
[2] Khare, V., Nerma, S. and Baredar, P. (2013) Status of Solar Wind Renewable Energy in India. Renewable and Sus-
tainable Energy Reviews, 27, 1-10. http://dx.doi.org/10.1016/j.rser.2013.06.018
[3] Ministry of New and Renewable Energy, Government of India (2009) Jawaharlal Nehru National Solar Mission to-
wards Building SOLAR INDIA. http://www.mnre.gov.in/file-manager/UserFiles/mission_document_JNNSM.pdf
[4] Goswami, D. (2012) India’s Solar Sunrise. Renewable Energy Focus, 13, 28-30.
http://dx.doi.org/10.1016/S1755-0084(12)70037-6
[5] BP Statistical Review of World Energy (2014). www.bp.com
[6] European Photovoltaic Industry Association (2014) Global Market Outlook for Photovoltaics.
http://www.epia.org/news/publications/
288T. Harinarayana, K. Jaya Kashyap
[7] Sharma, A. (2011) A Comprehensive Study of Solar Power in India and World. Renewable and Sustainable Energy
Reviews, 15, 1767-1776. http://dx.doi.org/10.1016/j.rser.2010.12.017
[8] Raman, P., Murali, J., Sakthivadivel, D. and Vigneswaran, V.S. (2012) Opportunities and Challenges in Setting Up
Solar Photovoltaic Based Micro Grids for Electrification in Rural Areas of India. Renewable and Sustainable Energy
Reviews, 16, 3320-3325. http://dx.doi.org/10.1016/j.rser.2012.02.065
[9] Lal, S. and Raturi, A. (2012) Techno-Economic Analysis of a Hybrid Mini-Grid System for Fiji Islands. International
Journal of Energy and Environmental Engineering, 3, 10. http://dx.doi.org/10.1186/2251-6832-3-10
[10] Oyedepo, S. (2012) Efficient Energy Utilization as a Tool for Sustainable Development in Nigeria. International Journal
of Energy and Environmental Engineering, 3, 1-12.
[11] Zweibel, K. (2010) Should Solar Photovoltaics Be Deployed Sooner Because of Long Operating Life at Low, Predict-
able Cost? Energy Policy, 38, 7519-7530. http://dx.doi.org/10.1016/j.enpol.2010.07.040
[12] Sharma, P. and Harinarayana, T. (2013) Solar Energy Generation Potential along National Highways. International
Journal of Energy and Environmental Engineering, 4, 16. http://link.springer.com/article/10.1186%2F2251-6832-4-16
[13] Dinçer, F. (2011) Overview of the Photovoltaic Technology Status and Perspective in Turkey. Renewable and Sustai-
nable Energy Reviews, 15, 3768-3779. http://dx.doi.org/10.1016/j.rser.2011.06.005
[14] Bhutto, A.W., Bazmi, A.A. and Zahedi, G. (2012) Greener Energy: Issues and Challenges for Pakistan—Solar Energy
Prospective. Renewable and Sustainable Energy Reviews, 16, 2762-2780.
http://dx.doi.org/10.1016/j.rser.2012.02.043
[15] Renewable Energy Policy Network, Renewables Global Status Report.
http://www.ren21.net/Portals/0/documents/activities/gsr/RE_GSR_2006_Update.pdf
[16] Electricity Sector in India. http://en.wikipedia.org/wiki/Electricity_sector_in_India
[17] PVSYST. http://www.pvsyst.com/en/
[18] Surfer v11. http://downloads.goldensoftware.com/guides/Surfer11TrainingGuide.pdf
[19] Google Earth v7.1.2.2041. http://www.google.com/earth/explore/products/index.html
[20] Google Earth. http://en.wikipedia.org/wiki/Google_Earth
[21] Global Meteorological Database, Meteonorm Switzerland Version 6.1.0.23.
[22] NASA, Surface Meteorology and Solar Energy (SSE). https://eosweb.larc.nasa.gov/sse/
[23] Harinarayana, T. and Vasavi, K.S.V. (2014) Solar Energy Generation Using Agriculture Cultivated Lands. Smart Grid
and Renewable Energy, 5, 31-42. http://dx.doi.org/10.4236/sgre.2014.52004
[24] Maps of India. http://www.mapsofindia.com/
[25] District Map of Gujarat, File. http://commons.wikimedia.org/wiki/File:Map_Gujarat_state_and_districts.png
[26] District Map of Andhra Pradesh. http://www.mapsofindia.com/maps/andhrapradesh/andhrapradesh-district.htm
[27] District Map of Telangana. http://www.prokerala.com/maps/telangana-state-map.html
[28] Solanki, C.S. (2011) Solar Photo-Voltaics: Fundamentals, Technologies and Applications. 2nd Edition.
[29] SolarGIS. http://solargis.info/doc/postermaps
[30] Renewable Energy. http://en.wikipedia.org/wiki/Renewable_energy
289You can also read