Energy-chip App - Bernoulli Institute
←
→
Page content transcription
If your browser does not render page correctly, please read the page content below
Energy-chip App
                        How to save energy in the Commons world

                                     Giuliano Andrea Pagani
                                       Distributed Systems Group
                  Johann Bernoulli Institute for Mathematics and Computer Science
                                         University of Groningen
                                       Groningen, The Netherlands
                                     email: { g. a. pagani}@ rug. nl

                                  http: // www. cs. rug. nl/ ~ andrea/

                                           August 29, 2012

                                         Executive Summary
         The best and first way to become sustainable is to reduce consumption in every day ac-
     tivities, being more careful about how much energy is used and avoiding unnecessary use.
     Energy-chip App aims at reducing energy consumption in places where energy resource is
     shared between several users (e.g., a company) with their self-interest. The solution pro-
     posed consists of hardware and software which are used together to monitor users energy
     consumption, raise his awareness, stimulate them to save energy with economic incentive,
     reward mechanisms, and social pressure. In addition, gaming techniques will be used in the
     software application to make the energy saving experience more attractive and interesting.
     Given the results from the literature and projects in raising people awareness over energy
     consumption and keep motivation in energy savings, we envision as an outcome of the project
     the possibility for the University of Groningen to save at least 20% of the electrical energy bill
     a year. Considering the financial point of view the project is attractive (positive net present
     value) with a pay-back time of almost three and half years.

Keywords:   Energy Saving, Energy Metering, Cost Savings, Commonly Held Energy Resources, Smart
App

Concept and objectives
Concept
Energy is a resource that is taken for granted and its importance appears more prominent only
when shortages or problems (i.e., blackouts) take place c.f. the blackout that left 700 million
Indians with no power on July 30th1 . At personal level people may be more or less careful in the
usage of energy given their culture, education, environmental sensibility and social status. The
term Commons, which is mentioned in the subtitle of this project proposal, refers to the essay
“Tragedy of the Commons” [10] by Garrett Hardin. “The tragedy of the commons is a dilemma
arising from the situation in which multiple individuals, acting independently and rationally con-
sulting their own self-interest, will ultimately deplete a shared limited resource, even when it is
clear that it is not in anyone’s long-term interest for this to happen.” 2 . The shared resource in
our project is energy whose usage that takes place most of the times without a direct knowledge of
  1 http://www.guardian.co.uk/world/2012/jul/31/india-blackout-electricity-power-cuts
  2 http://en.wikipedia.org/wiki/Tragedy_of_the_commons

                                                     1
G.A. Pagani - Energy-chip App

actual energy consumption and cost. The other Common in our project is a bigger Common which
is the environment we live in and that we share. The consequences of using more and more energy,
mainly coming from polluting non-renewable sources, is already presenting the consequences to
all world’s inhabitants.
    In a nutshell the project aims at developing a solution to incentivize people to save energy
in common or shared places where it is not possible to accurately measure and bill energy usage
with current technology. The solution is composed by hardware and software components acting
together to provide the user with a careful understanding of the amount of energy used. The
solution will also promote mechanisms of incentive to reduce energy consumption not only at
individual level, but also at business unit, group or community level.
    The solution consists on the hardware side of smart-metering plugs that, once activated by the
user with valid authentication credentials, enable the supply of energy and at the same time begin
to meter the amount of energy consumed by the attached device. On the software side, the solution
consists of a software application for mobile devices (i.e., smartphones, tablets) that the user uses
to activate the smart-metering plug, check real-time energy consumption of the plugs in use, check
the amount of money spent for the energy provided. One can consider billing using current energy
tariffs or the real cost of energy production adding all the externalities of the energy production
process, or a fictitious currency specifically realized for the project (e.g., a similar currency as
the one used in the PowerMarching City project [4]). In addition to these base features, the
application also provides other service such as credit top-up (a similar mechanism as the one used
in pre-paid phones) and a news feed to monitor the progress of other members (e.g., belonging
to the same community) and an incentive service based on special offers, games, discounts and
savings programs (e.g., something similar to Air Miles initiatives). For users that do not have a
mobile device, our solution is still feasible and in this case it is based on a personal chip-card,
similar to the OV-chipkaart developed in the Netherlands for public transportation, to activate
the smart-metering plug and a web-based portal application that has the same functionalities of
the mobile app for the user.

Objective
The main motivation is simple: help in reducing energy by motivating people by rising awareness,
by economic incentive, by rewarding, social pressure and imitation, and gaming techniques. Such
methods of incentive for energy conservation have been already studied by scientists and have
proven successful showing energy savings results [3, 12]. These aspects just described are the
main objectives considering the user adopting the proposed solution (e.g., a family, a company,
the university, a multi-branch worldwide organization). Having the electricity consumption by-
the-person and other possible levels of aggregation (e.g., office, floor, department) an organization
adopting this solution has first of all a more precise and granular idea where each watt-hour is
used, has an additional key performance indicator (KPI) to evaluate business units and employees
and especially a motivator towards energy reduction for the users of the “Common” resource.
These objectives just mentioned are a driver towards adopting Energy-chip App at company level.

             Energy-chip App enables energy savings by motivating people
             through rising awareness, by economic incentive, by rewarding,
             social pressure and imitation, and gaming techniques.

Motivation and drivers
The main motivation that drives this project is in the ability of reducing energy usage by
eliminating the use of non-strictly necessary equipment and reducing to the minimum
the use of essential equipment. The aim is in mitigating, and hopefully inverting, the trend that
has seen the electricity generation growing and in the past decades, and an even steep increase
in the near future is forecast, as Shown in Figure 1a. Such a reduction is needed since the fuels
used for electricity generation are mainly non-renewable such as coal and natural gas (as shown in
Figure 1b) which are source of green house gas emissions therefore main cause of earth’s warming
process [11].

                                                 2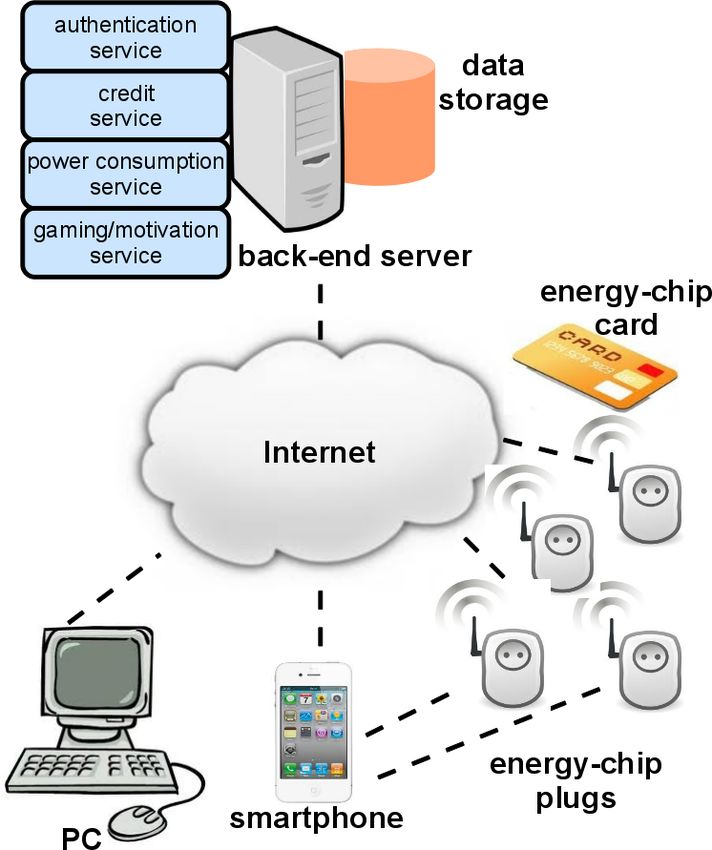
G.A. Pagani - Energy-chip App

        (a) OECD and non-OECD net electricity             (b) World net electricity generation by
        generation, 1990-2035 (trillion kilowatthours).   fuel type, 2008-2035 (trillion kilowatthours).
        Source: U.S. Energy Information Administra-       Source: U.S. Energy Information Administra-
        tion [14]                                         tion [14]

                               Figure 1: Electricity scenarios of the future.

    The second motivation lies in the possibility of shaping people behavior and sensibility towards
energy by the use of intelligent technologies, so that people become aware of the energy that
is consumed in their life and working style. An increased conscience can help in changing
their habits.
    The third motivation and driver is related to the proper and correct accounting and billing
of energy service. A small granularity in energy metering enables employees and white-collar
workers to have a better idea of consumption and not only companies’ energy managers and
financial officers as it is nowadays.
    The underlying motivation is that for every service or good that one needs, he has to be
recognized as the buyers of such good, and billed accordingly. Think about the train transportation
system: anybody needs a valid ticket to access to the train and enjoy the ride. The situation for
energy is slightly different. In today’s electricity system it is enough to find a power outlet socket
to plug in your device and you have the “power service” without any issue. Of course in home
environment the meter measures the amount of energy that one uses and one will be billed at the
end of the month. People are incentivized by their own will of saving money, or their environmental
conscience, or their living habits to use the minimum amount of energy that is actually required.
However, in collective places (“the Commons”) the situation is a bit different: one does not receive
any bill for the use of the energy he uses. The organization/person that is associated with the
meter through which the energy flows will be billed, and maybe the person that has exploited
the energy service is not even part of that organization. In fact nowadays, the way the plugs and
the electricity system work is always the same: a device is attached and if it requires power, the
power will be delivered. In a world rich with electronic devices that work only attached to a power
source or whose batteries easily run out and recharging is frequently needed, it is not uncommon
to see people fighting for a power outlet. The situation of an airport with multiple plugs attached
and where all the possible devices are connected to the only outlet is not hard to fathom. The
billed entity is in fact not the user, but the company managing the airport facility. However,
the things are starting to change also for the energy sector. Power companies are starting to
deliver meters (smart meters) that work with the same principle of prepaid phone cards: you buy
a certain credit (energy credit) and once you have overtaken your budget no more electricity will
be delivered until a top-up is done.3 Pre-paid cards for phone, transportation, on demand movie
are extremely popular, most of the times for the ease of use, the absence of complex contract
and bureaucracy, or just to attract a part of the market. Especially, those users that (in their
perception) want to have a close monitoring of their expenses. Given this context and scenario,
we propose in this project to use a similar approach for energy. A user that needs power in public
or work environment where he is not directly billed will need to activate the plug where he wants
to withdraw energy from with his Energy-chip App (or chip card). Once the power has been used
  3 e.g.,   http://www.prepaypower.ie/

                                                          3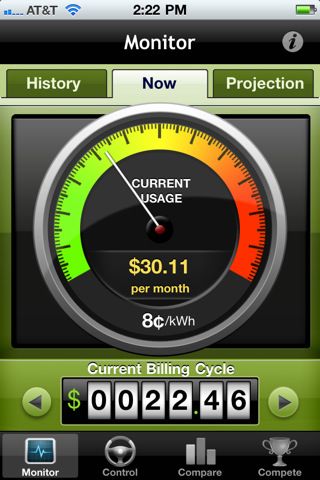
G.A. Pagani - Energy-chip App
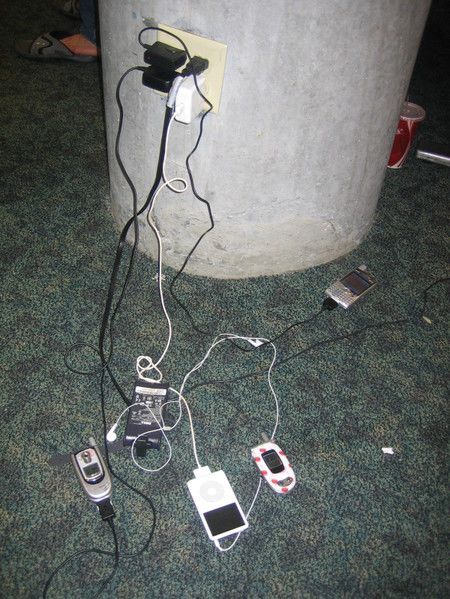
(a) An airport plug under siege. (b) A typical airport scenario.
Figure 2: Exploitation of common energy resources.
and the device unplugged, the total consumption for the device will be shown and the billing too.
We believe that this mechanism is a great incentive for power saving in the public and office
environment where the end-user of the devices requiring power are less conservative in power usage
than in the home environment given the “Common” nature of the shared environment and the
absence of an involvement in the economic effects of his power usage. With this project energy
becomes as any other commodity: a service that we have if we are entitled to have, and as a side
effect this provide the users an incentive to reduce their power consumption.
Performance improvement
Given the focus of the call on the sustainability and energy savings in the buildings/operations
of the University of Groningen, it worths to mention that the resource consumption accounted
in 2005 were 42,500,000 kWh of electricity, 8,000,000 m3 of gas and 140,000 m3 of water4 which
account for an energy bill about 10 million euro, while in 2010 the electricity consumption was
about 50,000,000 kWh5 . Despite the committment of the University of Groningen (as well as
other Dutch universities) of reducing energy consumption about 14% in the decade 1996-2006, to
the best of our knowledge there are no form of individual or business unit (e.g., research group,
teaching course) energy metering and personal incentive in energy reduction at the work place.
It is hard to forecast how much energy can be saved in the operation of University of Gronin-
gen if Energy-chip App is implemented, however some assumption can be made considering the
results obtained on the topic of energy savings and user energy awareness in projects and scientific
literature. The Norwegian investigation by Wilhite et al. [15] reports about home users who are
given for a period of three years a more detailed energy bill. Just by this more awareness on
consumption and a clearer energy bill, the researchers found a reduction in energy consumption of
10%. The same level of energy reduction is obtained by the investigation performed by Darby [7]
where the effect of feedbacks to users on their energy consumption has a positive effects by mo-
tivating them to consume less. Another study realized in Japan by Ueno et al. [13] has shown
consistent results with the previous (9% energy savings) by installing in the home environment
an energy consumption information systems showing the energy usage of some home appliances.
The benefits of energy reduction does not only apply to the monitored appliances, but also other
appliances that were not monitored where people are aware and motivated. Gaming techniques
4 http://www.rug.nl/duurzaamheid/Nieuwbouw/duurzameNieuwbouw?lang=en
5 http://beta.wewi.eldoc.ub.rug.nl/root/2011/2011/
4
G.A. Pagani - Energy-chip App

to motivate users and to keep users challenged and involved have already been used. They have
proven successful in learning [9], in product design to better understand user desires and to realize
objects that really satisfy users’ needs [6]. In the energy field, games to help changing the behavior
of end-users have already been realized for energy awareness purposes [2].
    At company level experiments have been conducted by providing the employees with more
information and awareness to participate in energy-saving initiatives. For instance at 3M corporate
headquarters in Minnesota the company realized an experiment where workers were asked to close
fume hoods, shut off lab equipment not in use, shut off lights, shut off office equipment not needed,
close blinds, etc. The net result was that the building’s electrical demand dropped from 15 MW
to 13 MW in 15 minutes, and then to 11 MW over 2 hours [1]. This is a demonstration that in
the office/company environment consistent savings of more than 20% can be achieved.

             Given such results obtained from literature research we con-
             sider that a reasonable and realistic target in energy reduc-
             tion when Energy-chip App is implemented at the University
             of Groningen is about 20% of electrical energy compared to the
             2012 electricity bill.

Feasibility
First of all it worths to emphasize that the plan to realize Energy-chip App for the University of
Groningen is feasible considering the technical, practical, economic, legal and ethical point of view.
The privacy aspects related to energy metering will be guaranteed taking into consideration the
issues experienced in the roll-out of smart meters in the Dutch society. Data about consumption
of energy will be personal and anonymized by default and only if the user agrees his data will be
used for benchmarking and comparison with other users.

Realization
In order to realize the complete system to enable Energy-chip App hardware and software com-
ponents need to be considered and developed. Figure 3 shows a schema of the main components
and the interactions between them.

Hardware
Concerning hardware, two elements must be considered for development:
   • intelligent Energy-chip App plug: this is a plug to be placed on top of common outlets and
     that provides the embedded intelligence to meter attached appliances and to authenticate
     the users that want to use the plug. The activation of the plug takes place, either through
     the interaction with the Energy-chip App on the smartphone device, or through the chip
     card.
   • Energy-chip App card: this is a credit card-like plastic card containing a chip with the
     information of the user (e.g., user account and credit balance) that enables the plug to be
     activated.

In case that such plugs or products with the same functionalities will be available on the market
when the project starts the purchase instead of the development will be considered.

Software
Concerning the software, three software elements must be developed:
   • the core Energy-chip App is a key part of the project development. The application will have
     to deal with the interaction with plugs for authentication purposes. The app will interact
     with the back-end software system to retrieve user information and to compute energy

                                                  5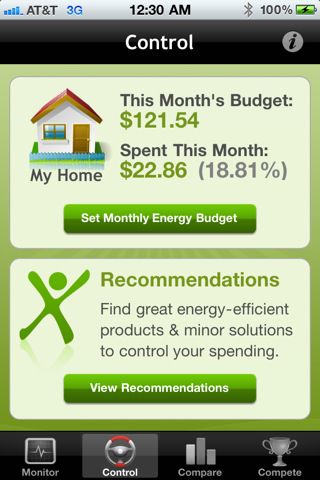
G.A. Pagani - Energy-chip App

                  Figure 3: Energy-chip App information system architecture

     consumption. In addition, the app needs to fetch information about the user’s energy credit
     and enable the top-up mechanism via the smartphone and update the information to the
     back-end system. A similar screen to the one to be developed concerning energy consumption
     is shown in Figure 4, while the motivational side of the app is shown in the screen-shots in
     Figure 5.
   • the user can also access all the functionalities available via the smartphone app through the
     web portal. Actually, this is the main form of interaction for the users that do not have a
     smartphone and activate plugs by just using the chip card.

   • the back-end system is the main element of the architecture that realizes Energy-chip App.
     As shown in Figure 3 the back-end contains all the services that the users needs for the
     interaction with the system. Functionalities such as user authentication, power consumption
     computation of the devices attached to the plugs the user has activated, management of the
     remaining credit and top-up all reside in the central unit that keep control of the Energy-
     chip App system. In addition, also the motivation and gaming engine, for example with
     comparison with other users and business units is processed centrally and only the results
     and advices are shown to the user, either via the smartphone or the web portal.

Additional features
By means of user authentication it is not difficult to imagine in the near future that users will
own small generating source of electricity so they can feed it in the grid such as with electric
cars or battery packs embedded in solar backpacks to be used as a generating . Therefore, given
the bidirectional flow of electricity possible through the plug, a user could supply the grid with
his energy to “recharge” his Energy-chip App account. Once the authentication mechanism is
enabled, the plug can easily account for energy that is fed into the grid and present a report
for the fed energy in the same fashion it is elaborated for the consumed energy. Therefore, the
Energy-chip App solution is completely in-line with the new tendencies of a more intelligent and
smart grid.

                                                6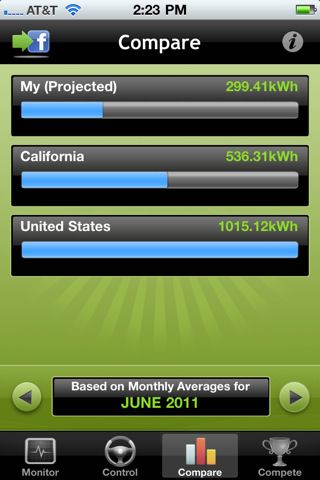
G.A. Pagani - Energy-chip App

(a) Instantaneous power consump-   (b) Historical energy consumption.   (c) Credit/spending and advice in-
tion.                                                                   terface.

                  Figure 4: Power consumption envisioned app-related interface

                  (a) Comparison with other users.          (b) Gaming interface.

                      Figure 5: Motivational envisioned app-related interface

                                                     7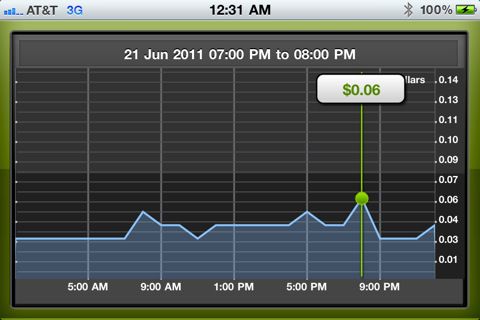
G.A. Pagani - Energy-chip App

Implementation at University of Groningen
In the case of the university environment a conservative approach would be to provide every
employee or student with an annual budget of “power credit” allowed to be used. The user is
than able to buy additional “power credit” once the credit is depleted. A more radical approach
is to provide the employees and students only with the card and let them manage their “energy
balance”. Another possible scenario is not to use the power credit system, but only use the
Energy-chip App as a monitoring measure to understand how much employees/students consume
and see if the psychological effect of monitoring (“big brother effect”), gaming, raising awareness,
comparison with other users affects the end-user. Monitoring and awareness are in fact the first
ingredients to be set to achieve energy savings. This system could help to let people realize how
much energy can be saved that once was wasted [5].
    The Energy-chip App proposal and its implementation at the University are feasible. The
mechanism of authenticating users to access power consumption services and detailed power usage
monitor by intelligent plugs in a fashion similar to the one presented here has been just developed
by Sony. Such solution has been just presented and not yet commercialized. The principle used
by Sony is similar to the one here presented. However, in Sony’s solution the authentication
happens wireless by a special plug and a special power outlet the consuming device needs to be
connected to. In another case Sony’s solution enables the authentication signal over the power
line wire. For more information about Sony’s authentication outlet refer to http://www.sony.
net/SonyInfo/News/Press/201202/12-023E/index.html and a for a demonstration realized by
Sony at the NFC&Smart WORLD 2012 conference refer to the video available at http://www.
youtube.com/watch?v=_1Cmh_zhP2I.
    The Energy-chip App solution here presented is more general than Sony’s since the authen-
tication mechanism is done via an app independently of the device to be attached to the power
outlet. Sony’s solution requires two pieces: a special power outlet and a special plug; our solution
foresees only a plug to be attached in any normal power outlet, since the authentication of the
user is realized through the mobile app (or the chip-card). In the university case the chip-card
functionalities can be easily included in the next generation of student-ID card and employee
badge for university personnel.

Work plan and budget
Work plan and timing
Considering the work plan in order to realize the project, we envision first a pilot to test the
solution in a limited and controlled environment, both in terms of people involved in the pilot,
and building of the university where the system is tested (e.g., Bernoulliborg). In this first stage
the results and continuous evolution of the app can be evaluated in a real-life environment with
a group of volunteer participant. Based on the results of this first pilot, the achievements in
terms of energy savings and end-user satisfaction, we consider a go/no-go decision of extending
the solution to all other university facilities. We reinforce the concept that in the first phase all
the hardware/software development will be realized and that the solution will be fully operational
at the end of this first phase. The second phase has the mere aim of extending the solution to a
bigger environment therefore requiring a scaling of the solution. However, the scaling requirement,
which impact mainly the software layer of Energy-chip App solution, will be already taken into
account in the initial development phase.
    Table 1 shows the possible division of the project in work packages (WP) and in tasks which
define the activities to be done with more granularity. We consider the project on the horizon
of two years and composed of five work packages. However, only three work packages are core
for the development of the solution, while WP0 and WP4 are for management and dissemination
purposes. As mentioned, WP0 is a typical project management activity to keep track of the
progress of the project and the compliance with the timing and costs envisioned. WP1 deals with
the design and development of the Energy-chip App hardware, thus the intelligent plug and the
chip card. We would like to remark that in the case of success of this proposal, we will evaluate if
already large-scale commercial solution (Sony’s solution is still in the development stages at the

                                                 8
G.A. Pagani - Energy-chip App
time of writing) will be available with the same, or similar, characteristics as the one envisioned
and if and how a solution on the market could be adapted for Energy-chip App project. WP2
is entirely dedicated to the development of the software. It starts with a requirement analysis
that will involve end-users, energy managers and environmental psychologists since they have the
knowledge and experience on the subject matter to envision the functionalities that the software
will need, to be successful in its usage. The software development will continue with the definition
of the architecture required to manage Energy-chip App, mainly the back-end infrastructure, and
with the implementation and the development. In WP2 we envision temporal overlaps in tasks
in order to enable the output of a task to be eventually shaped or refined with the feedback of
the beginning task that receives it as input. WP3 which is related to the integration and the
validation of the solution, involves both the software and hardware team that will need to test
the solution on the field and validate it considering the validation and feasibility test developed.
During the second year of the project we expect the prototype of the solution to be ready and
fully testable by pilot users. WP4 is more an institutional work package in order to disseminate
the results obtained throughout the project.
Budget
The identification of a precise budget figure is not easy to produce, because an hardware solution
that would satisfy requirements similar to the ones of Energy-chip App might be available on the
market at the time of implementation of the project. However, we consider a solution in which
also the hardware development is evaluated. As shown in Tables 2 and 3 the total expenditure
is slightly lower than 100000 euro, which is the maximal implementation cost allowed by the call.
The most part of the cost is related to human capital required for the development of the project.
Especially the hardware and software development and implementation are a consistent cost of
the solution. Considering the equipment, we envision to produce with the accounted budget
(8000 euro) around 200 plugs (each around 40 euros which is a the commercial price of nowadays
plugs with metering functionalities e.g., plugwise6 ) that are enough for the initial 2-years pilot
test. We consider to equip 40 people (members of the test group) with 5 plugs each which is a
reasonable amount for office workers, students, study rooms, or small labs. Once the pilot has
proven successful, the extension to the whole university facilities is mainly a matter of cost in the
plugs. We consider that a large-scale production of plugs would substantially reduce their price,
the same applies to the chip-cards to provide university personnel and students.
Financial perspective
From a financial point of view we consider a time horizon of seven years as mentioned by the
proposal call. We evaluate a simple financial return of the project considering its benefits in
reducing the energy bill of the University of Groningen. In order to perform such a calculation we
take the following assumptions for our scenario.
Assumptions:
• Total installed number of plugs 75000 (50000 in the facility and 5 to each of the 5000
university fte employees7 ).
• Cost per plug: we assume a prudential approach of estimating again 40 euros per plug even
if the scale of deployment has increased compared to the initial development and validation
stage of the project.
• Opportunity cost of capital for University of Groningen of 5%.
• Energy-chip App electricity savings of 20% on the bill of the University of Groningen.
• Evolution of the electricity consumption that starts with the value found for the University
of Groningen in 2010 of 50,000,000 kWh8 and evolves according to EU Energy trends to
6 http://www.plugwise.com/idplugtype-f/home/home-extension
7 http://www.rug.nl/corporate/universiteit/feitenencijfers/index
8 http://beta.wewi.eldoc.ub.rug.nl/root/2011/2011/
9WP WP name Task Task description Category Begin-end date Participant
0 Project Management team
Management
1 Meeting organization Management M0-M24 Management team
2 Project schedule Management M0-M24 Management team
3 Project cost supervision Management M0-M24 Management team
1 HW develop- Hardware team
ment
1 Requirement analysis Research M0-M3 Hardware team
2 HW platform design Research M3-M6 Hardware team, software team
3 HW implementation Development M6-M12 Hardware team
2 SW develop- Software team
ment
1 Requirement analysis Research M0-M3 Software team
2 SW architecture design Research M2-M5 Software team
5 SW implementation Development M4-M16 Software team
3 Integration All [Software team]
10
and valida-
tion
1 System integration and Development, test M12-M24 Hardware team, software team
feasibility tests
2 Test bed case studies and Test M12-M24 Hardware team, software team
G.A. Pagani - Energy-chip App
validation
3 Usability and occupant Demonstration M12-M24 Hardware team, software team
experience evaluation
4 Dissemination [Management team], software team
1 Dissemination of project Demonstration M0-M24 Management team
results
2 Project website Demonstration M0-M24 Software team
3 External relations, con- Demonstration M0-M24 Management team
tribution to standards,
patents
Table 1: Project work packages, tasks, duration and involvementG.A. Pagani - Energy-chip App
Activity Total Skill Monthly Fraction Total cost (euro)
duration salary of time
(months) (euro)
Project management 72 Project manager 3000 3.00% 6480
HW development 12 HW developer 2000 100.00% 24000
SW development 18 SW developer 2000 100.00% 36000
Integration/Validation 36 HW developer 2000 10.00% 7200
Integration/Validation 36 SW developer 2000 10.00% 7200
Dissemination 72 Project manager 3000 2.50% 5400
Human capital cost
86280
Table 2: Budget: human capital cost
Type Cost (euro)
HW development board/equipment 2000
HW plugs production for test bed 8000
Computers 2500
SW development licenses 1000
Equipment/devel tool cost
13500
Table 3: Budget: equipment and development tool cost
2030 [8] which envision for the Netherlands a growth in electricity consumption of 3.5%
from 2010 to 2020 and a growth of 0.6% from 2020 to 2030.
• The price of electricity assumed constant in the period and equal to the current value of
0.0800 euro per kWh according to the information of Europe’s energy portal9 for large
consuming companies (20 GWh/year ( 50%) ).
Table 4 shows the consumption of electricity, the related costs and the savings enabled by
the implementation of Energy-chip App considering the assumption discussed above. Considering
such economic results, the cost of realization of Energy-chip App and the opportunity cost of
capital to finance the investment, the Net Present Value (NPV) is above 3,000,000 euro
in a seven years period. The results of the cash flow analysis and the Net Present Value
are shown in Table 5. From such analysis it is possible to evaluate the the time after which
the discounted cumulated cash flow turn positive, that is the pay-back time which, happens
after a little less than three and half years after the completion of the project as shown
in Figure 6. Therefore by this financial analysis and the assumption presented the investment
is positive and worths to be implemented given the positive NPV and the short pay-back time.
In the case the project is selected to be implemented, another financial analysis will be made
with several scenarios of the assumptions considered (e.g., cost of capital, future electricity cost
evolution, penetration of the usage of the Energy-chip App among users) to test the sensitivity to
the variables in play.
9 http://www.energy.eu/#Industrial-Elec
11Year 2010 2011 2012 2013 2014 2015 2016 2017 2018 2019 2020 2021
Electricity 50000000 51750000 53561250 55435894 57376150 59384315 61462766 63613963 65840452 68144868 70529938 70953118
consumption
(kWh)
Electricity 4000000 4140000 4284900 4434872 4590092 4750745 4917021 5089117 5267236 5451589 5642395 5676249
cost (euro)
12
Savings in 886974 918018 950149 983404 1017823 1053447 1090318 1128479 1135250
electricity by
Enengy-chip
App (euro)
Table 4: Consumption, costs, and savings in electricity for University of Groningen.
G.A. Pagani - Energy-chip AppG.A. Pagani - Energy-chip App
Year 2014 2015 2016 2017 2018 2019 2020 2021
Discounted -3009709 895607 899954 904323 908713 913124 917557 896177
cash flow
Cumulated -3009709 -2114102 -1214148 -309825 598888 1512012 2429569 3325745
discounted
cash flow
Table 5: Discounted cash flow analysis and Net Present Value
Figure 6: Pay-back time of Energy-chip App.
References
[1] E. Arens, C. C. Federspiel, D. Wang, and C. Huizenga, How Ambient Intelligence will
Improve Habitability and Energy Efficiency in Buildings, in Ambient Intelligence, W. Weber,
J. M. Rabaey, and E. Aarts, eds., Springer Berlin Heidelberg, Berlin/Heidelberg, 2005, ch. 5,
pp. 63–80.
[2] M. Bang, C. Torstensson, and C. Katzeff, The powerhhouse: A persuasive computer
game designed to raise awareness of domestic energy consumption, in Persuasive Technology,
W. IJsselsteijn, Y. de Kort, C. Midden, B. Eggen, and E. van den Hoven, eds., vol. 3962 of
Lecture Notes in Computer Science, Springer Berlin / Heidelberg, 2006, pp. 123–132.
[3] L. J. Becker, Joint effect of feedback and goal setting on performance: A field study of
residential energy conservation, Journal of Applied Psychology, 63 (1978), pp. 428–433.
[4] F. Bliek, A. van den Noort, B. Roossien, R. Kamphuis, J. de Wit, J. van der
Velde, and M. Eijgelaar, Powermatching city, a living lab smart grid demonstration,
in Innovative Smart Grid Technologies Conference Europe (ISGT Europe), 2010 IEEE PES,
oct. 2010, pp. 1 –8.
[5] D. Bonino, F. Corno, and L. De Russis, Home energy consumption feedback: A user
survey, Energy and Buildings, 47 (2012), pp. 383–393.
[6] E. Brandt, Designing exploratory design games: a framework for participation in partici-
patory design?, in Proceedings of the ninth conference on Participatory design: Expanding
boundaries in design - Volume 1, PDC ’06, New York, NY, USA, 2006, ACM, pp. 57–66.
[7] S. Darby, Making it obvious: designing feedback into energy consumption, Berlin, Springer-
Verlag, Jan. 2001, pp. 685–696.
13G.A. Pagani - Energy-chip App
[8] Directorate-General for energy, Eu energy trends to 2030, tech. rep., European Com-
mission, 2009.
[9] M. Ebner and A. Holzinger, Successful implementation of user-centered game based learn-
ing in higher education: An example from civil engineering, Computers and Education, 49
(2007), pp. 873 – 890.
[10] G. Hardin, The tragedy of the commons, Science, 162 (1968), pp. 1243–1248.
[11] IPCC, Climate Change 2007 - The Physical Science Basis: Working Group I Contribution
to the Fourth Assessment Report of the IPCC, Cambridge University Press, Cambridge, UK
and New York, NY, USA, Sept. 2007.
[12] A. H. Mcmakin, E. L. Malone, and R. E. Lundgren, Motivating Residents to Conserve
Energy Without Financial Incentives, Environment and Behavior, 34 (2002), pp. 848–863.
[13] T. Ueno, F. Sano, O. Saeki, and K. Tsuji, Effectiveness of an energy-consumption
information system on energy savings in residential houses based on monitored data, Applied
Energy, 83 (2006), pp. 166 – 183.
[14] U.S. Energy Information Administration, International energy outlook 2011, tech. rep.,
U.S. Energy Information Administratio, 2011.
[15] H. Wilhite and R. Ling, Measured energy savings from a more informative energy bill,
Energy and Buildings, 22 (1995), pp. 145 – 155.
14You can also read