EPBD Implementation in The Netherlands - Status in December 2016 - Concerted Action EPBD
←
→
Page content transcription
If your browser does not render page correctly, please read the page content below
E PBD I m pl e m e n t a t io n in
                                 T h e N e t her l an d s
                                                Status in December 2016

AUTHOR
Hans van Eck, Netherlands Enterprise Agency (RVO)

NATIONAL WEBSITES
www.rvo.nl, www.energielabelvoorwoningen.nl, www.zoekuwenergielabel.nl, www.energielabel.nl,
www.rvo.nl/actueel/nieuws/stand-van-zaken-webapplicatie-energielabelvoorwoningennl,
www.rvo.nl/initiatieven/overzicht/27008, www.energiebesparendoejenu.nl
www.rvo.nl/onderwerpen/duurzaam-ondernemen/gebouwen/energieneutraal-bouwen/publicaties,
www.rijksoverheid.nl/onderwerpen/energielabel-woningen-en-gebouwen, www.verbeteruwhuis.nl

1. Introduction
The EPC system in The Netherlands has been implemented since 2008 and so far more than 3.5 million
EPCs (> 50% of the total building stock) have been registered. In December 2012, the government decided
to implement a new, much more consumer-friendly system for owners of residences. This new system was
developed in 2013 and 2014, and has been operational since January 2015. Legislation for the new labelling
system became effective on 1 January 20151. Changes in the accreditation system for experts for the new
EPC for residential buildings were also implemented in January 2015.
In September 2013, a national Energy Agreement (“Energie Akkoord”) was signed by more than 40 market
participants and other stakeholders. The targets for energy efficiency improvements and the use of RES in
buildings in this agreement are in line with the requirements of the EPBD. Under this agreement, it is
foreseen that by 2020 The Netherlands will:

•   improve 300,000 existing residences by two energy efficiency classes on the energy label;

•   renovate the social housing building stock to the level of energy class B (on average);
•   improve 80% of the private rental houses to a minimum of energy class C.
After 2020, newly-built houses have to reach the NZEB standard. The signatures of many key organisations
endorsing these objectives are clear evidence that there is broad support for the market uptake of an
energy-efficient and energy-neutral building environment in the future of The Netherlands.
Implementing the Energy Performance of Buildings Directive                                             2018

2. Current Status of Implementation of the EPBD

2.I. Energy performance requirements: NEW BUILDINGS
Energy performance requirements have been in place for new buildings in The Netherlands since 1995.
They are updated on a regular basis, moving towards NZEB targets by 2020 (Figure 1).
The change towards more demanding requirements took place as a result of so-called “tightening studies”.
These studies included an analysis of the market penetration of energy efficiency measures, renewable
energy applications and energy-efficient heating and cooling generators. They also took into account the
cost-effectiveness of these measures and their impact on indoor climate and occupant satisfaction. The
tightening studies were carried out by consulting companies and were supervised by the Dutch Agency for
Enterprises (RVO) on behalf of the Ministry of the Interior (BZK). During the studies, all stakeholders were
informed about the results and could comment on them, to ensure that practical experiences with energy
saving measures were taken into account2.

 Figure 1. Change over time of the energy performance coefficient in new buildings as an indication of the
improvement of the overall energetic quality of buildings (future plans are not included because the energy
                performance coefficient will no longer be used as an indicator for NZEB).

2.I.i. Progress and current status of new buildings
The Energy Performance Standards (EPN), established in 1995, were replaced in July 2012 by a new
standard, the Energy Performance Standard for Buildings (EPG) that replaced both the existing residential
and non-residential standards.
The main requirement for the energy performance of new buildings is the energy performance coefficient
(in Dutch the “energieprestatiecoefficient'), setting minimum energy performance (MEP) for new buildings.
This indicator is based on the estimated total primary energy consumption of a building based on a series

2
Implementation of the EPBD in The Netherlands Status in December 2016
of indicators, e.g., heating, ventilation and lighting, adjusted to the useful floor area and the renewable
energy produced by the building. This indicates the building energy performance in MJ/m2.
The calculation of the energy performance coefficient is mandatory for all new buildings and for large
renovations in houses and offices.
The energy performance coefficient calculation is part of the building permit application. A project
developer has to demonstrate full compliance with the energy performance requirements to receive a
building permit for a new building or a major renovation. Permits are checked and issued by local
municipalities before construction.
Monitoring and enforcement is carried out by the regional environmental services. These are separate
entities to reinforce regulation on behalf of the municipalities. These entities are part of the Dutch
provinces.
Municipalities are responsible for compliance checking during construction. In case of non-compliance,
they issue a “cease-work” order that remains valid until the requirements are met. As such, there are no
financial penalties. Buildings that do not comply do not get built, and if builders deviate, construction is
ceased until it is in line with the permit.
Every year, a sample is drawn by the RVO to check if all permits are in line with the legal requirements. If
the permits are not in line with the legal requirements, the RVO will report this to the municipalities who
will take legal action.
Energy Performance Calculation Method in The Netherlands
The energy calculation method for new and existing buildings is defined in Standard NEN 7120 that is in
line with the CEN standards. This calculation of the primary energy consumption of a building is based on
monthly climate data that is adjusted for physical processes with a shorter timeframe, e.g., solar gains and
heat accumulation. The calculation of the thermal quality of the building envelope includes thermal
bridges, ventilation and air infiltration, hot water use, efficiency of heat and cold generators, renewable
energy used both in and near the building, and the contribution of passive energy, lighting and day-
lighting. Shading caused by the building itself is included in these calculations. Shading by other buildings is
not taken into account.
More information: http://www.rvo.nl/onderwerpen/duurzaam-ondernemen/gebouwen/wetten-en-
regels-gebouwen/energieprestatie-epc/bepalingsmethode
The quotient of a building’s calculated annual primary energy needs to the allowed primary energy
performance provides the energy performance coefficient (Table 1).
3Implementing the Energy Performance of Buildings Directive 2018
Building Typology Required maximum values for the energy performance
coefficient (new buildings)
Day-care centres 1.1
Prisons 1.0
Healthcare buildings with bed area (hospitals) 1.8
Healthcare buildings (other than with bed 0.8
area)
Office buildings 0.8
Accommodation in lodging structure (hotels) 1.0
Accommodation not in lodging structure 1.4
(conference facilities)
Educational buildings 0.7
Sports buildings 0.9
Retail buildings 1.7
Residential buildings 0.4
Mobile homes 1.3
Table 1. Required maximum energy performance coefficients for new buildings since 1 January 2015 and,
after cost-optimal studies, for non-residential buildings since 1 July 2015.
For residential buildings an energy performance coefficient of 0.4 means approximately
50 - 65 kWh/m2.year.
2.I.ii. Format of national transposition and implementation of existing regulations
Since the oil crisis in the 1970s, The Netherlands applied minimum requirements for the thermal quality of
the building envelope. In 2011 and 2012, a study has been carried out, to establish cost-optimal minimum
requirements for existing buildings. These requirements came into effect in 2013-2014. The minimum
requirements for individual building components are listed in Table 2 for major renovations (25%
envelope), and in Table 3 for minor renovations.
Minimum requirements for the thermal quality of the building envelope by 1 January 2015 for new
buildings and major renovation (> 25% envelope).
Roofs R-value ≥ 6 m2.K/W
Floors R-value ≥ 3.5 m2.K/W
Façades R-value ≥ 4.5 m2.K/W
Transparent façade sections U-value < 65 W/m2.K
Individual structure U-value < 2.2 W/m2.K
Table 2. Minimum requirements for building components for new buildings and major renovations.
4Implementation of the EPBD in The Netherlands Status in December 2016
Roofs R-value ≥ 2 m2.K/W
Floors R-value ≥ 2.5 m2.K/W
Façades R-value ≥ 1.3 m2.K/W
Transparent façade sections U-value < 2.2 W/m2.K
Table 3. Minimum requirements for building components for minor renovations.
2.I.iii. Action plan for progression to NZEB for new buildings
The energy performance coefficient has been tightened on 1 January 2015, as an intermediate step to
reach the NZEB level. The next step will be to specify the demands on primary energy consumption and the
share of renewable energy up to the NZEB level. In March 2015, a first proposal for these requirements for
new buildings was shared with stakeholders (Table 4) and sent for adoption by the parliament in July 2015.
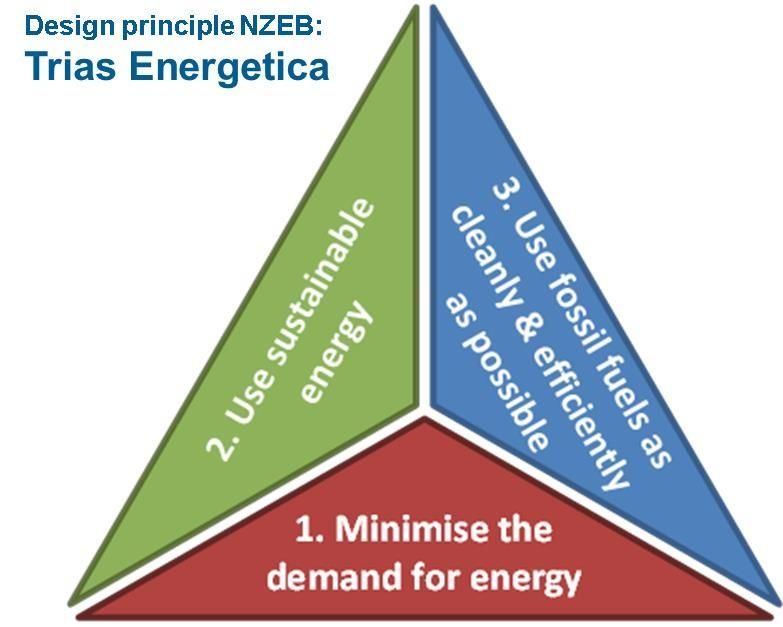
The triple NZEB requirements are referred to in the Netherlands as the Trias Energetica and graphically
shown as in Figure 2.
Figure 2. Trias Energetica.
Building Typology Energy-need Primary energy- Share of
[kWh/m2.year] use** renewable
[kWh/m2.year] energy**
[%]
Residential 25* 25 50
Office / healthcare with no bed area / 50*** 25 50
assembly / sport / retail / prisons / lodges
Healthcare with bed area 65 120 50
Schools 50 60 50
*Studio < 50 m2 dependent on further research
**Buildings > 5 floors dependent on further research
***Buildings < 50 m2 dependent on further research
Table 4. Proposed requirement for NZEB.
5Implementing the Energy Performance of Buildings Directive 2018 The study on the cost-optimality, in accordance with Article 5 of the EPBD, is planned for 2018. On the basis of this study, the requirements may still undergo some minor changes. The Dutch government supports a programme from intermediary organisations, such as “NEPROM” (organisation of project developers) and “Bouwend Nederland” (organisation of builders), aimed at preparing the market players for increased demands to reach the NZEB level for new buildings. In 2016, these intermediary organisations started a new programme under the name “ZEN” (i.e., “very energy-efficient new buildings”) to prepare the market players for tightening of the NZEB requirements in 2020. RVO maintains a database with NZEB examples already constructed.3 In 2014, the RVO carried out studies of the top 30 energy-efficient homes and the top 15 energy-efficient schools and offices. Some of them already met the requirements for the proposed definition of NZEB. A complete overview of the number of existing NZEB in The Netherlands is not yet available. Monitoring of this programme started in 2016. The number of NZEB will gradually increase to 100% after the implementation of the legislation regarding these buildings as per 1 January 2021. 2.I.iv. Requirements for systems and / or building components for new buildings No requirements exist in The Netherlands for separate energy efficiency measures for technical building systems. Instead, the total building has to reach a level of efficiency, indicated by the energy performance coefficient. This way, builders and developers are given the freedom to choose the most cost-efficient solution as regards the envelope and the technical building system of that particular building. This approach gives freedom in the design and stimulates technical innovation. Products that are not yet integrated into the official calculation method are tested to establish the performance that leads to inclusion in the method. An independent commission of experts has to approve the results of the test before official publication. This concerns the performance of systems and products in the area of heating, hot water, AC, and large ventilation systems. On top of the energy performance coefficient for the total building, there are also mandatory minimum requirements for building elements in new buildings. Those are similar to the demands for existing buildings undergoing major renovation (Table 2). 2.II. Energy performance requirements: EXISTING BUILDINGS Similar to new buildings, major renovations are required to have a building permit that meets minimum requirements for building components, e.g., the R-value of walls, roof and floor, and the U-value of windows and doors. A renovation is considered to be major when more than 25% of the building envelope will be renovated. The calculation of the energy performance coefficient is also mandatory for large renovations in houses and offices (see also section 2.I.i). For minor renovations, there are only minimum requirements for the R-value of walls, roof and floor, and U-value of windows and doors. In such cases, no energy performance calculation or building permit is required. The requirements for the individual building components are listed in section 2.I.i. 6
Implementation of the EPBD in The Netherlands                                            Status in December 2016

2.II.i. Progress and current status of existing buildings
The Dutch strategy for the renovation of buildings is based on the Energy Agreement signed in 2013,
endorsed by around 40 parties, public and private, with strong ambitions, goals, intentions and agreements
regarding energy saving in many areas in The Netherlands. By the end of 2016, the Cabinet presented the
Energy Agenda. Herein, the requirements for the long term are set to 2050. The Energy Agenda will have a
major impact on the renovation strategy for buildings.
The point of departure of the Energy Agreement is that building owners – i.e., housing corporations,
citizens, companies, institutions and governments - have self-interest in and take responsibility for energy
saving, but need support. A coordinated effort by the government, municipalities, contractors, builders,
installation companies, banks, building owners and landlords is necessary. A combination of information-
sharing and awareness-raising, with care and funding support has been chosen as the most effective
measure to increase support. In 2016, it was decided to phase out offices and rented houses with an
energy label worse than label C and a contractual agreement was made with energy suppliers, installers
and network administrators.
For the longer term, the Energy Agenda has described the strategy to achieve CO2 neutral low temperature
heating in the Netherlands by 2050. The gradual reduction of the use of natural gas in the built
environment is a decision with major consequences. The elaboration of strategies will take place at regional
level, as alternatives to space heating in the built environment may differ at regional and local level. Energy
savings will be part of these regional strategies.
At the signing of the Energy Agreement in 2013, a guarantee committee has been set up to monitor
compliance and understand the results of the Energy Agreement. The ‘Borgingscommissie’ Committee
ensures that the agreed measures are taken, and that this agreement does not remain an intention. In this
context, the National Energy Explorations (NEV) were published in 2014, 2015 and 2016. The National
Energy Explorations, conducted annually, analyse the Dutch energy economy and outline plausible future
developments in established and planned policies. The measures of the Energy Agreement for Sustainable
Growth are included in these analyses.
Based on the results in the National Energy Exploration 2015, an intensification package with measures was
adopted in spring 2016, of which the label C obligation for offices is the most important for energy saving in
the built environment.
The impact of this intensification package in the built environment is estimated at 10.0 PJ in 2020 (range
6.7 - 27.7 PJ) (Energy Enhancement Package, ECN 2016). The National Energy Exploration 2016 has not yet
included all the measures of this intensification package because they have not yet been dealt with in a
concrete way. Based on established policies and the intended (sufficiently concrete) policy, the final energy
saving in the built environment is estimated at 27 PJ per year (range 13-43 PJ).
In the autumn of 2016, additional measures were agreed, among which was the obligation to phase out
rental housing with a label worse than label C. This measure gives about 5 PJ additional energy savings
compared to the NEV 2016. A task agreement (“covenant”) was undertaken between energy suppliers,
installers, network administrators and the government to trigger an energy saving market and achieve a
savings goal of 10 PJ by 2020.
The Ministry of the Interior (BZK) started the three-year national activation campaign “Save energy now” in
October 2016. This campaign aims to encourage private homeowners to save energy in their own homes by
raising the urgency and removing common questions and concerns. The target group includes all
homeowners with a label C or worse. In addition to commercials on radio and television, there is also a

                                                                                                               7
Implementing the Energy Performance of Buildings Directive 2018 campaign website, where homeowners can ask questions, view measures and subsidy opportunities, and refer to municipal energy information centers and suppliers of products and services. On 1 September 2016, a subsidy scheme for energy-saving of own houses was published. A total budget of 60 million € was made available to homeowners who carry out at least two major insulation measures. For an integral, highly energy-efficient package (the insulation package belonging to a “zero-energy-bill house”), a further 4,000 € bonus can be made available. Subsidies are also available for energy advice and the creation of a green multi-annual maintenance programme for building owner associations (VVE’s). 2.II.ii. Plans to improve the existing building stock A number of measures are foreseen in the near future, to stimulate energy efficiency in the built environment. The focus is on the application of alternative high-efficiency systems during major renovations. Extra attention will be given to enlarge the economic value of the EPC during the selling and buying process of houses and buildings. Also, the market for energy efficiency will be further developed. The development of a national renovation programme focused on large-scale neighbourhoods is currently in full swing with special attention on the development of neighbourhoods with renewable energy systems not requiring natural gas as an energy source. The Dutch government supports two relevant initiatives, the “Energiesprong4” and the “Stroomversnelling”5, with 45 million € grant. “Energiesprong” (energy jump) is an initiative that aims to reach very energy-efficient renovations in both the private and social housing sector. From the yearly report “Energiesprong 2014”, nearly 130 zero-energy-bill houses have been realised in 2014. “Stroomversnelling” (acceleration) aims to renovate 111,000 social housing buildings and 50,000 privately- owned houses to the level of the net zero-energy bill by the year 2021. Laws and legislation are adapted to enable owners to get a refund (EPV “Energiepresetatievergoeding”) from tenants for having reduced their energy bill through investments in energy efficiency and/or on-site energy production, thus consuming only as much energy as is generated over the course of the year. This solves the problem of the split incentive, in which the costs of energy efficiency measures are the responsibility of the building investor or owner, whereas the benefits of a lower energy bill go exclusively to the tenants. 2.II.iii. Regulation of system performance, distinct from whole building performance (see Tables 2 and 3 in section I.ii) 2.II.iv. Encouragement of intelligent metering Following a positively evaluated national cost-benefit analysis and a small-scale experience phase, the Dutch parliament agreed in 2014 to introduce a smart gas and electricity meter in all homes and small businesses by 2020. The distribution system operators are responsible for offering smart meters, for granting access to the metering data to the energy supplier, and for collecting and validating the metering data for other third parties upon customer request. The highest benefits associated with the smart meter rollout appear to go to the customer, as the advantages of energy savings and efficiency improvements in 8
Implementation of the EPBD in The Netherlands                                              Status in December 2016

the market largely benefit the customer (Figure 3 for electricity). Therefore, part of the rollout strategy is to
encourage the consumer to opt for a smart meter with detailed meter readings, and to use it as efficiently
as possible. Furthermore, the smart meters are considered a significant contributor to a future smart grid
system.

              Figure 3. Share of main benefits associated with electricity smart metering rollout.

2.II.v. Financial instruments and incentives for existing buildings
Measures currently running at the end of 2016 are:
1. “SDE+”: a subsidy scheme for investments in renewable energy systems such as geothermal systems
   and bio-based installations;
2. “EIA”: a tax reduction for investments in innovative sustainable energy systems based on an EPC
   indicator;
3. possibilities for an extra mortgage for private investment in extreme energy efficiency measures (zero
   energy bills) up to a maximum of 25,000 €;
4. “National Energy saving Fund” (NEF): cheap loans for energy saving measures for private owners
   (300 million €);
5. “STEP”: a subsidy scheme for social housing corporations for investment in energy efficiency
   (400 million €) based on EPC improvements;
6. “Funds for the Energy Saving Rental Sector” (FEH): cheap loans for extreme energy efficient renovations
   (75 million €);
7. “Energie Prestatie Vergoeding”: social housing corporations that rent houses or apartments with a
   “zero-energy-bill house” can oblige the occupants to pay a contribution to the energy investments; this
   overcomes the barrier of the split incentive;
8. “SEEH”: a subsidy scheme for investments in energy saving measures for private owners (65 million €).

                                                                                                                9
Implementing the Energy Performance of Buildings Directive 2018
2.II.vi. Information campaigns / complementary policies
Between January and March 2015, 4.5 million home owners that did not have an EPC received a letter with
a temporary energy label for their home. The intention of this initiative was to make them aware of the
energy performance of their property and the opportunities to improve it, as well as of their obligation to
have a definitive EPC when selling or renting their house. The latter obligation was also communicated
through social media and other national and regional public channels. Municipalities developed additional
awareness campaigns and organised local information desks.
A new national campaign focusing on how to make homes more energy-efficient started in 2016. The
slogan and figurative mark (Figure 4.) ensure recognisability in the different campaign expressions.
The “Saving energy now” campaign will run until 2018. The first phase will focus on improving home
insulation in the private owned sector. Later, the focus of the campaign will shift to, e.g., other energy-
saving measures or specific target groups.
The Association of Dutch Municipalities (“Vereniging van Nederlandse Gemeenten”6) regionally and locally
supports the campaign with the so-called Energy Centres. The Energy Centres offer homeowners the
possibility of personal advice on energy saving measures, and assistance in finding a suitable building
company.
Figure 4. National “Saving energy now” campaign.
2.III. Energy Performance Certificate requirements
The EPC system has been in place since 2008 and more than 3.5 million EPCs (> 50% total building stock;
residential, commercial and public buildings) have been registered under this legislation.
2.III.i. Progress and current status on sale or rental of buildings and EPCs
In the period between 1 January 2015 and 30 November 2016, 991,311 labels, based on the new EPC, were
issued (including sales and rented properties).
Table 6 shows the transaction rates of residential buildings (houses), with or without EPC, in 2015 and
2016. These include the new EPCs as well as the Energy Index Report (EI).
Labels New EPC EI (Energy Index report) Total
residential buildings
Total 2015 286,763 186,607 473,370
Total 2016 237,819 280,122 517,941
Total 2015&2016 524,582 466,729 991,311
Table 5. Labels issued over the period between 1 January 2015 and 30 November 2016
10Implementation of the EPBD in The Netherlands Status in December 2016
2016 Transactions Transactions Transactions sales % Transactions sales %
Labels sale sales with with requirement with requirement of
residential (with or without requirement of of EPC, without EPC, with EPC
buildings requirement* of EPC EPC
EPC)
January 16,945 15,584 2,656 17% 12,928 83%
February 21,022 19,475 2,680 14% 16,795 86%
March 22,422 20,443 3,319 16% 17,124 84%
April 21,705 19,690 3,025 15% 16,665 85%
May 22,068 19,849 2,546 13% 17,303 87%
June 25,565 22,005 3,050 14% 18,955 86%
July 26,342 23,904 2,971 12% 20,933 88%
August 26,295 24,338 2,625 11% 21,713 89%
September 28,457 25,942 3,091 12% 22,851 88%
October 22,843 20,696 2,523 12% 18,173 88%
November 24,615 22,255 2,839 13% 19,416 87%
December 37,846 33,306 4,539 14% 28,767 86%
Total
296,125 267,487 35,864 13% 231,623 87%
transactions 2016
2015 Transactions Transactions Transactions sales % Transactions sales %
Labels sale sales with with requirement with requirement of
residential (with or without requirement of of EPC, without EPC, with EPC
buildings requirement of EPC EPC
EPC)
January 14,112 13,516 5,156 38% 8,360 62%
February 14,886 14,384 4,458 31% 9,926 69%
March 17,367 16,791 4,509 27% 12,282 73%
April 20,626 19,673 5,330 27% 14,343 73%
May 16,403 16,006 4,494 28% 11,512 72%
June 18,878 18,418 4,964 27% 13,454 73%
July 27,174 26,648 5,505 21% 21,143 79%
August 18,788 18,466 3,753 20% 14,713 80%
September 20,395 19,732 3,728 19% 16,004 81%
October 21,574 19,738 3,283 17% 16,455 83%
November 25,159 23,587 3,221 14% 20,366 86%
December 33,537 30,286 6,390 21% 23,896 79%
Total
248,899 237,245 54,791 23% 182,454 77%
transactions 2015
* Some transactions do not have an EPC requirement, for instance monumental buildings or the transaction of a piece of land.
Tables 6a and 6b. Transaction rates of residential buildings (houses), with or without EPC, in 2015 and 2016.
11Implementing the Energy Performance of Buildings Directive 2018 According to data collected by the Land Registry and Mapping Agency (“Kadaster”)7, at the beginning of 2016, 83% of houses with an EPC requirement had an EPC at the moment of sale. This had risen to 86% at the end of 2016. A study in 2015, carried out among housing corporations, revealed slightly higher compliance rates for rented buildings than for sold ones. The presence of the label is checked by the “Inspectie voor de leefomgeving en Transport” (IL&T, the National Governmental Inspection Authority 8) of the Ministry for Infrastructure and the Environment. 2.III.ii. Quality Assurance of EPCs Since 1 January 2015, experts for residential buildings (“Erkend Deskundige Energielabel Woningbouw”) must meet the requirements of the former system or pass a new simplified exam. The exam is organised by “SVMNIVO”9, the exam centre for the real estate industry. In addition, experts must follow a training course from RVO.nl to learn how to operate the web tool on the RVO website10. Checks and sanctioning is part of the new system that is operational since 1 January 2015 and carried out by the IL&T. In 2016, 1,571 EPCs were checked by the IL&T. In 77 EPCs, the IL&T found errors in the input data. More than 95% of the EPCs were correct. Recognised experts in whose EPCs errors have been detected will be checked again in early 2017. If this non-compliance situation is repeated, the specific experts will lose their license and will be excluded from activities related to EPCs. 2.III.iii. Progress and current status of EPCs on public and large buildings visited by the public The obligation to display the label has been mandatory since 2008. In 2015, 1,183 public buildings (municipality, province and government buildings) were identified, and 584 of them were checked by the IL&T. 245 of these buildings had not yet displayed their energy label. Another 380 public buildings were inspected in 2016. The IL&T can give owners of such buildings a financial penalty in case of non-compliance. To date, several owners of public buildings have received a warning of non-compliance with the requirement for public display of the EPC. They are given a 6 months period to become compliant and will be checked again after this period. 2.III.iv. Implementation of mandatory advertising requirement – status The presence of the label in advertising is checked by the IL&T. Of all houses sold in The Netherlands, 80% are advertised on the website of the real estate chain, “Funda”. The remaining 20% are sold through other agencies or means, in most cases without an advertisement. On the “Funda” website, the preliminary EPC is presently shown in 100% of the cases, along with the characteristics of the property. Only 18% of the advertisements show the final label. The obligation to publish the final label is only mandatory if an EPC already exists. In many cases, house owners have not registered their final EPC when the advertisement is published. This explains the relatively low number of final labels. 12
Implementation of the EPBD in The Netherlands                                              Status in December 2016

2.IV. Inspection requirements – heating systems, air conditioning
In The Netherlands, mandatory inspections are in place for gas-fired heating systems with more than 100
kW, and for non-gas-fired heating systems with more than 20 kW heating capacity. This obligation is
regulated in the “Activiteitenbesluit Stookinstallaties” (Activities Decree and Activities Regulations)11. For
gas-fired heating systems between 20 kW and 100 kW, The Netherlands has opted for an alternative
approach: since gas-fired systems between 20 and 100 kW are used for heating in more than 5 million
homes (over 90% of the existing housing stock), The Netherlands has opted for a system of voluntary
inspection and maintenance, combined with energy-saving advice for these systems.

2.IV.i. Report on equivalence of model A and B for Heating Systems
There is no description of main justifications available at this moment.

2.IV.ii. Progress and current status on heating systems
The proportion of systems with regular maintenance is already high, at approximately 90% in 2011, but it
has decreased in recent years, partly as a result of the economic crisis. Moreover, the quality of the
performed maintenance and inspections varies. For these reasons, in collaboration with the Installer
branch, a new quality label was developed and put on the market in 2015 called “OK-CV”12. Regular
maintenance under “OK-CV” is combined with an inspection and savings advice.
A communication and marketing campaign among contractors was conducted in 2014 (Figure 5).
From 2015, licenses to carry out the maintenance and inspections under the quality label are issued to
contractors. The government supports the further development and communication of “OK-CV”.
The quality of the assessment is checked by the “OK-CV” organisation that has developed a database with
all results of inspections. If inspectors fail to meet the “OK-CV” standards, they lose their license.

                                         Figure 5. Campaign brochure OK-CV

                                                                                                                 13
Implementing the Energy Performance of Buildings Directive 2018 2.IV.iii. Progress and current status on AC systems There has been a mandatory inspections regime for AC systems in place since 1 December 2013. This comprises a mandatory inspection for systems larger than 12 kW. Private homes are excluded from this regime because there are very few such systems in houses. 2.IV.iv. Enforcement and impact assessment of inspections Enforcement and penalties The “Activiteitenbesluit” includes regulations for inspection and maintenance of gas-fired heating systems above 100 kW and non-gas-fired heating systems above 20 kW (Activities Decree, Article 3.7, paragraph 4, 3.10p and Activities Regulations, Article 3.7m)13. The periodic inspection ensures safe operation as well as optimum combustion and energy-efficient functioning. The risks of air pollution (CO, NOx, SO2, particulate matter and CxHy), explosion and energy waste are addressed. An inspection includes checking the system for the supply of fuel and combustion air, the exhaustion of combustion gases and the adjustment for combustion efficiency (Activities Regulations, Article 3.7, paragraph 3). The holder of the combustion plant shall keep the final report available for the authority. The IL&T carries out random checks to verify that the mandatory inspection has been performed. Owners who have not had an inspection performed, currently get a 6-months period for doing so. If they fail to meet the requirement within this timeframe, they can get a fine of up to 20,250 €. Accredited inspectors have to take a new exam every 5 years. If they fail, they will be removed from the RVO database. Inspection figures for 2014-2015 are not available. Quality control of inspection reports The “Stichting Certificering Inspectie en Onderhoud Stookinstallaties” (SCIOS)14 inspectors record their findings in the inspection report. The supervisor of the competent authority (usually municipalities) checks if inspections have taken place and if reports are available. The municipalities can access the SCIOS database, where all inspections are recorded via a secure web application. The IL&T also carries out random checks to determine if the inspection reports meet the requirements. If a report does not live up to quality standards, the owner will get a formal notification from the IL&T stating that they have 6 weeks to acquire a new, improved inspection report. If owners do not comply, they will be placed in default and they will be fined as if they had not had an inspection performed in the first place, at a maximum of 20,250 €. Impact assessment. Costs and benefits No data available at this stage. 14
Implementation of the EPBD in The Netherlands                                            Status in December 2016

3. A success story in EPBD implementation
The introduction of the new energy performance label in The Netherlands has changed the landscape of
the Dutch built environment. While the previous label was merely technical and expensive and suffered
resistance among the Dutch population, the new simplified label has empowered citizens to directly
influence their energy use. The practical advice has given building owners concrete steps for improvement.
The new label has become a marketing tool instead of a technical process. It is motivating for owners to
improve the energy level of their houses and get a new label. A good level is perceived as an indicator for
good quality and an added value. This is also recognised by banks and other financial institutions and has
influenced mortgaging. Banks are investigating if they can offer lower interest rates for better energy
performance labels since 2016. The label has supported builders and installers in their pursuit of energy
efficiency as a new or renewed market. New market offers have sprung up from different companies that
offer integral solutions for homeowners and buildings to upgrade their label. The long-term experience of
Dutch professionals with integral solutions contributes to an increased demand. The voluntary agreement
of the partners in the “Energieakkoord”15 (Energy Accord) gives a central place to improvements of the
label as a vehicle to reach the 2020 objectives16. This broad support has contributed to higher investments
in energy efficiency and renewable energy.
The results of the simplified web-based approach in the first year, since its introduction in January 2015,
are:

•   4.5 million houses got a letter with information about their EPC and a personal pre-setting in the EPC
    web tool17;

•   over 2,000 trained qualified experts, of which over 850 working with the web tool;
•   costs are kept low because of competition, with an average of 25 € per EPC;
•   over 800,000 individual log-ins;
•   over 950,000 registered new EPCs since January 2015 and over 3.5 million EPCs in total (> 50% total
    building stock; residential, commercial and public buildings).

4. Conclusions, future plans
In general, The Netherlands has implemented the EPBD.
For the near future, a number of measures is foreseen to stimulate energy efficiency improvements in the
built environment. The focus is on the application of alternative high efficiency systems during major
renovations. Extra attention will be given to enlarge the economic value of the label during the selling and
buying process of houses and buildings. Also, the market for energy efficiency will be further developed.
Financial support measures running at the end of 2016 are:
1. SDE+”: a subsidy scheme for investments in renewable energy systems such as geothermal systems and
   bio-based installations;
2. “EIA”: a tax reduction for investments in innovative sustainable energy systems based on an EPC
   indicator;
3. possibilities for an extra mortgage for private investment in extreme energy efficiency measures (zero
   energy bills) up to a maximum of 25,000 €;

                                                                                                              15
Implementing the Energy Performance of Buildings Directive 2018
4. “National Energy saving Fund” (NEF): cheap loans for energy saving measures for private owners (300
million €);
5. “STEP”: a subsidy scheme for social housing corporations for investment in energy efficiency (400
million €) based on EPC improvements;
6. “Funds for the Energy Saving Rental Sector” (FEH): cheap loans for extreme energy efficient renovations
(75 million €);
7. “Energie Prestatie Vergoeding”: social housing corporations that rent houses or apartments with a
“zero energy bill” can oblige the occupants to pay a contribution to the energy investments; this
overcomes the barrier of the split incentive;
8. “SEEH”: a subsidy scheme for investments in energy saving measures for private owners (65 million €).
Endnotes
1. wetten.overheid.nl/BWBR0020921/2017-01-01
2. www.rvo.nl/onderwerpen/duurzaam-ondernemen/gebouwen/wetten-en-regels-
gebouwen/energieprestatie-beng
3. www.rvo.nl/initiatieven/overzicht/27008
4. www.energiesprong.nl
5. http://stroomversnelling.nl
6. https://vng.nl/
7. www.kadaster.nl/
8. www.ilent.nl
9. www.svmnivo.nl
10. www.energielabelvoorwoningen.nl/?cookieCheck=true
11. www.ondernemersplein.nl/regel/stookinstallaties
12. www.ok-cv.nl
13. www.rvo.nl/deskundigen/overzicht/27045
14. www.scios.nl
15. www.energieakkoordser.nl
16. http://afsprakengestart.energieakkoordser.nl/public/result
17. www.energielabelvoorwoningen.nl/?cookieCheck=true
This project has received funding from the European
Union's Horizon 2020 research and innovation
programme under grant agreement Nº 692447.
under grant agreement Nº 692447.
The sole responsibility for the content of this publication lies with the authors. It does not necessarily reflect the views of
the European Commission. Neither the EASME nor the European Commission are responsible for any use that may be
made of the information contained therein.
16You can also read