INVESTOR PRESENTATION - APRIL 2021 - Ivanhoe Mines Ltd.
←
→
Page content transcription
If your browser does not render page correctly, please read the page content below
INVESTOR PRESENTATION
            APRIL 2021
DISCLAIMER AND FORWARD-LOOKING STATEMENTS
The information contained in this presentation and other information furnished by or on behalf of Ivanhoe Mines Ltd. (“Ivanhoe”) is confidential and has been prepared to assist the recipients hereof in conducting their own evaluation of Ivanhoe and does not purport to be complete or to contain all of the information a recipient hereof may require. Ivanhoe and its
affiliates make no representation or warranty as to the accuracy, reliability, reasonableness or completeness of this information and shall not have any liability for any representations regarding information contained in, or for any omission from, this presentation or any other written or oral communications transmitted to the recipient in the course of its evaluation of
Ivanhoe. Neither this presentation (nor any part hereof) nor any information or statement contained herein shall form the basis of any contract or commitment whatsoever. The definitive terms of the transactions described herein, if such transactions take place, will be described in the offering materials related to such transactions, when available, and the offering of
notes in such transaction will be made only by way of such offering materials (the “Disclosure Package”), which may differ materially from the information presented herein and in connection therewith. By accepting this presentation, you acknowledge and agree to the foregoing sentence. Prospective investors are advised to read the entire Disclosure Package
carefully, once available, and will be required to conduct their own independent investigation and analysis and consult with their own attorneys, accountants and other professional advisors regarding the merits and risks of any such investment. The information contained in this presentation is not investment or financial product advice and is not intended to be used
as the basis for making an investment decision. This presentation has been prepared without taking into account the investment objectives, financial situation or particular needs of any particular person. As such, this presentation should not be relied upon for the purpose of evaluating the performance of Ivanhoe or for any other purpose.

By accepting this presentation, you hereby acknowledge that you are aware and that you will advise your representatives that the federal and state securities laws prohibit any person who has material, non-public information about a company from purchasing or selling securities of such company or from communicating such information to any other person under
circumstances in which it is reasonably foreseeable that such person is likely to purchase or sell such securities.

This presentation shall not, and is not intended to, constitute or contain an offer or invitation to sell, or the solicitation of an offer to buy, and may not be used as, or in connection with, an offer or invitation to sell or a solicitation to buy, any notes or securities of Ivanhoe or any financial instruments related thereto in any jurisdiction. Neither the U.S. Securities and
Exchange Commission nor any federal, state or provincial securities commission of any jurisdiction has approved or disapproved of the securities or passed upon the adequacy of the Disclosure Package. Any representation to the contrary is a criminal offense.

Certain market data information in this presentation is based on management's estimates. Ivanhoe obtained the industry, market and competitive position data used throughout this presentation from internal estimates and research as well as from industry publications and research, surveys and studies conducted by third parties. While Ivanhoe believes these
sources to be reliable, this information may prove to be inaccurate because of the method by which Ivanhoe obtained some of the data for its estimates or because this information cannot always be verified due to the limits on the availability and reliability of raw data, the voluntary nature of the data gathering process and other limitations and uncertainties.
Statements contained herein describing documents and agreements are summaries only and such summaries are qualified in their entirety by reference to such documents and agreements.

Certain statements in this presentation constitute “forward-looking statements” or “forward-looking information” within the meaning of applicable securities laws, including, without limitation, the timing and results of: (i) statements regarding the ongoing development and exploration work at the Kamoa-Kakula Project, including drilling, underground development,
surface construction activities and feasibility, pre-feasibility and preliminary economic assessment (PEA) studies; (ii) statements regarding the ongoing development work, including Shaft 1 equipping and feasibility and PEA studies, at the Platreef Project; and (iii) statements regarding ongoing upgrading and development work and feasibility and pre-feasibility studies
at the Kipushi Project. As well, the results of the feasibility, pre-feasibility and PEA studies of the Kamoa-Kakula Project, the feasibility and PEA studies of the Platreef Project and the pre-feasibility study of the Kipushi Project constitute forward-looking information, and include future estimates of internal rates of return, net present value, future production, estimates
of cash cost, proposed mining plans and methods, mine life estimates, cash flow forecasts, metal recoveries, and estimates of capital and operating costs.

Such statements involve known and unknown risks, uncertainties and other factors which may cause the actual results, performance or achievements of Ivanhoe, its mineral projects, or industry results, to be materially different from any future results, performance or achievements expressed or implied by such forward-looking statements or information. Such
statements can be identified by the use of words such as "may", "would", "could", "will", "intend", "expect", "believe", "plan", "anticipate", "estimate", "scheduled", "forecast", "predict" and other similar terminology, or state that certain actions, events or results "may", "could", "would", "might" or "will" be taken, occur or be achieved. These statements reflect Ivanhoe’s
current expectations regarding future events, performance and results and speak only as of the date of this presentation.

In making such statements, Ivanhoe has made assumptions regarding, among other things: the accuracy of the estimation of mineral resources; that exploration activities and studies will provide results that support anticipated development and extraction activities; that studies of estimated mine life and production rates at the Kamoa-Kakula Project, the Platreef
Project and the Kipushi Project will provide results that support anticipated development and extraction activities; that Ivanhoe will be able to obtain additional financing on satisfactory terms; that infrastructure anticipated to be developed or operated by third parties, including electrical generation and transmission capacity, will be developed and/or operated as
currently anticipated; that laws, rules and regulations are fairly and impartially observed and enforced; that the market prices for relevant commodities remain at levels that justify development and/or operation; that Ivanhoe will be able to successfully land access with holders of surface rights; and that war, civil strife, and/or insurrection and/or public health crises,
including the COVID-19 pandemic, do not impact Ivanhoe’s exploration activities or development plans.

Although the forward-looking statements or information contained in this presentation are based upon what management of Ivanhoe believes are reasonable assumptions, Ivanhoe cannot assure investors that actual results will be consistent with these forward-looking statements. They should not be read as guarantees of future performance or results. A number of
factors could cause actual results to differ materially from the results discussed in the forward-looking statements, including, but not limited to, the factors discussed under "Risk Factors" in Ivanhoe’s most recent Annual Information Form. These forward-looking statements are made as of the date of this presentation and are expressly qualified in their entirety by this
cautionary statement. Subject to applicable securities laws, Ivanhoe does not assume any obligation to update or revise the forward-looking statements contained herein to reflect events or circumstances occurring after the date of this presentation. Ivanhoe’s actual results could differ materially from those anticipated in these forward-looking statements.

This presentation also contains references to estimates of Mineral Resources (as such term is defined in National Instrument 43-101 - Standards of Disclosure for Mineral Projects ("NI 43-101")). The estimation of Mineral Resources is inherently uncertain and involves subjective judgments about many relevant factors. Mineral Resources that are not Mineral
Reserves do not have demonstrated economic viability. The accuracy of any such estimates is a function of the quantity and quality of available data, and of the assumptions made and judgments used in engineering and geological interpretation (including estimated future production from Ivanhoe’s projects, the anticipated tonnages and grades that will be mined
and the estimated level of recovery that will be realized), which may prove to be unreliable and depend, to a certain extent, upon the analysis of drilling results and statistical inferences that ultimately may prove to be inaccurate. Mineral Resource estimates may have to be re-estimated based on: (i) fluctuations in copper, nickel, zinc, platinum-group elements (PGE),
gold or other mineral prices; (ii) results of drilling, (iii) metallurgical testing and other studies; (iv) proposed mining operations, including dilution; (v) the evaluation of mine plans subsequent to the date of any estimates; and (vi) the possible failure to receive required permits, approvals and licences.

Disclosures of a scientific or technical nature regarding the project development updates at the Kamoa-Kakula Project in this presentation that are not included in the Kamoa-Kakula Technical Report, have been reviewed and approved by Steve Amos, who is considered, by virtue of his education, experience and professional association, a Qualified Person under
the terms of NI 43-101. Mr. Amos is not considered independent under NI 43-101 as he is the Head of the Kamoa-Kakula Project. Mr. Amos has verified such technical data. To the extent that this presentation contains disclosures of a scientific or technical nature regarding the Kakula and Kansoko stockpiles not included in the Kamoa-Kakula Technical Report,
such information has been reviewed and approved by George Gilchrist, who is considered, by virtue of his education, experience and professional association, a Qualified Person under the terms of NI 43-101. Mr. Gilchrist is not considered independent under NI 43-101 as he is the Vice President, Resources of the Company. Mr. Gilchrist has verified such technical
data.

Other disclosures of a scientific or technical nature in this presentation and not included in any of the Technical Reports, including the Western Foreland Exploration Project, have been reviewed and approved by Stephen Torr, who is considered, by virtue of his education, experience and professional association, a Qualified Person under NI 43-101. Mr. Torr is not
considered independent under NI 43-101 as he is the Vice President, Project Geology and Evaluation. Mr. Torr has verified such other technical data.

Information in this presentation is based upon, and certain information is extracted directly from, NI 43-101 compliant technical reports prepared by Ivanhoe for each of the Kamoa-Kakula Project, the Platreef Project and the Kipushi Project, which are available under Ivanhoe’s SEDAR profile at www.sedar.com. These technical reports include relevant information
regarding the effective date and the assumptions, parameters and methods of the mineral resource estimates on the Kamoa-Kakula Project, the Platreef Project and the Kipushi Project cited in this presentation, as well as information regarding data verification, exploration procedures and other matters relevant to the scientific and technical disclosure contained in
this presentation in respect of the Kamoa-Kakula Project, the Platreef Project and the Kipushi Project.

Ivanhoe and its directors, officers, partners, employees, agents, affiliates, representatives and advisors expressly disclaim any and all liability based, in whole or in part, on the information contained in this presentation or any related offering and marketing materials received by any recipient hereof (which only speak as of the date identified on the cover page of this
presentation), errors therein or omissions therefrom.

Cautionary Note to U.S. Investors Concerning Estimates of Reserves and Measured, Indicated and Inferred Resources

Investors are advised that NI 43-101 requires that each category of Mineral Reserves and Mineral Resources be reported separately. Mineral Resources that are not Mineral Reserves do not have demonstrated economic viability.

The information presented in this presentation uses the terms “measured,” “indicated” and “inferred” mineral resources. U.S. investors are advised that while such terms are recognized and required by Canadian regulations, the U.S. Securities and Exchange Commission does not recognize these terms. “Inferred mineral resources” have a great amount of
uncertainty as to their existence, and as to their economic feasibility. It cannot be assumed that all or any part of an inferred mineral resource will ever be upgraded to a higher category. Under Canadian regulations, estimates of inferred mineral resources may not form the basis of feasibility or other economic studies. U.S. investors are cautioned not to assume that
all or any part of measured or indicated mineral resources will ever be converted into mineral reserves. U.S. investors are also cautioned not to assume that all or any part of an inferred mineral resource exists, or is economically mineable.

                                                                                                                                                                                                                                                                                                                                                                                           2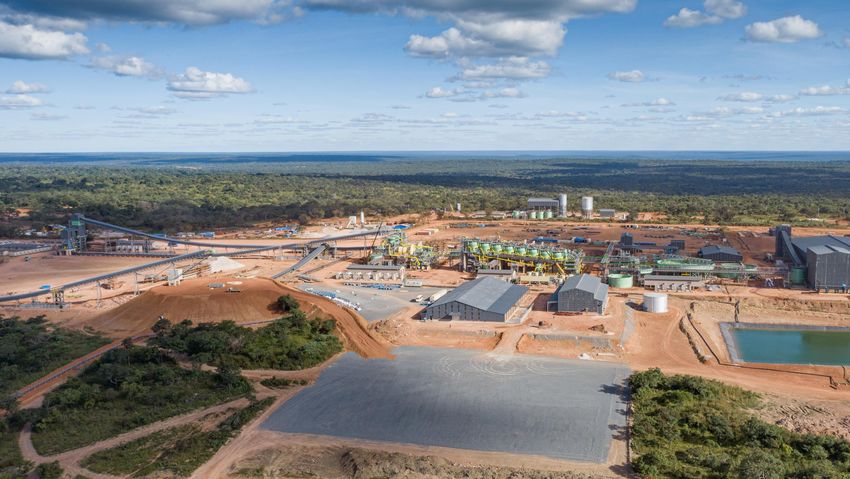
IVANHOE AT A GLANCE
   CORPORATE INFORMATION

                                                 TSX: IVN
  LISTINGS
                                                 OTCQX: IVPAF

  SHARE PRICE                                    C$8.90 / share(1)

  MARKET CAP                                     US$8.58 billion(1)

  SHARES, OPTIONS,                               Common Shares: 1,207.9 million(2)
  RSUs & DSUs                                    Options, RSUs & DSUs: 20.6 million(2)

  CASH POSITION                                  US$263 million(3)

                                                 CITIC Metal                             26.1%

                                                 Zijin Mining                            13.7%

                                                 Robert Friedland                        13.5%
  MAJOR
  SHAREHOLDERS                                                                          Fidelity
                                                                                       Invesco
                                                                                      Blackrock
                                                 Institutional
                                                                                      Rothschild
                                                 Investors(4)
                                                                                     Skagen AS
                                                                                      Vanguard
                                                                                     Dimensional
(1) As of April 28, 2021 using a US$:C$ exchange rate of 1.27.                                                  At a drill site on Iv anhoe M ines’ W estern Foreland licenses in the
(2) As of March 4, 2021.
(3) Cash & cash equivalents as of December 31, 2020; does not include March 2021 $575M senior notes financing    DRC. Left: G eologist Nestor Kambaj; Right: G eology T echnician
                                                                                                                                                                                        3
(4) Source: Bloomberg.                                                                                                                      Patrick Ndala.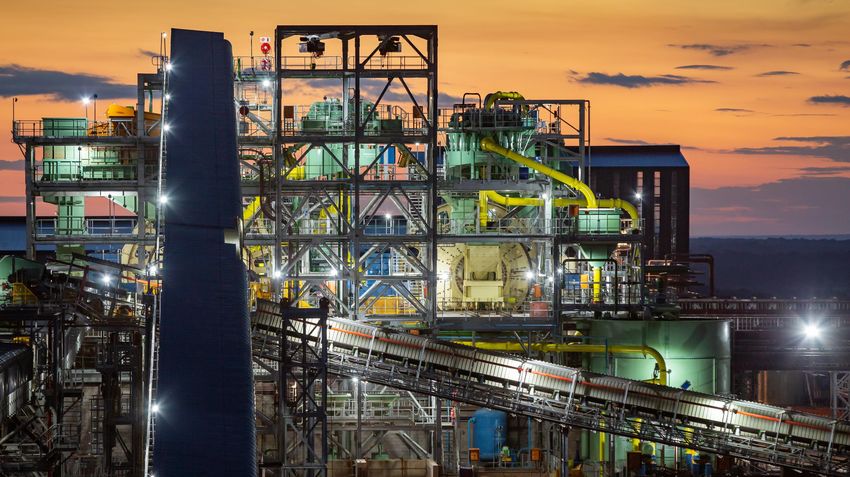
A LEADING EXPLORER & DEVELOPER IN AFRICA

                                                                          OWNERSHIP:
                                                  KAMOA-KAKULA
                                                                          Ivanhoe Mines (39.6%)
                                                                          Zijin Mining Group (39.6%)
                                                                          Government of the DRC (20%)
                                                                          Crystal River Global (0.8%)

                                                                          STAGE:
                                                                          First production expected soon
     WESTERN
     FORELAND                                           Copper

                        OWNERSHIP:
                        Ivanhoe Mines (90-100%)

                        STAGE:
       Copper
                        Exploration

                                                                          OWNERSHIP:
                             PLATREEF                  KIPUSHI
OWNERSHIP:                                                                Ivanhoe Mines (68%)
Ivanhoe Mines (64%)                                                       Gécamines (32%)
B-BBEE Partners (26%)
Japanese Consortium
led by Itochu (10%)                                                       STAGE:
                                                                          Feasibility Study in
STAGE:                                                                    Progress
Construction
                         PGMs, Nickel, Copper     Zinc, Copper, Silver,
                                                      Germanium                                      4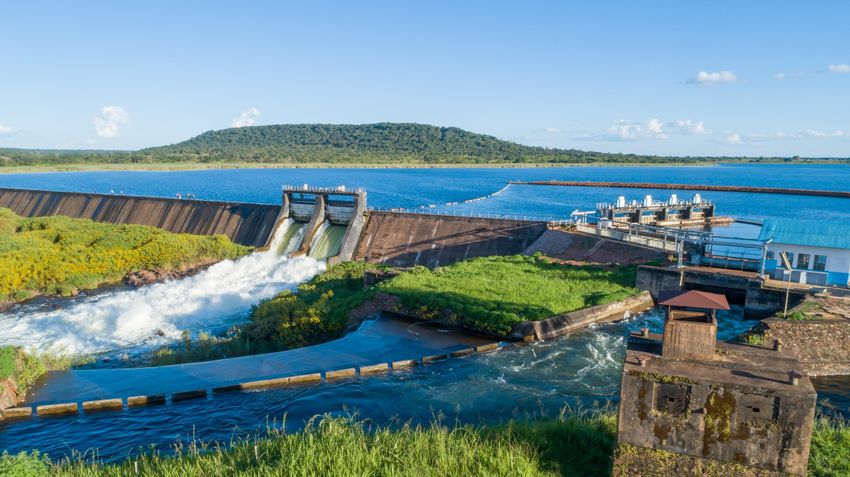
INVESTMENT HIGHLIGHTS

                                                                                                                                 29
                                                                                                                                   Cu
•   Three long-life, world-   •   Robust, experienced        •   Committed support         •   Strong balance sheet       •   Near-term copper:
    class mines with low          management team with           from key partners CITIC       with cash & cash               Kakula is on track to
    costs, low capital            a strong track record of       and Zijin                     equivalents of approx.         begin production soon;
    intensity and low             exploration & execution                                      $263 million (at Dec 31,       copper production to
    environmental                 success                    •   Strong in-country             2020)                          double to approx. 400kt
    footprints                                                   support &                                                    in Q3 2022
                              •   Poised to grow Ivanhoe         relationships: DRC has    •   Additional $575 million
•   Objective to become           into the next world-           20% stake in Kamoa-           raised in March 2021       •   Exploration knowledge
    best-in-class in ESG          class mining company           Kakula and B-BBEE             through a convertible          and massive land
                                                                 Partners have 26%             bond offering                  package for future
                                                                 stake in Platreef                                            copper discoveries in
                                                                                                                              DRC
                                                                                                                                                        5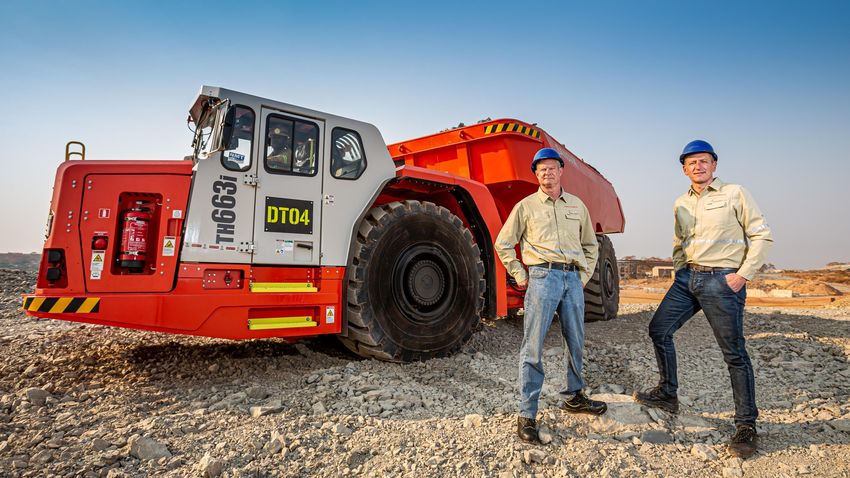
WELL CAPITALISED TO FUND HIGH-RETURN EXPANSION OPPORTUNITIES
                                                      $575 million offering of
                                                      2.50% convertible notes due                                      $838
                                                                                                                                                                                            OPPORTUNITIES
                                                      2026 completed March 2021                                                                KAKULA PHASE 2
                                                                                                                                                 •   $600 million direct capital cost on 100% basis

 Kakula Mine expected                                                                                                                          KAKULA PHASE 3 & DOWNSTREAM STRATEGY
 to generate cash flow                                                                                             Convertible                   •   Potential smelting complex to produce blister and anode copper
                                                                                                                     Note                        •   Engineering studies at Kansoko, Kamoa North and Kakula West
 from H2 2020                                                                                                      Offering(4)
                                                                                                                     $575
                                                                                                                                               INGA II HYDROPOWER PROJECT
                                                                                                                                                 •   Upgraded Turbine 5 to produce 162 MW of renewable hydropower

                                                                                  $28               $284                                       PLATREEF DEVELOPMENT SCHEDULE
                                            $27
                                                               $16                                                                               •   Potential funding from $420 million project-level financing at Platreef(5)
                         $59
            (1)
     $154                                                                                                             Cash(3)
                                                                                                                                               WESTERN FORELAND ACCELERATION
                                                                                                                       $263
                                                                                                                                                 •   Plan to expand US$16 million exploration program

                                                                                                                                               KIPUSHI MINE REDEVELOPMENT
Kamoa-Kakula           Platreef           Kipushi         Exploration          Corp.             Total 2021         Pro Forma                    •   Feasibility study and agreement on the development and financing plan
                                                                              Overhead            Budget(2)           Cash                           expected in mid-2021

                     2021 BUDGET AND FUNDING ESTIMATES
Notes: All figures in US$ millions. (1) Ivanhoe’s expected, proportionate funding of the Kamoa-Kakula Project for 2021; expected funding of Kamoa-Kakula assumes utilization of
equipment finance facility for Phase 2. (2) Ivanhoe’s 2021 budget per Q4 2020 MD&A dated March 4, 2021. (3) As of December 31, 2020. (4) Gross proceeds of convertible debt
offering. (5) Includes $300 million non-binding term sheet from Orion Mine Finance; subject to completion of due diligence, structuring and negotiation & execution of definitive
documentation, as well Nedbank and Societe Generale have been appointed in February 2021 to arrange a senior project debt facility of up to $120 million.                                                                         6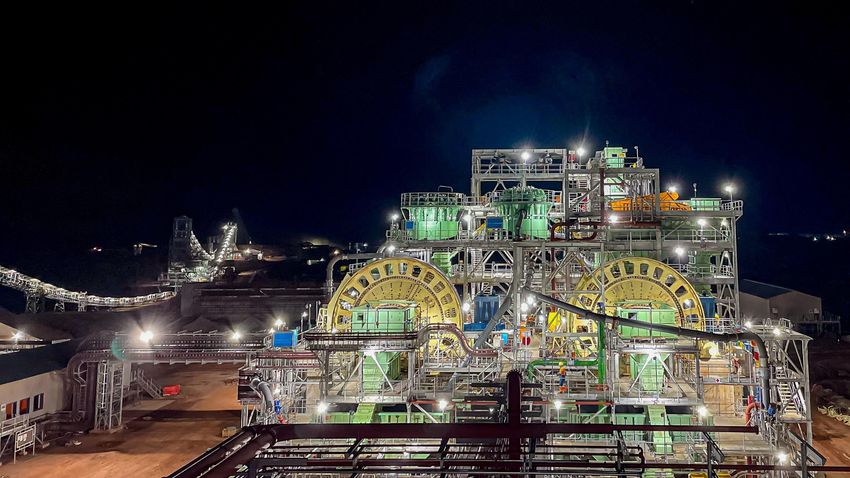
IVANHOE WILL PRODUCE
                                                             GREEN METALS

      HYDROPOWER                      SMALL FOOTPRINT            LOW IMPACT                GREEN METAL
Water efficiency; powered by clean,       Underground           Majority of tailings       Ultra high grades;
green hydro-electricity; Low water      mines with limited    returned underground;
 consumption per ounce of 4PE                                                              renewable power;
                                        surface footprint    Platreef dry-stack tailings        less CO2
       using recycled water                                                                                     7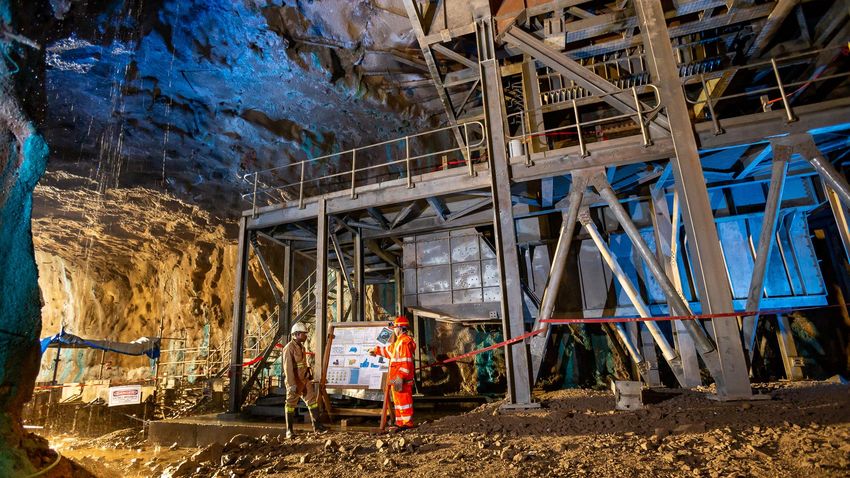
KAMOA-KAKULA: TIER-ONE CARBON FOOTPRINT

                                                            Kamoa-Kakula

                                         0.16t
                                         CO2e/t Cu

                                              Benchmarked Mines

                                         0.19t                                                                                                                                                                                    2.8t
                                         CO2e/t Cu
                                                                                   Emissions per tonne in copper concentrate                                                                                                      CO2e/t Cu

1. Based on the publicly-available information, not independently verified by Hatch.

Hatch has relied on Feasibility Study data provided by Ivanhoe and other third party providers; and has not independently verified either the data provided or the public data used for benchmarking. Hatch has calculated a metric to two decimal places for
comparative purposes only and it should not be considered to be representative of the level of accuracy for the projected metric. Kakula Mine (6 Mtpa) average projected GHG emission intensity over the production years 2023-2038.                            8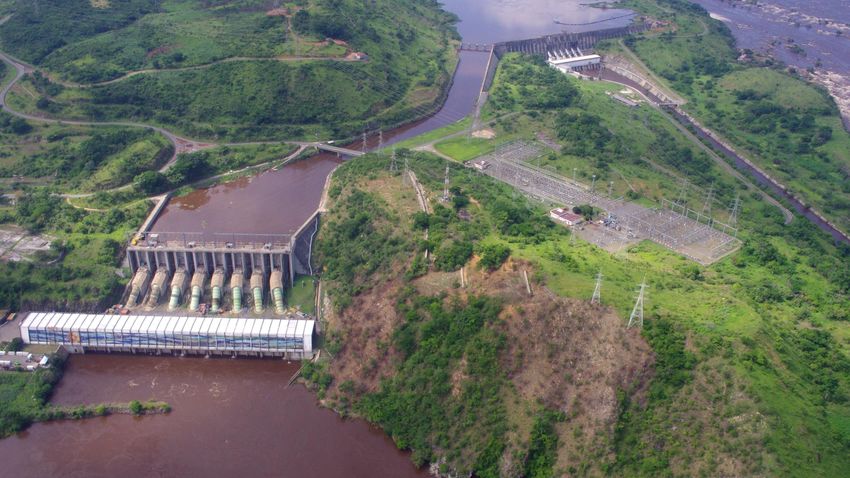
UPGRADING TURBINE 5 AT THE INGA II HYDROPOWER COMPLEX

            Kamoa-Kakula JV agreement with the DRC’s state-
            owned power company to upgrade Turbine 5 at Inga II

            162 MW of renewable hydropower, providing power for
            future expansions (beyond Phase 2) at Kamoa-Kakula
            and associated smelter

            President Félix Tshisekedi expresses support for the
            Turbine 5 upgrade at Inga II

            240 MW combined output from the Mwadingusha and
            Inga II hydropower plants also will benefit local
            communities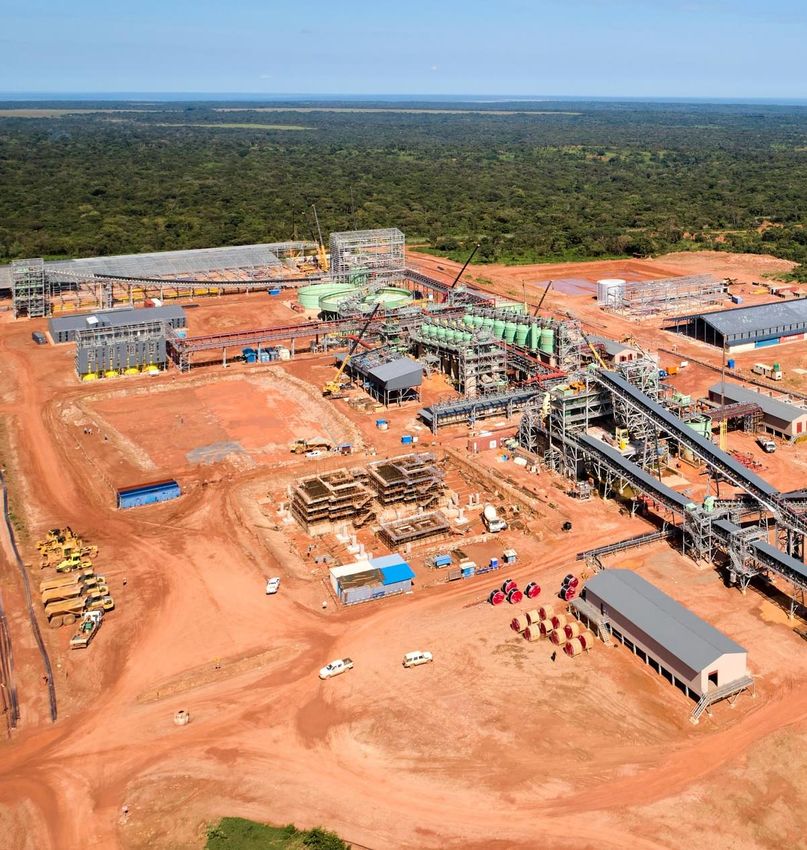
KAMOA-KAKULA IN SUMMARY

          Fully funded to first copper production

          Phase 1 construction essentially complete, with 2.56
          Mt ore stockpiled at the end of March at 4.60% Cu

          Among the largest and lowest cost copper mines in
          the world

          Ultra high copper grades support strong financial
          returns for all stakeholders in a major mining
          project

          Significant expansions planned to 19 Mtpa
          production rate, funded from cash flows
   .
                                                                 10
UNRIVALLED RESOURCE BASE
• One of the world’s largest and highest-grade copper deposits with 38.0 Mt
KAMOA-KAKULA •
(Ind.) + 5.7 Mt (Inf.) of contained Cu(1)
Mineral reserves of 10.5 Mt of contained Cu at an average grade of 4.47%(2)
• Open down dip and along strike – excellent exploration potential
One of the World’s APPROACHING FIRST PRODUCTION
Largest and • ~$336M(3) (100% basis) capital remaining to first concentrate production
• Peak production of 805 ktpa(4) Cu from Kamoa-Kakula would establish the
Highest-Grade project as the second-largest copper mine globally
Copper Discoveries PHASE 2 EXPANSION PLAN ACCELERATED
• Phase 2 mill expansion will double capacity from 3.8 Mtpa to 7.6 Mtpa
• Expansion plans accelerated to Q3 2022, with orders placed for long-lead
items for the concentrator and construction underway
EXCEPTIONAL GRADES; LOW CASH COSTS
• Positioned to be among the world’s lowest-cost copper mines
• Expected to rank in the lowest quartile of the global cash cost curve(5)
• Average grade of 5.9%(6) copper over the initial 10 years of operations
POWER AND INFRASTRUCTURE IN PLACE
• Rehabilitating existing hydroelectric facilities, with first nearing completion
(1) At 1.0% copper cut-off.
(2) Kamoa-Kakula Mineral Reserves per the October 2020 Kamoa-Kakula Integrated
and second agreement announced
Development Plan technical report.
(3) As of December 31, 2020.
• Significant surface infrastructure already completed
(4) Recovered copper production based on 19 Mtpa PEA case.
(5) Based on mine site cash costs.
11
(6) Average grade over first 10 years of the 7.6 Mtpa PFS case.Left: Kakula’s main
ADVANCED CONSTRUCTION WITH SIGNIFICANT pre-production
PRE-PRODUCTION STOCKPILES stockpiles at the
northern declines with
the concentrator and
• On-track for early completion of the Phase 1 concentrator; backfill plant in the
background.
90% complete as of end of March 2021 measurement
• Pre-production ore stockpiles significantly ahead of plan:
with 2.56 Mt ore stockpiled at 4.60% as of end of March
• During March 2021, mine produced 400,000 tonnes of ore Right: Commissioning of
grading 5.36% copper, exceeding steady-state monthly conveyor from underground to
run-of-mine ore stockpile.
requirement of Phase 1 concentrator
Included 100,000 tonnes at a grade of 8.70% copper
Cumulative Contained Copper Stockpiled(1)
140
Contained Copper (kt)
120
100
80 Left: Connecting
pneumatic control
60 valves on the primary
40 mill cyclones.
20
--
Stockpile Contained Copper (Actual) Stockpile Contained Copper (PFS Projection)
(1) Projected growth in contained copper in pre-production stockpiles at the Kakula and Kansoko mines up to July 2021. 12
Dotted lines denote projections based on the 2020 pre-feasibility study.KAMOA–KAKULA AMONG THE WORLD’S LARGEST COPPER DEPOSITS
Measured & Indicated Resource and Grade Inferred Resource and Grade
150 3.0%
Contained Copper (Mt)
Copper Grade (%)
125 2.5%
100 2.0%
75 1.5%
50 1.0%
25 0.5%
- -
Source: Company filings, Wood Mackenzie.
13
Note: Selected based on copper contained in Measured & Indicated Mineral Resources, inclusive of Mineral Reserves.KEY
KEYHIGHLIGHTS:
HIGHLIGHTS: Shown on 100%-basis in US$ Kakula-Kansoko PFS Kamoa-Kakula PEA
OCTOBER 2020
SEPTEMBER
PFS AND PEA 2020
Annual Production (Avg.) 7.6 Mt 19 Mt (5 x 3.8Mt)
DFS, PFS AND Mill Feed Grade(1) 5.9% 5.1%
PEA Copper Metal Produced(1) 331 ktpa 501 ktpa
Mine-Site Cash Cost(1) $0.55/lb Cu $0.65/lb Cu
Total Cash Cost(1) $1.23/lb Cu $1.07/lb Cu(4)
$0.3bn(5) Remaining
Remaining Initial Capital(2) $0.7 Bn as at 12/31/2020
$0.7 Bn
Expansion Capital $0.75 Bn $4.5 Bn
$2.50 / lb Cu After-tax NPV8% | IRR (Real) $3.9 Bn | 49% $6.3 Bn | 38%
$3.10 / lb Cu After-tax NPV8%(3) | IRR (Real) $6.6 Bn | 69% $11.1 Bn | 56%
$3.50 / lb Cu After-tax NPV8% | IRR (Real) $8.4 Bn | 81% $14.3 Bn | 67%
$4.00 / lb Cu After-tax NPV8% | IRR (Real) $10.5 Bn | 93% $18.1 Bn | 80%
$4.50 / lb Cu After-tax NPV8% | IRR (Real) $12.0 Bn | 100% $20.9 Bn | 89%
(1) First ten year average.
(2) As at July 1, 2020 per the October 2020 Kamoa-Kakula Integrated
Development Plan technical report.
1.
Fully funded to first On track for early
(3) First ten yearlong-term
Consensus average.copper price of $3.10/lb and $200/t acid.
2. Including smelter.
(4) Net of sulphuric acid credit of $200/t. copper production completion of Phase 1
3.
(5) Consensus
100% basis.long-term copper price of $3.10/lb and $200/t acid. Includes the
impact of the 2018 DRC Mining Code. concentrator 14KAMOA-KAKULA – AMONG THE WORLD’S LARGEST COPPER MINES (1)
1,400
Paid Copper Production (ktpa)
1,200
1,000
800
600
400
200
--
Source: Company filings, Wood Mackenzie.
(1) Kamoa-Kakula 2020 PEA production based on projected peak copper production (which occurs in year 8) of the 19 Mtpa alternative development option. 15KAKULA-KANSOKO – FIRST QUARTILE MINE SITE CASH COST (1)
$4.00
Total Cash Cost (First Ten Years): $1.23/lb Cu
$3.50
2020 Mine Site Cash Costs (US$/lb Cu)
$3.00
$2.50
$2.00
$1.50
$1.00
$0.50 Kakula-Kansoko (First Ten Years): $0.55/lb Cu
--
-- 20% 40% 60% 80% 100%
Cumulative Global Copper Production
Source: Company filings, Wood Mackenzie.
(1) Represents Wood Mackenzie mine site cash costs. Kakula-Kansoko is based on the average mine site cash cost during the first 10 years as detailed in the Kakula-Kansoko 2020 PFS. 16KAMOA-KAKULA: INTEGRATED DEVELOPMENT PLAN
Kamoa-Kakula: Projected to Become the World’s Second Largest Copper Mine
Phase 5 (Full Processing Capacity)
19.0
Phase 4
15.2
Kakula West Mine
Milled (Mtpa)
11.4 Phase 3
Kamoa North
Kansoko Mine Mines
7.6 Phase 2 (7.6 Mtpa) Q3 2022
Phase 1 (3.8 Mtpa) July 2021
3.8
Kakula Mine
Direct-to-Blister Smelter
Commences (PEA Only)
–
2020 2022 2024 2026 2028 2030 2032 2034 2036 2038 2040 2042 2044 2046 2048 2050 2052 2054 2056 2058
Year
Kakula Mine Kansoko Mine Kakula West Mine Kamoa North Mines 17WESTERN FORELAND:
THE NEXT GREAT
COPPER FRONTIER
Offers Upside to The Economics
of Our Copper Assets
• Substantial exploration potential remains
on both our Kamoa-Kakula joint venture &
90-100% owned Western Foreland ground
• Significant potential for mineralization
continuing from JV ground to Western
Foreland ground
• New discoveries made on 2,550-km2
Western Foreland ground
• Recent new discovery of Kamoa Pyrite
Siltstone (KPS) has delivered further ultra
high-grade results, and promises
continued future success
18PLATREEF: AMONG THE WORLD’S NEXT
GREAT PRECIOUS METALS MINES
SET TO BECOME ONE OF WORLD’S LARGEST PRIMARY PGM MINES
• Potential annual production of more than 600,000 oz. of palladium, platinum,
rhodium and gold; plus over 40 million lbs. of nickel and copper
• Studies underway on initial 0.7 Mtpa mine and transition of Shaft 1 to production
• Significant resource and exploration upside
• Project level financing including stream of up to $420 million being arranged(1)
LOW CASH COSTS
• Bottom of the global cash cost curve
• US$442 per ounce of palladium, platinum, rhodium and gold, net of by-products;
including sustaining capital
SUSTAINABLE ECONOMIC DRIVER FOR SOUTH AFRICA
• Leading producer of “green metals” critical for many clean technologies
• Mechanized, underground mining; dry-stack tailing decision to minimize project impact
• 26% held by B-BBEE Partners, including 20 local host communities with a total of
approx. 150,000 people, project employees and local entrepreneurs
Note: Please refer to the Offering Memorandum and the documents incorporated by reference therein. (1) $300 million non-binding term sheet from Orion Mine Finance; subject to completion of due diligence, structuring and 19
negotiation & execution of definitive documentation. Nedbank and Societe Generale have been appointed to arrange a senior project debt facility of up to $120 million.KEY HIGHLIGHTS: PEA (Phased
Shown on 100%-basis in US$ Feasibility Study
DECEMBER 2020 Development)
FS AND PEA Annual Throughput 4.4 Mt 0.7 Mt to 5.2 Mt
3PE+Au Produced(1) 508 kozpa 109 to 613 kozpa
Ni + Cu Produced(1) 35 Mlbpa 7 to 43 Mlbpa
Initial Capital $1.4 Bn $0.4 Bn
Expansion Capital NA $1.3 Bn
LONG- After-tax NPV8%(2) $1.8 Bn $1.6 Bn
TERM
PRICES IRR (Real %)(2) 20% 20%
SPOT After-tax NPV8%(3) $3.7 Bn $3.3 Bn
(1) Life-of-mine annual average.
PRICES
(2) Metal price assumptions used for the IDP20 economic
analysis: US$1,050/oz Pt, US$1,400/oz Pd, US$1,560/oz
(Nov 2020) IRR (Real %)(3) 28% 29%
Au, US$5,000/oz Rh, US$7.30/lb Ni, US$3.10/lb Cu. 16:1
ZAR to USD exchange rate.
(3)1.Spot
First ten year
metal average.
prices (November 27, 2020): US$968/oz
Pt,2.US$2,428/oz
Including smelter.
Pd, US$1,788/oz Au, US$16,100/oz Rh,
3. Consensus
US$7.36/lb long-termCu.
Ni, US$3.35/lb copper
16:1price
ZAR of
to$3.10/lb
USD and $200/t acid. Includes the
exchange
impactrate.
of the 2018 DRC Mining Code. 20PLATREEF : POTENTIAL TO BECOME AMONG THE
WORLD’S LARGEST PRIMARY PGM PRODUCERS
Platreef 2014
1,600 3PE+Au Production 2019 (Pd Eq. oz) 12 Mtpa PEA
Palladium Equivalent Production (koz)
3PE+Au Production
1,400
Ni+Cu Production 2019 (Pd Eq. oz)
Ni+Cu Production
1,200
1,000 Platreef 2020
4.4 Mtpa FS
800
600
400
200
-
Eastern Limb Northern Limb Great Dyke North America Western Limb
Source: Production estimates for projects other than Ivanhoe’s Platreef Project have been prepared by SFA (Oxford). Production data for the Platreef Project (platinum, palladium, rhodium, gold, nickel and copper) is based on
reported FS and PEA data and is not representative of SFA's view. All metals have been converted to palladium equivalent ounces using base case assumptions of US$1,050/oz platinum, US$1,400/oz palladium, US$1,560/oz 21
gold, US$5,000/oz rhodium, US$7.30/lb nickel and US$3.10/lb copper. Note: As the figures are palladium-equivalent ounces of production they will not be equal to 3PE+Au production.PLATREEF : INDUSTRY LEADING CASH COST
Global primary PGM producer net total cash cost + SIB capital (2019), US$/3PE+Au oz
Quartile 1 Quartile 2 Quartile 3 Quartile 4
1,800
1,600 Platreef cash cost:
US$442/oz 3PE+Au,
1,400
net of by-products
1,200
1,000
800
600
400
200
0
4E production
Western Limb Eastern Limb Northern Limb Great Dyke North America
Source: SFA (Oxford). Data for Platreef Project is based on the Platreef 2020 FS parameters and are not representative of SFA's view. Net total cash costs have been calculated using base case assumptions of 16:1 ZAR:USD, 22
US$1,050/oz platinum, US$1,400/oz palladium, US$1,560/oz gold, US$5,000/oz rhodium, US$7.30/lb nickel and US$3.10/lb copper.PLATREEF : EVOLUTION OF BASKET PRICE
Platreef Revenue Per Tonne of Probable Reserves (US$/t ore) Platreef basket price
$450 today is over
US$2,800/oz(1) 3PE+Au
$400
$350
$300
$250
$200
$150
Total Cash Cost (Mine Site + Realization)
$100
Mine Site Cash Cost
$50
--
Platinum Palladium Rhodium Gold Copper Nickel
Note: Based on Platreef Mineral Reserves with an effective date of November 30, 2020. Probable Mineral Reserve of 124.7 million tonnes at a grade of 1.95 grams per tonne (g/t) platinum, 2.01 g/t palladium, 0.30 g/t gold, 0.14 g/t rhodium,
0.34% nickel and 0.17% copper. A declining Net Smelter Return (NSR) cut-off of $155 per tonne (t) to $80/t was used for the Mineral Reserve estimates. The NSR cut-off is an elevated cut-off above the marginal economic cut-off. Metal
prices used in the Mineral Reserve estimate: US$1,600 per ounce (oz.) platinum, US$815/oz. palladium, US$1,300/oz. gold, US$1,500/oz. rhodium, US$8.90 per pound (lb) nickel and US$3.00/lb copper. Tonnage and grade estimates
include dilution and mining recovery allowances. Applies life-of-mine average recoveries of 87.4% for platinum, 86.9% for palladium, 78.6% for gold, 80.5% for rhodium, 87.9% for copper and 71.9% for nickel. Total cash cost includes mine 23
site costs, plus realization costs such as treatment and refining charges, royalties and transportation. (1) Platreef basket price is the weighted average price per ounce of PGM and gold reserves at spot prices (April 27, 2021) of US$1,231/oz
Pt, US$2,945/oz Pd, US$1,777/oz Au and US$28,600/oz Rh.KIPUSHI: THE WORLD’S HIGHEST-GRADE MAJOR ZINC PROJECT
Top 10 Zinc Projects by Contained Zinc
Contained zinc in
Measured &
Indicated resources Zinc grade (%)
Contained Zinc Zinc Grade (%)
(Mt)
16 40 TWO YEARS TO
14 35 PRODUCTION FROM
12 30 DEVELOPMENT DECISION
10 25 • Draft feasibility, development and
8 20 financing plan being reviewed
6 15 with partner, Gécamines
4 10
Plans anticipated to be
2 5 finalized by mid-2021
-- --
• Underground rehabilitation work
Citronen (Greenland)
Mehdiabad (Iran)
Shalkiya (Kazakhstan)
Kipushi (DRC)
Buenavista (Mexico)
Dugald River (Australia)
Selwyn (Canada)
Ozernoe (Russia)
Pitarrilla (Mexico)
Gamsberg (South Africa)
substantially complete
• Potential to become a large-
scale, low cost zinc producer
Source: Company filings, Wood Mackenzie 24
Note: All tonnes and zinc grades of the above-mentioned projects are based on public disclosure and have been compiled by Wood Mackenzie as of July 2018.EXPERIENCED BOARD AND MANAGEMENT TEAM
BOARD OF DIRECTORS EXECUTIVE MANAGEMENT TEAM
Mr. Robert Friedland, Founder and Executive Co-Chairman Mr. Yufeng “Miles” Sun, Non-Executive Co-Chairman Ms. Marna Cloete
• Recognized as an entrepreneurial explorer, technology • Chairman of CITIC Resources Holdings Limited, and President & Chief Financial Officer
innovator, and company builder President of CITIC Metal Group Limited • Joined Ivanhoe Mines in 2006, and in 2009, was promoted
• Led some of the world’s largest mineral discoveries including • More than 32 years working experience in metals and mining to Chief Financial Officer and to President in 2020
Voisey’s Bay, Fort Knox, Oyu Tolgoi and Kamoa-Kakula industry • 15 years of executive management experience after
commencing her career at PwC in the Metals and Mining
division. Also currently Chair of the Audit and Risk
Mr. Manfu Ma, Non-Independent Director Mr. Peter Meredith, Independent Director committee of Centamin plc.
• As CITIC Metal Group’s Vice President, played an important • Has served as a Director of the current Ivanhoe Mines and
Dr. Patricia Makhesha
role in CITIC Metal’s two strategic investments in Ivanhoe its corporate predecessors since 1998, while also serving as
Executive Vice President, Sustainability & Special Projects
Mines in 2018 and 2019 CFO of the original Ivanhoe Mines from 2004 to 2006
• More than 30 years’ experience in the mining industry • Previously spent 31 years with Deloitte LLP • Has served on the boards of GlaxoSmithKline, Rand Water
Board, Trans Caledon Tunnel Authority, Construction
Industry Development Board, South African Broadcasting
Corporation & Co-operative Bank Development Agency
Mr. Tadeu Carneiro, Lead Independent Director Mr. Kgalema Motlanthe, Independent Director
• CEO of Boston Electrometallurgical Corporation, and an • Previously President of South Africa for a period between
invited lecturer in the Department of Materials Science & 2008 and 2009, and subsequently served as the nation’s
Engineering at the Massachusetts Institute of Technology Deputy President from 2009 to 2014 Mr. Peter Zhou
• Currently Head of the Nelson Mandela Foundation Executive Vice President, China
• Joined Ivanhoe Mines after a career at BMO Capital
Markets, where Mr. Zhou participated and executed more
Mr. Chen Jinghe, Non-Independent Director Ms. Nunu Ntshingila, Independent Director than 10 Chinese cross-border M&A and financing projects,
• Founder and core leader of Zijin Mining • Currently Regional Director, Facebook Africa with a total transaction size of ~US$30 billion
• The key discoverer, researcher and development organizer • Previously spent almost 16 years with Ogilvy & Mather South
of the Zijinshan Gold and Copper Mine Africa in senior positions; becoming company Chair in 2012
Mr. Pierre Joubert
Executive Vice President, Technical Services
Mr. William Hayden, Independent Director Mr. Guy de Selliers, Non-Independent Director
• 37 years of experience building and managing mines in
Southern Africa; progressively senior responsibilities in the
• Served as first President of the corporate predecessor, • Currently President of HCF International Advisers, a London-
Anglo American Gold Division, Grinaker LTA Mining
African Minerals, from 1998 to 2001 – and as a Director from based, corporate finance advisory firm focused on the mining
Contracting (Part of Aveng), Anglo American Platinum
1998 to 2002. (African Minerals, now Ivanhoe Mines.) and metals industry, which he co-founded in 2003
(AAP) and African Rainbow Minerals (ARM)
Mr. Alex Pickard
Ms. Martie Janse van Rensburg, Independent Director Vice President, Corporate Development
• Over 25 years’ experience in executive roles & as a director • VP of Corporate Development since 2017
with various South African companies, with a focus on capital • Joined Ivanhoe Mines after a career at Morgan Stanley and
markets & infrastructure development BMO Capital Markets in London
2529
Cu
• Three long-life, world- • Robust, experienced • Committed support • Strong balance sheet • Near-term copper:
class mines with low management team with from key partners CITIC with cash & cash Kakula is on track to
costs, low capital a strong track record of and Zijin equivalents of approx. soon begin production;
intensity and low exploration & execution $263 million (at Dec 31, copper production to
environmental success • Strong in-country 2020) double to approx. 400kt
footprints support & in Q3 2022
• Poised to grow Ivanhoe relationships: DRC has • Additional $575 million
• Objective to become into the next world- 20% stake in Kamoa- raised in March 2021 • Exploration knowledge
best-in-class in ESG class mining company Kakula and B-BBEE through a convertible and massive land
Partners have 26% bond offering package for future
stake in Platreef copper discoveries in
DRC
26You can also read