E-mobility 2020 - materials selection for a more sustainable automotive future - Hydro Papers - Hydro.com
←
→
Page content transcription
If your browser does not render page correctly, please read the page content below

E-mobility 2020
– materials selection for a more
sustainable automotive future

   Hydro Papers

02

Introduction

We have turned the corner into a new transport paradigm.          The main driver of EV uptake is falling battery costs, support-
Driven by increasingly restrictive regulation to combat carbon    ed by the increasingly broad range of EV models on offer, the
emissions and improve air quality with emission-free driving,     fact that EV driving range is now sufficient for most end-user
the future over the next two decades looks to be going clearly    needs, as well as the growing number of charging options (at
in the direction of e-mobility.                                   home or at charging stations), increased charging speed, and
                                                                  various Government incen- tives. Possible alternatives such
The output of electric vehicles (EVs), both battery EVs (BEVs)    as hydrogen drive systems do not seem to be viable at this
and plugin hybrid EVs (PHEVs), is slated to rise exponentially.   stage.
Industry consultant DuckerFrontier estimates EV production
will grow by over 30% every year over the next five years1. By    The changing energy landscape particularly in Europe and
2025 OEMs in Europe will likely be producing around 3.3 mil-      the US as more renewables come online also favors EVs from
lion electric and hybrid cars, against approximately 600,000      a sustainable usage perspective. They are also becoming
today. Some two-thirds of that total will be BEVs, growing        increasingly competitive price-wise with internal combustion
42.6% annually to 2025, versus 21.4% for hybrids. Compact         engine vehicles (ICEVs) still on an unsubsidized basis. Price
(C-segment) cars are set to predominate in both categories.       parity with ICEVs in Europe will likely be reached much
Bank researchers at UBS predict that by 2025 around 25% of        sooner than expected as battery costs decrease and energy
new cars produced globally could be electrified2, of which at     density improves. Battery storage systems cost around $200
least 10% will be BEVs and the rest PHEVs and full hybrids.       per KWh a few years ago, but are forecast to decrease by half
The strong growth will be driven by China and Europe.             to $100 per KWh in 2025.
03
european electric vehicle production
BEVs are forecast to grow faster than PHEVs. C-segment will continue to be predominant. Smaller PHEVs will be introduced
(B-segment) and C-segment to gain shares.
10-year BEV Production 2016-2025 (EU 28) 10-year PHEV Production 2016-2025 (EU 28)
2,277,199
1,047,408
Compound Annual
Growth Rate: 42.6% Compound Annual
1,946,984
Growth Rate: 21.4%
928,742
11%
20%
810,106
1,596,934
747,806
12% 18%
679,646
21%
1,222,057
18%
594,553
12% 21%
27%
21%
19% 23% 28%
39%
848,594
13% 25%
25%
25%
37%
326,902
21% 24%
11% 36%
491,257
24%
201,437
175,724
20%
49%
39%
270,518
40%
109,310
46%
49%
182,490
11%
27%
50%
102,633
21% 42% 26% 51%
84,233
48% 29% 49%
27% 41%
17% 38%
20% 34%
37% 17% 36% 30%
55% 20% 39% 30%
59% 56% 29% 7% 6% 22% 4% 4% 40%
30% 10% 9% 7% 6% 28% 23% 4%
2016 2017 2018 2019 2020 2021 2022 2023 2024 2025 2016 2017 2018 2019 2020 2021 2022 2023 2024 2025
A - Basic
B - Sub-Compact
C - Compact
D - Midsize
E - Large
Source: LMCA Database Q1-2019 + DuckerFrontier estimates
04

The lightweighting trend

The automotive industry is continuously striving towards          train and car structure. A lightweight design leading to overall
lighter constructions. For ICEVs, this is driven by a combi-      weight saving will compensate for much of the difference in
nation of improving car performance and economic factors          the material production phase. Furthermore, taking the re-
such as fuel consumption and raw material consumption. In         duced fuel consumption in the use phase into consideration,
recent years, the lightweighting trend has accelerated due to     the lightweight design will often have a superior footprint in
increasingly tough measures to curb exhaust emissions (see        a life-cycle perspective. The case for low-carbon aluminium
pages 20-21), as well as the fact that cars have been getting     (see pages 10-13) is even more convincing as the sustainable
heavier overall on the back of increasing demand for larger       alternative par excellence, leading to footprint reduction both
models packed with extras. Lightweighting is also expected to     in the production and use phases.
be a major trend in the case of BEVs. Driving range on a single
charge is a core commercial challenge for OEMS in their
efforts to enhance BEV efficiency. BEVs are typically heavier
                                                                  life cycle assessment (lca) of vehicles
than their ICEV counterparts – up to 16% heavier in the
case of a Volkswagen E-Golf – and the aim is to look for new
weight-saving potentials to compensate for the weight of the
battery pack and needed strengthening of the main structure
in order to absorb increased dynamic and crash loads. All                                                     Raw materials
                                                                     End of life
this is putting renewed focus on body concepts and materials
selection, with the industry moving increasingly towards
multi-material design concepts.

Furthermore, in the face of increasing regulation and climate
concern, there is a trend to focus more on the CO2 footprint
of vehicles from a total life-cycle assessment (LCA) perspec-
tive. As emissions from the use phase are driven down, the
relative importance of the build phase naturally increases.
Hence it is expected that both Governments and OEMs will
start to focus on the CO2 footprint of the materials used, and
                                                                                                                       Production
that this will underpin the materials selection process. So,
moving from selecting materials based mainly on cost and
properties perspectives, in the future the assessment will be
based on cost, performance and the CO2 footprint of raw
                                                                                      Use phase
materials extraction and production. This effect is especially
prominent for EVs. In the case of electricity generated from
renewable sources, close to the entire footprint from an LCA
perspective comes from the production phase, and especially
raw materials. Lightweighting technologies must therefore be
evaluated from an LCA perspective to define the ecological
impact of each vehicle. This represents an enormous oppor-
tunity in materials innovation.

A kg of aluminium typically has a higher carbon impact in
the production phase versus a kg of steel, however taking
into account that aluminium is three times as light as steel,
comparing carbon footprint per kg is less relevant. Also, a
weight saving of a primary component offers the opportunity
to realize secondary weight savings in, for example, drive
05

Aluminium on the move

There has been continuous growth in the use of aluminium in              Currently, top-end brands are above the market average on
the automotive industry for almost 45 years, due to its specific         a per-unit basis while volume brands are below the average.
weight, alloy strength, corrosion resistance, and, last but not          Jaguar and Land Rover lead the field, with respective av-
least, its processing possibilities. Wheels acted as an early            erage aluminium content per vehicle of 532 kg and 479 kg,
driver of increased aluminium usage followed by the power-               respectively.
train, engines, structural parts, trim components, and body
sheets. Global demand for aluminium in the body-in-white                 By 2025 the average aluminium content of vehicles is forecast
has seen strong growth more recently. That is set to continue,           to rise around 20% to 198 kg across the entire market1, sup-
also driven by developments in new high-strength alloys,                 ported by the growth in EV production. In terms of material
tailored products and improved joining methods.                          choice, the major change heralded by electrification is that
                                                                         the aluminium used in engine, gearbox, and other powertrain
In Europe, the average aluminium content of all cars includ-             components in ICEVs, which account for 70 kg to 80 kg of
ing all types of powertrain is today around 179 kg1, primarily           the total aluminium content in a typical C-segment car, will
aluminium castings at 65%. Sheet products (19%), extrusions              be lost. However, around the same weight and more is added
(11%) and forged components (6%) make up the rest. Large                 by drive and control systems and battery tray, where so far
E-segment cars have the highest average aluminium content,               aluminium has mostly been the material of choice. The fact
at 442 kg, but the C-segment (152 kg average) takes the lion's           that EVs are generally heavier than comparable ICEVs will
share (36%) of the total due to overall higher volumes.                  further fuel aluminium usage.

Audi uses sustainable aluminum for the battery housing of the Audi e-tron (pictured). The material is processed and manufactured along the
entire process chain in an environmentally friendly manner and under socially acceptable working conditions. (Photo: AUDI AG)
06

     Further growth in demand
     for aluminium is expected
     as the shift to electrification
     gathers momentum.

The processing possibilities and excellent energy-absorption      last decades, requiring increased structural stability and
properties of aluminium are ideal for lightweighting, providing   energy-absorption possibilities, for which aluminium prod-
opportunities for innovative component designs and entire         ucts are the optimum choice.
modules for the vehicle body. The lightweighting potential
of each component necessitates a systems approach that            Today, engine and wheel components account for around
addresses the qualities of specific alloys, manufacturing,        45% of total aluminium content across the market, followed
and appropriate joining/finishing methods in each case.           by transmission, chassis and heat transfer components, body
Aluminium also offers the possibility to produce tailored         closures, body structure, crash management, steering, brakes,
products through castings, rolling-, extrusion-, and cold-        trim and interior components, and other small parts. Demand
forging processes, leading to raw material reduction and          for aluminium for use in wheels, chassis, engine/powertrain,
highly engineered lightweight automotive components.              internal fittings, and the body is continually increasing, with
                                                                  further growth expected as the shift to electrification gathers
Parallel to lightweighting, the safety requirements for driver    momentum.
and passengers have been continuously increased over the

     Aluminium wheels are popular
     because of superior design freedom
     and aesthetics compared to steel
     wheels, in addition to heat conduc-
     tivity and anti-corrosion properties.
     (Photo: Getty/iStock)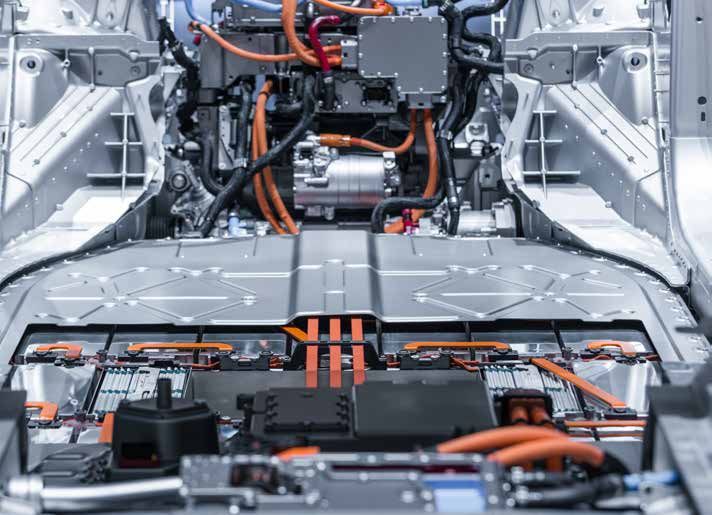
07

aluminium content by component group

Electrification components                  Average Aluminium Content Evolution 2016-2025 by Component Group (net weight in kg)
will be the main growth
area by 2025, together                                                     +19.6 kg
with Body Closures. Alone                         +28.7 kg                                          198.8
                                                                          179.2
Battery Boxes account for                                                  3.1%
                                                                                                     3.3%
                                                                                                     3.7%
nearly 2/3 of the Average                                                  3.6%
                                                                           4.4%
                                                                                                     4.5%

AL Content increase to                          150.5*                     14.1%
                                                                                                     15.0%

come.                                             4.3%
                                                  2.9%                     12.0%                     16.5%
                                                  3.8%
                                                  8.1%
                                                                           18.6%                     17.6%
                                                 10.4%
                                                                                                                             Other small parts
                                                 16.9%                     18.8%
                                                                                                     19.8%                   Trims & Interior
                                                                                                                             Brakes
                                                 15.6%
                                                                           19.4%
                                                                                                     18.8%
                                                                                                                             Steering
* 2016 numbers do not include                    17.8%                                                                       Crash Management
Electrification components (i.e.
Battery Boxes, Bettery Cooling                                                                                               Body Structure
                                                                           38.5%
and Electric Motor Housing),                     27.0%
                                                                                                     39.3%
                                                                                                                             Body Closures
and are based on a limited
sample of 60 vehicles that has                                                                                               Heat Transfers
been extrapolated to the whole                                                                                               Chassis
market. 2016 numbers do also
                                                                                                                             Transmission
not include the second set of                    41.6%                     42.1%                     39.7%
OEM wheels that is purchased                                                                                                 Wheels
at the same time as the vehicle.
                                                                                                                             Engine
                                                 2016                     2019                      2025
Source: 2019 DuckerFrontier.

aluminium content in cars (2019 and 2025 – net weight)

                                      2019                                                     2025
                                      Average AL Content per Vehicle currently                 Average AL Content per Vehicle is expected to
                                      amounts to nearly 179 kg and Total Aluminium             increase by approx. 20 kg to 198.8 kg by 2025,
                                      Content for the whole car market (including              bringing the Total AL Content in European cars
                                      electrical vehicles) is estimated at 2,989 KT            to 3,635 KT. AL casting is expected to remain
                                      – most of which being aluminium castings.                the predominant forming process.

                                      Average AL Content          Total AL Content             Average AL Content             Total AL Content
                                      Per Vehicle                                              Per Vehicle

                                            179.2 kg                     2,989 KT                    198.8 kg                         3,635 KT

                     Cast                   116.0 kg                      1,936 KT                     118.1 kg                       2,161 KT

                     Sheet                   34.0 kg                       567 KT                      43.2 kg                          789 KT

                     Extrusions *            19.0 kg                        317 KT                     26.7 kg                         489 KT

                     Forged                  10.2 kg                        169 KT                      10.7 kg                         196 KT

* Extrusions exclude forging stock.
Source: 2019 DuckerFrontier.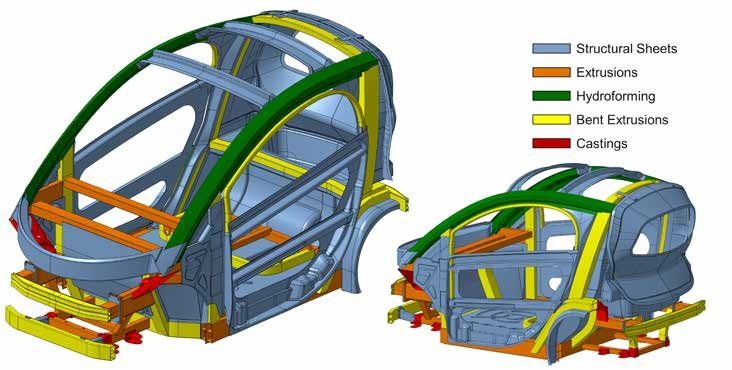
08

     Products involving aluminium-specific advantages
     such as light weight, heat conductivity, corrosion
     behavior, and processing method are considered
     to be the major contributors to aluminium use as
     EV production scales up.

aluminium automotive opportunities – using the bmw i3 as an illustration

                                                                                 Electric
                                                                                 motor casing

                                                                                           High-conductivity
                                                                                           cabling/buss bars

Crash alloys

High-
strength alloy

Cast aluminium
tower struts

                                                                      Extruded battery casing plus
Thermal battery management                                            battery casings with crash
                                                                      functionality (not pictured here)

Illustration: BMW AG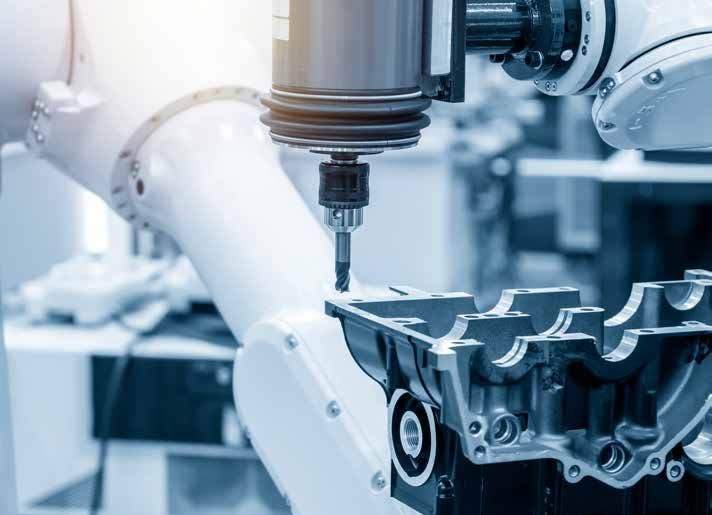
09

Electrification triggers big shift

Because of the battery tray with its thermal management            aluminium in evs compared to traditional cars
system and crash functionality, BEVs now stand out with
significantly higher aluminium content, as well as doubled         Comparison of ICEV vs BEV variant
powertrain components in the case of PHEVs. As examples,
                                                                   The comparison of the BEV variant of a vehicle program with its
the BEV variant of a sub-compact (B-segment) Peugeot 208           ICEV equivalent – diplayed here for BMW 3-series and Peugeout 208
has 126.2 kg of aluminium content, 36 kg more than its ICEV        – shows that the BEV variant has significantly higher AL content, pri-
variant on 90.2 kg. Going up the scale, the BEV model of a         marily due to the battery box. Overall, the higher the car segment, the
midsize (D-segment) BMW 3-series has 458.8 kg of alumini-          larger the difference in AL content between BEV and ICEV variants.
um content, 150.8 kg more than its ICEV counterpart, which
contains 308 kg of aluminium. This would indicate that the         Average AL Content (kg) per Vehicle (2019) for ICEV vs BEV variant
higher the car segment, the bigger the difference in aluminium
content between battery cars and their conventional variants.
                                                                             BMW 3-series                         Peugeout 208
It is also the case that aluminium content increases as the size              (D midsize)                        (B sub-compact)
of the BEV increases, with a big Tesla X containing 650 kg of
aluminium versus a C-segment Nissan Leaf on 170 kg.
                                                                          +150.8 kg
Potential other new key aluminium products for EVs are                                    458.8
battery cooling systems, high-conductivity cabling/buss
bars, sub-frames, multi-cavity side impact rails and crash-
management components made of high-strength alloys.
                                                                         308.0
Products involving aluminium-specific advantages such as
weight, heat conductivity, corrosion behavior, and process-
ing method are considered to be the major contributors to
aluminium use as EV production scales up.                                                                        +36.0 kg
                                                                                                                               126.2
                                                                                                                90.2
The marked demand for long-distance driving on a single
battery charge increases the relative importance of light-
weighting, and will further increase the use of lightweight
solutions.                                                               ICEV              BEV                 ICEV             BEV

                                                                   Source: DuckerFrontier 2019
10

  Greener aluminium is a winner

  Primary aluminium production is energy intensive. The                              However, Aluminium produced in Europe, with an average
  carbon footprint of aluminium depends therefore to a great                         GWP estimated at 6.7 kg CO2e/kg Al (Al European Average),
  extent on the energy sources used in the production process.                       makes sense for automotive use, but the best option to
  Aluminium Global Average is estimated to have a global                             achieve optimum life-cycle sustainability is using certified
  warming potential (GWP)3 of around 18 kg CO2e/kg. This has                         low-carbon or greener aluminium with a low GWP of 3-4 kg
  been mainly driven by the large expansion of Chinese alumin-                       CO2e/kg Al (see Note below). Its high sustainability score is
  ium production capacity, now representing well over 50% of                         achieved largely through the use of renewable energy during
  global output, which is to a large degree based on coal. Due to                    production, as well as a green sourcing strategy of other sup-
  this, Aluminium Global Average would appear in some cases                          plies needed for production, such as alumina and alloying ele-
  not to be the sustainable material of choice for automotive                        ments. Efforts are underway to reduce this to 2 kg CO2e/kg Al
  applications, as the benefits from the use phase would not                         by 2030 through further improvements along the value chain.
  be sufficient to counteract the CO2 footprint of raw material                      Furthermore, aluminium based on recycling post-consumer
  production versus possible alternatives.                                           scrap offers the opportunity to reach a level of 2 kg CO2e/kg
                                                                                     Al already today, without compromising alloy properties.

 aluminium c02e footprints by origins

                     100% post-       75% post-             Low-carbon              Primary                Primary               Primary               Primary
                      consumer        consumer               aluminium             produced              consumed                 Global                China
                                                                                   in Europe              in Europe              average
                                                                                    average                average

                20

                15
kg CO2e/kg Al

                10                                                                                                                                       20.0
                                                                                                                                  16.7

                 5
                                                                                                             8.6
                        0.5                                                           6.7
                                                                4.0
                                          2.3
                 0

  Source: IAI/EAA/Hydro/epd

  NOTE: Low-carbon aluminium is exemplified by Hydro's REDUXA® series, which is available in all grades and formats from Hydro's aluminium plants in Norway
  powered by hydroelectric energy. Recycled aluminium such as Hydro's CIRCAL® product has the lowest carbon footprint, with a GWP of just 2.3 kg CO2e/Kg Al.
  Containing 75% post-consumer aluminium, it is currently used primarily in the building industry. Recycled aluminium may increasingly be used in the automotive
  sector as part of the circular economy.
12 Comparative footprint analysis Major decarbonization potential Given the increasing focus on LCA, materials producer Hydro Using the greener aluminium in both ICEV and BEV variants teamed up with German automotive research institution fka caused an emissions reduction already in the production to examine what impact using Al European Average or low- phase for all variants. This reduction widened during the use carbon aluminium instead of steel would have on the total phase versus the steel-based reference vehicles due to the ecological footprint of vehicles. A methodical evaluation of impact of lightweighting. lightweighting was made using the fka vehicle assessment model as a baseline. Six generic vehicles were defined as the As the reduction in use-phase emissions by lightweighting reference variants – three C-segment cars and three SUVs puts the production phase in the spotlight, the project clearly comprising one ICEV and two BEVs in each category. For the showed that replacing steel with aluminium is very relevant smaller BEVs a range of 200 km and 400 km, respectively, from a sustainability perspective. It also highlights low- was used, while a respective range of 400 km and 600 km was carbon aluminium as a key enabler in strategies to reduce used for the two SUV BEVs. Lightweighting technologies were the environmental impact of cars from the first kilometer then applied in outer panels and body structure to define the onward, with fka research showing potential for emissions lightweight variants. Steel components in the body-in-white savings versus steel of 11.3% and 12.6% in CO2e over the were redesigned with aluminium, with consideration also lifetime of C-segment and SUV ICEVs, respectively. Based on given to secondary weight reduction such as downsizing the the German (or European average) grid mix, the respective chassis and engine, and scaling of the energy storage system. potential CO2e savings were 14.2% and 13.5% for C-segment Lightweighting reduced the total mass of vehicles by between BEVs, and 14.2% and 12.1% for SUV BEVs for the lower and 9.4% and 13.7%. LCAs were then performed on each vehi- higher ranges in each category. cle based on an average energy-consumption matrix and a use-phase mileage of 150,000 km. (This was later updated to It was also noted that the grid mix of specific regions can 200,000 km (see graphs, right), but with negligible change in significantly influence the total carbon footprint of a BEV, the resulting values). Different representative electricity grid with the highest overall environmental benefit from light- (fossil fuel/renewables) scenarios were used for the BEVs. weighting achievable in regions where fossil-fuel energy Finally, the reference and lightweight variants were compared sources predominate. to identify the LCA impact of two grades of aluminium, one variant based on Al European Average (6.7kg CO2e/kg Al) and the other a greener variant (4 kg CO2e/kg Al). The results showed that using Al European Average for light- weighting in ICEVs marginally increased emissions in the production phase, but this was sufficiently compensated for in “...replacing steel the use phase. Ecological break-even was reached at around 70,000 km mileage, with reduced emissions impact over the with aluminium is full life cycle. In BEVs, Al European Average slightly increased emissions in the production phase, but with a typical Euro- very relevant from pean grid mix was still beneficial from a full LCA perspective due to the reduced use-phase emissions. However, the eco- a sustainability logical break-even point shifted to higher mileages. In other words, in regions with electricity generated from a typical perspective.” European grid mix, the full LCA benefit of using aluminium versus steel was justified. This benefit will, however, decrease the higher the share of renewable energy in the grid.
13
impact of aluminium in a fossil-driven compact class car
Replacing aluminium with steel reduces total CO2 emissions during use phase,
while low-carbon aluminium can reduce the CO2 footprint straight from production.
45,000
44,728
42,791 41,751
40,968
40,000
38,846
37,023
35,000
Global Warming Potential (kg CO2e)
Steel Reference
Steel: 2.08 kg CO2e/kg
30,000 • Compact class segment
• Internal Combustion Engine
• Vehicle class specific material grades
25,000
Ecological
break-even
20,000 Full Aluminium Body in White (BiW)
Aluminium: 6.70 kg CO2e/kg
• 26% BiW weight reduction
15,000 • 14% BiW weight reduction
10,000 9,464
8,469 Low-carbon aluminium
7,641 Aluminium: 4.0 kg CO2e/kg
5,000 • -10% production phase footprint*
Production phase Use phase (200,000 km) End-of-life • -8% total footprint after use phase*
• -11.3% total footprint incl. recycling*
Life Cycle Analysis of a fossil-fuel driven car in compact class (e.g. Volswagen Golf) * versus steel
impact of aluminium in an electric-driven compact class car
Replacing aluminium with steel reduces total CO2 emissions during use phase,
while low-carbon aluminium can reduce the CO2 footprint straight from production.
28,000
European
25,917 average grid mix
26,000
25,562
24,000
23,713
Global Warming Potential (kg CO2e)
Ecological
22,266 Steel Reference
22,000 break-even
Steel: 2.08 kg CO2e/kg
20,958 • Compact class segment
20,000 • Battery Electric Vehicle, 200 km range
• Vehicle class specific material grades
19,109
18,000
Full Aluminium Body in White (BiW)
16,000 Aluminium: 6.70 kg CO2e/kg
• 26% BiW weight reduction
• 13% BiW weight reduction
14,000
12,633
12,000
11,860 Low-carbon aluminium
10,784 Aluminium: 4.0 kg CO2e/kg
10,000 • -9% production phase footprint*
Production phase Use phase (200,000 km) End-of-life • -9% total footprint after use phase*
• -13.5% total footprint incl. recycling*
Life Cycle Analysis of an electric-driven car in compact class (e.g. Volswagen Golf) * versus steelPhoto: Getty/iStock
16

Cost savings of lightweight design

A further study by Hydro and fka set out to model the cost       still found to be significant even in the reference scenarios,
savings that can be reached by lightweighting efforts in BEVs    coming in at around €4 per kg of mass reduction for a low-
relative to battery costs and energy-density improvements        range compact car with a battery system cost of 100 €/kWh,
in both C-segment and SUVs between 2018 and 2025. The            and around €8 per kg for a high-range SUV with a similar
cost savings are the result of the secondary weight reductions   battery cost.
and the downsizing of the battery and drive-train compo-
nents while maintaining range. Four reference vehicles were      More real-world and dynamic driving cycles would increase
defined for the simulations, two single-motor compact cars       these cost savings significantly, which serves to make light-
with respective ranges of 200 km and 400 km, and two             weighting even more important. These scenarios even
twin-motor SUVS of 400 km and 600 km in range. Two types         consider ideal recuperation of braking energy, whereas
of standardized drive cycle were considered. The main cost       realistically less energy is recuperated during actual driving.
parameters were powertrain costs (battery costs being the
most important factor) and representative electricity costs.     The primary weight reduction of a vehicle using aluminium
Annual mileage was calculated at 15,000 km, with a vehicle       can increase production costs of the vehicle structure, but
ownership period of five years and an interest rate of 1%.       because lighter cars lead to smaller battery packs for the same
                                                                 driving range, as well as lower energy costs for running the
The study showed that the cost-saving impact of the light-       vehicle, the adaptation of the whole drive train and secondary
weighting measures is and stays on a high level for BEVs. The    weight reductions cause primary weight-reduction costs to be
effect is even higher for heavier and longer-range cars. The     offset by the savings in components and operational costs. Of
cost benefit is expected to decrease in the future because of    course, the lightweighting effect can alternatively be realized
improved energy density and reduced battery cost. Never-         by gaining driving range.
theless, the estimated impact of lightweighting in 2025 was

Photo: Getty/iStock
17 Cast aluminium component in production. (photo: Getty/iStock) Battery tray in place in EV production line. (photo: Shutterstock)
18

Photo: Getty/iStock
19

Conclusion

Although new types of high-strength steels can be attractive                   In terms of components just about everything can in prin-
from a cost perspective, ultimately OEMs must add even                         ciple be made from aluminium beyond what is commonly
more weight savings to make the numbers work. Using                            used today, but cost is the issue. However, in the design of an
aluminium in BEVs is at first glance more expensive, but the                   aluminium part the specific properties and higher cost must
added cost will be offset by the weight reduction in tandem                    be considered in terms of the overall impact of aluminium
with reduced battery size and cost. The absolute reduced                       content on lightweighting value and sustainability.
mass of the vehicle means you need to put less materials into
it. Parts including body structures and closures (doors, hoods,                Comments one may hear such as that EVs are just as dirty as
bumpers, fenders, trunks, and gates) can easily be substituted                 conventional ICEVs in terms of the energy and materials that
with aluminium. The low-hanging fruits are bolt-on/hang-on                     go into them can today be proven not to be correct. As long as
parts that are easy to adapt and add on. New technologies                      the regional energy mix has a substantial renewables share,
are being developed that will further reduce the weight of                     EVs will contribute significantly to reducing the CO2 footprint
aluminium components and cost through production and                           of passenger cars compared to ICEVs. This is the situation
alloy innovations, while major advances have been made in                      in, for example, most of Europe due to the rapid growth of
joining technology. The cost of aluminium components will                      renewable energy sources. The use of aluminium in EV light-
also come down as supplier capacity and competition grows,                     weighting can help to improve sustainability even more.
including converting steel-based system suppliers to alumini-
um competence.

1. Aluminium Content in European Passenger Cars, DuckerFrontier, June 2019
2. Longer Term Investments – Smart Mobility, UBS Chief Investment Office GWB, March 2019
3. Source for GWP figures: International Aluminium Institute/European Aluminium/Hydro
Photo: Getty/iStock

Regulation set to impact production phase of cars
generally and stimulate EV uptake specifically

Ever stricter measures implemented by Governments                       OEMs to deliver full LCA analyses of all models to
to mitigate global warming are likely to shift the legisla-             demonstrate their environmental footprint. It is very
tive focus beyond exhaust emissions generated in the                    probable that a sustainability cap will be imposed on the
use phase of cars, as is the case today, to embrace                     total amount of carbon emitted per unit from cradle to
embedded emissions through a vehicle's entire life                      grave. An increasingly demanding public are also likely
cycle. In the EU, from 2021 average emissions of all                    to base their choices on greener life-cycle credentials.
new passenger cars will have to be below 95 g CO2/km,                   This will inevitably impact the choice of materials used
down from 130 g CO2/km today. This is driving efficiency                in manufacturing. OEMs will have different options as to
measures and lightweighting in conventional cars to                     how to address the issue, but sustainable sourcing for
reduce use-phase emissions, but at the same time will                   primary weight saving presents as the most economical
increase the absolute share of emissions generated in                   way forward versus costly redesigns.
the production and end-of-life phases. Europe will likely
lead the way, but others will follow as the push to curb                Meanwhile, in Europe, the steady reduction in average
life-cycle emissions gathers momentum, also for EVs                     new vehicle emissions has flattened out, and is even
where tailpipe emissions are not an issue. EU proposals                 seen to be creeping back up. Hence much greater
are expected to pass in the next five years requiring                   efforts will have to be made to reach the 2021 target.

1. Source for fact box figures: European Aluminium and European Union
21

  “…at least in Europe, regulation will continue to
  drive significant electrification in the next few years.”

Average emissions across the European OEM pool was           OEMs will naturally do all they can to avoiding paying
estimated at 121 g CO2/km in 2018¹, which is 26 g or         the hefty fines that will be incurred for not reaching the
21% off the 2021 target. If the average were to remain       2021 target. Some are choosing to multiply their BEV
the same past 2021, with an estimated violation fine of      output in order to improve their fleet-wide emissions
€95 per g, the potential price increase per car would        footprint, and to compensate for the prevailing consum-
be €2,470. A smaller OEM producing, for example, two         er hunger for larger, heavier ICEVs. Volkswagen Group,
million cars per year would be looking at annual sanc-       for example, is planning over 30 new vehicles based on
tion of €5 billion – representing a very serious threat to   its MEB e-platform, while FCA is reportedly paying huge
its bottom line.                                             sums to Tesla to include Tesla vehicles in its fleet to limit
                                                             its exposure. Another tool that is available for OEMs
Even more alarming for OEMs are the CO2 reduction            is to reduce their profits on EV sales, in other words
targets for 2025 and 2030 finalized by the EU last           subsidizing EV uptake.
year. These are -15% and -37.5%, respectively, on the
2021 figure. However, the regulation does includes an        So it can safely be said that regulation, at least in
incentive mechanism for OEMs to produce zero and             Europe, is driving the huge proliferation of EVs today
low emission vehicles (ZLEVs), involving a relaxation in     and will continue to drive significant electrification in the
the specific CO2 emissions of an OEM provided that its       next few years. Lightweighting is also likely to remain a
share of ZLEVs exceeds 15% of total sales by 2025 and        key priority.
35% of sales by 2030.

                                                                                                 One of the transformative
                                                                                                 climate policies planned for
                                                                                                 in the European Green Deal
                                                                                                 launched by the Commission
                                                                                                 in December last year is
                                                                                                 'Accelerating the shift to sus-
                                                                                                 tainable and smart mobility'.
                                                                                                 The Commission urges all
                                                                                                 states to ramp up production
                                                                                                 and deployment of sustainable
                                                                                                 alternative transport fuels,
                                                                                                 and says it will issue a new
                                                                                                 funding call focusing on the
                                                                                                 deployment of public recharg-
                                                                                                 ing and refuelling points where
                                                                                                 persistent gaps exist, notably
                                                                                                 for long-distance travel and in
                                                                                                 less densely populated areas.
                                                                                                 (Photo: Shutterstock)
22
Aluminium pushes
safety performance in
urban vehicle concept
With 75% of Europeans now living in urbanized areas, Short deformation zones and weight limit were the main
lightweight electric micro cars of the L7e-class could be a challenge, requiring an optimized structural design that was
great space-friendly solution for getting us from A to B in subjected to rigorous crash test modeling. Structural integrity
future. Current legal safety requirements for such vehicles of the battery system was a key focus, but even more import-
are quite low, but OEMs and consumers are likely to want ant was passenger safety. As large loads are primarily carried
safety standards on a par with larger vehicles where stricter into the floor structure in the case of frontal and rear impact,
rules apply. Hydro teamed up with research institution fka multi-chamber extrusion profiles are integrated in the battery
and the School of Design Pforzheim to develop a concept housing. The side door forms the outer energy-absorbing
to address that demand. structure in a side impact, using a sheet-metal shell construc-
tion supported by extrusion and bended profiles. Despite the
L7e cars have a weight limit of 450 kg (excluding the battery). small deformation zones, the concept's optimal load distribu-
Using aluminium for the entire body combines low material tion keeps acceleration levels low.
weight with excellent structural properties and high energy
absorption. The one-box-design enables optimal use of space, The project proved that through the clever use of aluminium
with intensive use of closed section profiles to minimize it is indeed possible to greatly increase the passive safety of
production costs. The chassis features a McPherson front lightweight quadri-mobile vehicles to C-segment standards
axle with a mirrored front axle variant at the rear. The drive – which will likely be the norm for this type of sustainable
train comprises a three-phase asynchronous motor delivering personal mobility solution in future.
13 kW.
For a concept driving range of 150 km, battery capacity was
calculated at 15.2 kWh delivered by 26 cell modules. Package
components are largely existing serial solutions.
“Structural integrity of the battery system was a key focus,
but even more important was passenger safety.”23
part overview body in white
Structural Sheets
Extrusions
Hydroforming
Bent Extrusions
Castings
Final design draft and technical implementation in CAD. Illustrations: fkaNorsk Hydro ASA
NO-0240 Oslo
Norway
T +47 22 53 81 00
www.hydro.com
Hydro is a fully integrated aluminium company with 35,000 employees in 40
countries. Rooted in more than a century of experience in renewable energy,
technology and innovation, Hydro is engaged in the entire aluminium value
chain, from bauxite, alumina and energy to primary aluminium, rolled and
Hydro 04.2020 extruded products and recycling.You can also read