From Net Zero ambition to Total strategy - September 2020 - Total.com
←
→
Page content transcription
If your browser does not render page correctly, please read the page content below
From Net Zero ambition to Total strategy
September 2020
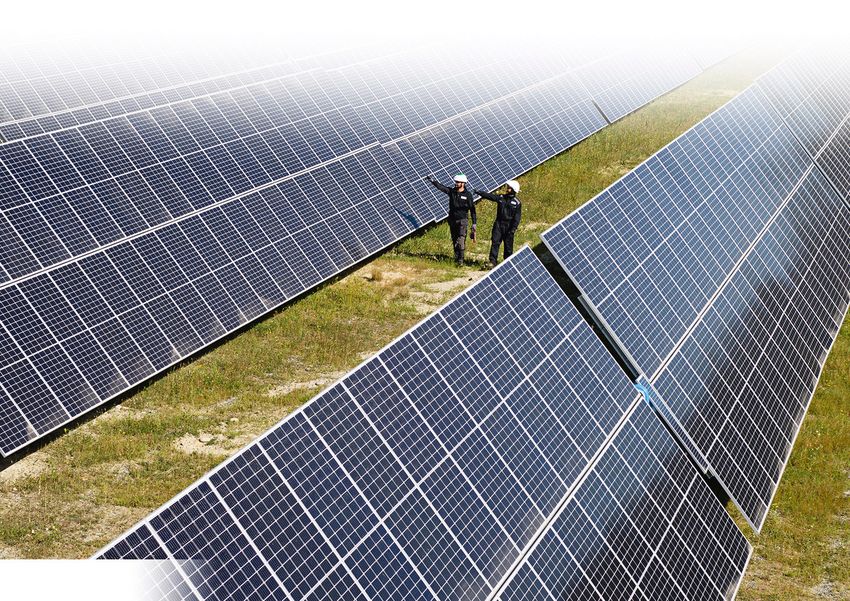
Safety, Total’s core value
Cornerstone of operational efficiency & sustainability                                  Coping with the Covid-19
                                                                                              health crisis
Total Recordable Injury Rate for Total and peers*
Per million man-hours

1.5

                                                                                            Our employees

                                                                                   1.
1.0                                                                                05       Our customers
                                                               Contractors

                                                                             0.8

                                                                                            Our operations
                                                               Group Staff         0.
0.5                                                                                73
   2015              2016             2017     2018     2019         1H20

                                                                                           Our communities
                                     One fatality in 2020

* Peers: BP, Chevron, ExxonMobil, Shell

                                                                                                2020 Strategy and Outlook   |   2
Increasing energy while decreasing carbon
Global trends underpinning evolution of energy markets
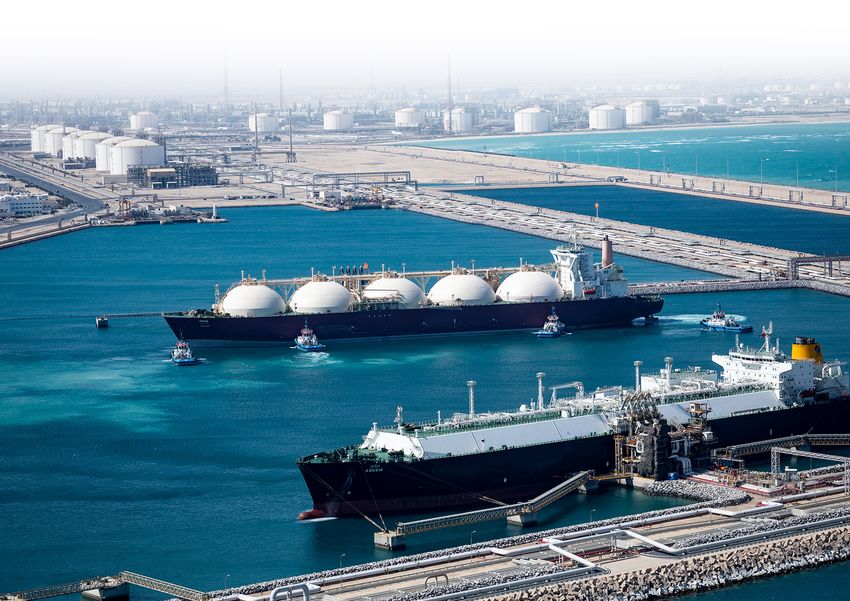
Natural Gas
• Key in energy transition, available,
affordable and complement to renewables
• LNG driving growth
• Will get greener with biogas and H2
Growing population in emerging countries
aiming at higher living standards Electricity
leading to growing energy demand
• Growing demand further increased by
despite energy efficiency gains Net Zero policies
• Renewables will decarbonize power
generation
Oil
Objective of Climate neutrality
• Acceleration of innovation to substitute
for the planet oil use
• Oil demand plateau 2030+ then decline
with impact on long-term prices
Carbon Sinks
• Required to achieve Net Zero
2020 Strategy and Outlook | 5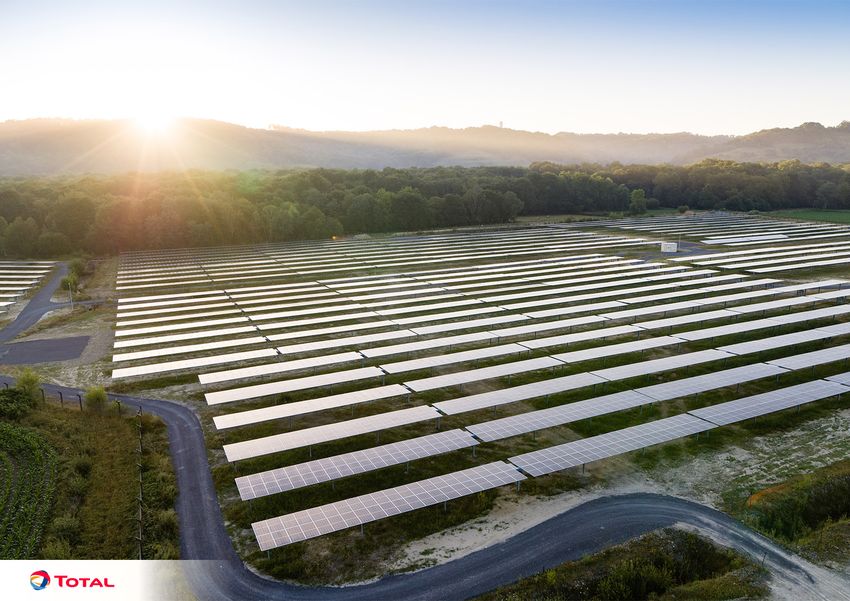
Our Ambition : Getting to Net Zero

 Total shares the ambition to get to Net Zero by 2050
     together with society for its global business
                   (Scope 1+2+3)

3 major steps to get Total to Net Zero

         Net Zero on Operations by 2050 or sooner
   1
         (Scope 1+2)

   2     Net Zero in Europe by 2050 or sooner
         (Scope 1+2+3)

          60% or more Net Carbon Intensity reduction
   3
          by 2050 (Scope 1+2+3)

                                                        2020 Strategy and Outlook   |   4
Transforming Total into a broad energy company

           Natural Gas
           • Grow LNG (#2 player) and develop biogas / clean H2
           • Promote natural gas for power and mobility

           Electricity
           • Accelerate investments in low carbon electricity primarily from renewables
           • Integrate along the electricity value chain (production, storage, trading, supply)

           Oil
           • Focus investments on low cost oil and biofuels
           • Adapt refining capacity and sales to demand in Europe

           Carbon Sinks
           • Invest in carbon sinks (NBS and CCUS)

                    Total becoming Total EnergieS
              creating long-term value for shareholders
                                                                              2020 Strategy and Outlook   |   6
Growing energy production

          Mboe/d                                                     PJ/d

            4
                                                              ~120
                                                 Electrons    TWh
                                                     Biogas           20

            3

                                                      Gas

            2
                                                                      10
                                                    Biofuel

            1
                                                       Oil

                   2019                                       2030

                LNG and Electricity driving Profitable Growth

                                                                           2020 Strategy and Outlook   |   7
Reducing emissions
New Commitments on Scope 3 emissions of our customers, in absolute value

Scope 3 emissions*
MtCO2e

                              400

                                        Emerging
                                         world

                                                               Europe
                              200                               -30%

                                        Europe

                                         2015                                       2030

                            Europe: -30% by 2030 on the way to Net Zero by 2050

                                                 Worldwide : 2030 lower than 2015
* From energy products used by our customers

                                                                                           2020 Strategy and Outlook   |   8
Growing sales while adapting to demand

Energy sold to our customers
PJ/y

             12,000                                              % in sales

                                                Electrons            15%
                                                Biogas, H2
                      5%

                                                                     50%
                  40%                           Natural Gas

                                                Biofuels

                  55%
                                                                     35%
                                                Oil products

                           2019          2030

                                                    2020 Strategy and Outlook   |   9
Aligning investments to become a broad energy company

Capital investments
%

                                                                Oil & Gas

                                                                LNG
                                                                Bio-businesses

                                                                Renewables & Electricity

                                  2015-20   2021-25   2026-30

Renewables & Electricity (B$/y)    1.5       >2        >3
% of Group Capex                   10%      > 15%     > 20%

                                                                             2020 Strategy and Outlook   |   10
Increasing cash flow with double digit profitability
CFFO*
B$
40
20
Oil & Gas
LNG
Renewables & Electricity
2H19-1H20 2025 2025
Brent ($/b) 51 50** 60**
ROE > 10% at 50 $/b by 2025
* From businesses
** Same refining margin vs. 2H19-1H20
2020 Strategy and Outlook | 11Competitive advantages to become a broad energy company
Building on legacy expertise to grow in Renewables and Electricity
Customer proximity
Global reach / global brand
Trading expertise in
oil, gas and electricity
Integration Gas to Power
Offshore expertise
Project management
Worldwide footprint
Oil & Gas cash flow
2020 Strategy and Outlook | 12One Tech: integrating all technical expertise to support transformation
Concentrating all Bringing expertise to
Group’s technical support new energy
expertise growth
One Tech
In place by Fostering innovation
Summer 2021 and cross fertilization
> 3,300 Engineers
in a central organization
2020 Strategy and Outlook | 13Increasing energy in gases, electrons and liquids
Gases
Resilient LNG demand growth

Medium-term LNG supply & demand
Mt/y

                                                                            Strong +10%/y 2015-19 growth
                                                                            supported by coal-to-gas switch

    500
                                Demand growth
                                                       Sanction delayed     +7% growth in 1H20 vs. 1H19
                                  +5 to 7%/y                                despite Covid-19
                                                       To be sanctioned

                                                       Under construction   Project sanction delays due to
                                                                            crisis will tighten supply…

                                                                            … benefiting Total’s projects
                                                       Existing supply
                                                                            already sanctioned, with
    300                                                                     start-ups by 2025
             2019        2020                   2025

Source: IHS, Total analysis

                                                                                        2020 Strategy and Outlook   |   16
Prominent position across the integrated LNG value chain
LNG global portfolio
Yamal LNG
50 Mt/y
Snøhvit LNG Arctic LNG 2* LNG sales
by 2025
Rotterdam
Cove Point LNG
Skikda
ECA LNG Arzew ELNG
Cameron LNG + T4 Sohar LNG
Freeport LNG Sabine Pass LNG Qatargas Qalhat LNG & Oman LNG
Adnoc LNG Oman
Yemen LNG
Nigeria LNG Singapore
+ T7*
Angola LNG Papua LNG
Equity production Mozambique LNG* Ichthys LNG
Long-term supply
Long-term sales
Gladstone LNG >10 Mt/y
Regasification terminals LNG production
in operation or planned growth
Bunkering hub
2025 vs. 2020
* In construction
Subject to FID
Trading and Regasification and Development
Equity production
shipping supply of gas of new markets
Size and integration key to capture value
2020 Strategy and Outlook | 17Flagship LNG projects fueling 2025 growth
< 3.5 $/Mbtu cost delivered to Asia
Russia - Arctic LNG2 Nigeria LNG Train 7 Mozambique LNG
Total 21.6%* - First LNG end-2023 Total 15% - First LNG 2023 Total 26.5% - First LNG 2024
Leveraging Yamal LNG success Low cost expansion World-class gas resource
Low upstream costs, > 7 Bboe(100%) Large, low cost gas resources Giant high-quality upstream
resources, > 60 Tcf 100%
19.8 Mt/y LNG plant Leveraging Nigeria LNG to add 12.9 Mt/y capacity
7.6 Mt/y to existing 22 Mt/y
30% lower cost vs. Yamal LNG due Leveraging scale to lower costs
to efficient GBS** design and Capex ~700 $/t LNG plant < 850 $/t
synergies with Yamal LNG
38% progress*** despite Covid-19 EPC contracts awarded in May 20 Project financing in place
TANZANIA Golfinho / Atum
Offshore Area 1
~650 M$/y ~150 M$/y ~1 B$/y
~700 M$/y Prosperidade
CFFO# CFFO# CFFO#
CFFO Palma
at 50 $/b at 50 $/b At
at 60
50 $/b
$/b
2025+ 2025+ 2025+
2025+ Orca
Mozambique
LNG
MOZAMBIQUE Tubarão
* Direct + Indirect
** Gravity-based structure Mocímboa
** End August 2020 da Praia Tubarão Tigre
# CFFO project view in Group share
2020 Strategy and Outlook | 18A rich portfolio to feed low cost LNG growth post-2025
LNG production
Mt/y
Russia giant Mozambique giant
Arctic resources Area 1 resources
40
20
US brownfield trains
Papua LNG
(Cameron, ECA)
2020 2025 2030
Large resource base providing options to deliver production growth by 2030
2020 Strategy and Outlook | 19Growing integrated LNG positions
2nd largest worldwide player
LNG sales Supply by source
Mt/y %
100%
Supply from
~x2 3rd party
Spot
60
50%
Supply from
equity JVs
30
Equity JV sales
to 3rd party
2020 2025 2030 2020 2025
Creating value from scale and arbitrage
2020 Strategy and Outlook | 20Europe: developing a customer portfolio to pull LNG value chain
2025 Customers
CCGT
(~5 GW)
~2 Mt consumed
Midstream Supply
Regasification capacities LNG Portfolio
11 Mt/y out of 20 Mt/y 11 Mt/y out of 45 Mt/y
Marketing
(4 M gas customers)
~9 Mt sold
2020 Strategy and Outlook | 21Integrated LNG delivering cash flow growth
Creating value from scale and arbitrage
CFFO
B$
60 $/b
4 50 $/b
40 $/b
2
2019 2025
Brent ($/b) 64 50
NBP ($/Mbtu) 4.9 5
JKM ($/Mbtu) 5.5 5.5
2020 Strategy and Outlook | 22Relentlessly reducing methane emissions
< 0.1%
Intensity* of
Upstream methane emissions operated Gas
Mt CO2e assets
-45%
2
2010 2015 2019 2025
Near Zero emissions
* Volume CH 4 / volume of net gas export
2020 Strategy and Outlook | 23Green Gas: decarbonizing natural gas with Biogas and H2
Biomethane Clean hydrogen
Production
TWh/y
6
4
2
Blending natural gas with clean H2 for CCGT
Producing clean H2 for industries and processes
2025 2030 Supplying clean H2 for buses, trains, private
fleets… trucks in the future
Supplying > 10% of our CCGTs in Europe by 2030 La Mède biorefinery green H2 project showcase
2020 Strategy and Outlook | 24Electrons
Low carbon electricity: growing and integrating along the chain
2025 Production
CCGT
~5 GW*
Trading
~20 TWh net
Supply & Aggregation
2025 Customers
Marketing
9 M customers
~80 TWh
Renewables
Storage 35 GW*
~30 TWh net
Grid balancing
* Gross capacity
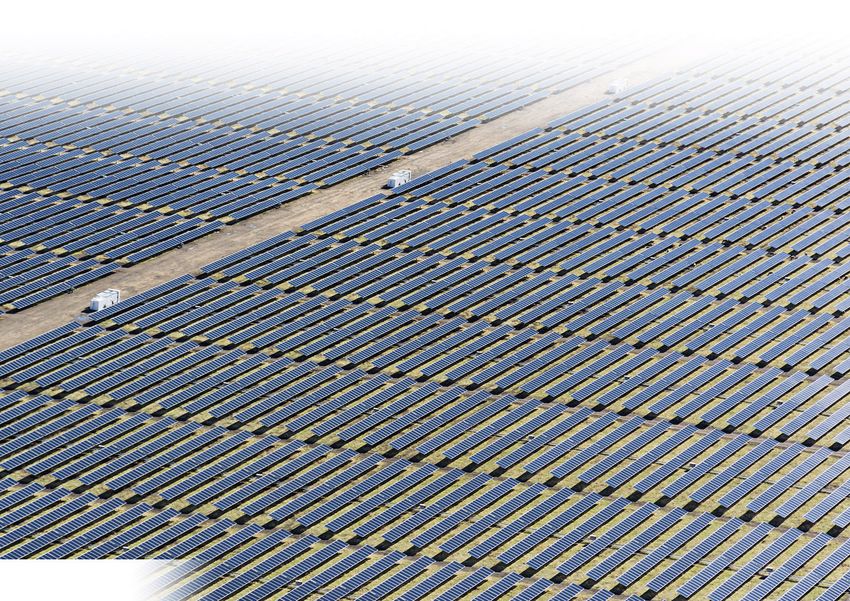
2020 Strategy and Outlook | 26Renewables: strengthening the Group business model
and adding long-term value
Predictable cash flow Capital light model
with long term upside
> 10%
ü Guaranteed PPA, CfD
1 Development
ü Corporate PPA 5-6%
opportunities 2
Leverage
(70/30)
ü Upsides
• Tail value beyond PPA 3
Farm Down
(~50%)
• Green H2 production
• Aggregation & Trading
4 O&M, Integration
ü Balancing Group cash flow
risk profile Typical
project IRR
TOTAL
Equity IRR
2020 Strategy and Outlook | 27 31Building on 2020 dynamic to raise the bar
+10 GW in 2020 with equity return > 10%
Gross renewable capacity
GW
35 GW
40
30
Spain Yet to find
20 France Wind
Solar
10
Qatar
Seagreen In development
India
In construction
In operation* Already in 2025
portfolio
Capturing profitable opportunities with low entry cost
* As of July 2020
2020 Strategy and Outlook | 28Growing low carbon electricity production
Electricity net production
TWh/y kboe/d
120 500
50 TWh
60 250
2020 2025 2030
Gas fired power plants Renewables
Building a world leader in renewables:
35 GW* in 2025, +10 GW/y beyond 2025
* Gross capacity
2020 Strategy and Outlook | 29Global footprint for building a unique renewables portfolio
Europe
15,000 MW Middle East
US 2,000 MW
3,000 MW China
3,000 MW
Rest of Asia
2,000 MW
Africa India
1,000 MW 6,000 MW
South America
3,000 MW
Presence by 2025 New regions rebalancing Group geopolitical profile
2020 Strategy and Outlook | 30Pioneer in floating offshore wind technology
Up to 1,500 MW Up to 400 MW > 2,000 MW
UK UK South Korea
Seagreen Erebus Bada
One of the largest UK First floating offshore Scaling up in
offshore wind projects wind floating offshore wind
51% Total / 49% SSE 80% stake 50% Total/50% Macquarie
3.7 B$ project Semi-sub technology
~70% gearing Lease secured Collecting wind data
70% covered by PPA Target FID 2024 (100 MW) Target FID 2023 (500 MW)
Building on E&P expertise and supply chain
Develop floating offshore wind efficient technologies (TLP*, semi-sub, keel…)
Market benefiting from strong policy support
* Tension Leg Platform
2020 Strategy and Outlook |
| 31Visibility on Renewables & Power value creation
Production NOI
TWh net 50 TWh B$ 1 B$
11 TWh 0.2 B$
2019 2020 2021 2022 2023 2024 2025 2019 2020 2021 2022 2023 2024 2025
CFFO Capital employed
B$ B$
> 1.5 B$ 15 B$
6 B$
0.1 B$
2019 2020 2021 2022 2023 2024 2025
2019 2020 2021 2022 2023 2024 2025
2020 Strategy and Outlook |
| 32Liquids: value over volume
Oil markets: low investments to trigger price rebound

Upstream investments*
B$/y
                                                                                 Underinvestment
                                  ~ 700
                                                                                 Fewer FID in 2020
                                                    ~ 400
                                                                    ~ 300      4-5%/y decline rate
                                                                            Uncertain shale oil dynamic
                                   2014           2017-19           2020

Annual capacity of sanctioned projects**
Mb/d                                                                             Reduced supply

                                            1.9

                                                            0.25              Supportive for oil price
                                                                              medium-term rebound
                                          2017-19           2020
                                                            (YTD)

Sources: WoodMackenzie
** O&G, including shale, excluding exploration
** Oil fields > 50 Mb, excluding shale

                                                                                     2020 Strategy and Outlook   |   34
Integrating along the oil value chain
Mb/d
2 Biofuels
1
2019 2025 2030
Liquid production Refining capacity Oil product sales
Adapt refining capacity and sales to demand in Europe
Growing biofuels
2020 Strategy and Outlook | 35Constantly highgrading portfolio to increase resilience
30% Upstream portfolio change over 2015-20
Group cash breakeven* Upstream production costs**
120 > 100 $/b
10
90
5 $/boe
60
5
30 < 25 $/b
2014 2016 2018 2020-25 2014 2016 2018 2020-25
Capex efficiency and resilient Downstream Permanent focus on cost
* Pre-dividend organic ** ASC 932
2020 Strategy and Outlook | 36Middle East and North Africa low cost oil
underpinning Group resilience at 40 $/b
#1 IOC
oil producer
in MENA**
> 650 < 3.5 ~10%
kboe/d $/boe 2020 ROACE
production* 2020+ Opex at 35 $/b
in 2020
Libya
Iraq Qatar
Waha, 16.3%
Halfaya, 22.5% Al-Shaheen, 30%, op.
El Sharara 12-15% ~40% of Group oil resources
World-class low cost assets
Low sensitivity to oil prices
UAE
Algeria
ADNOC onshore, 10%
Sonatrach Partnership
ADNOC offshore:
El Merk/Ourhoud/Hassi Berkine 12.25%
20% Umm Shaïf/Nasr, 5% Lower Zakum
* ~75% oil ** Middle East and North Africa
2020 Strategy and Outlook | 37Building material position in low cost Brazil pre-salt deep offshore
~1.5 B$ >150 ~4.5
CFFO kboe/d $/boe ~1 Bboe pre-salt resources
in 2025 production Opex ASC932
at 50 $/b in 2025 2021+
Developing giant low-breakeven
Rio de Janeiro
São Paulo
Mero and Iara fields
BRAZIL C-M-541, 30%* Op.
Mero, 20%
Lapa, first IOC operator in pre-salt
Iara, 22.5%
Lapa, 35%, op.
High profile exploration portfolio
• C-M-541 block, 2 wells planned
Entered biofuel growing market
through Marketing & Services
Producing Under development Pre-FID Exploration opportunities
* Subject to closing of ongoing 10% farm-out
2020 Strategy and Outlook | 38Exploration focusing on low development cost
Budget capped at 1 B$/y
WoodMac
most
admired
High Impact and low cost explorer* Nearby facilities
Suriname – Block 58 Central North Sea – Nearby Exploration
Canje
10
0m
Glengorm
Culzean
N OR
Orinduik Maka Central
UK
WAY
Elgin-
Sapakara West
10
GUYANA Kwaskwasi Franklin
0m
Keskesi
Kanuku B58
Isabella
New discoveries New discoveries
Upcoming drillings Producing fields
Exploration blocks Operated blocks
0 40Km 0 25Km
Other discoveries SURINAM Non-Operated blocks
3 major discoveries in 2020 2019-20 discoveries > 400 Mboe
Positive dynamic in Exploration contributing to future growth
* Total : Most-admired Explorer according to WoodMackenzie 2020 Survey
2020 Strategy and Outlook | 39Large portfolio of profitable low cost oil projects
Countercycle 2020 FIDs
Mero 3 – Brazil
Total 20% - First oil 2024
> 15% ~16 $/boe •
•
Production 150 kb/d (100%)
Giant reserves
IRR at 50 $/b avg. technical
Ekofisk cost* • Technical costs 20% IRR at 50 $/b
• Carbon intensity 23 kgCO2/boe
Dunga Ph. 3
Anchor Al Shaheen 2
Lake Albert Project – Uganda
Ballymore Total 56.6%, Op. – First oil 2024
North Platte Ikike
A6
Preowei
• Production 230 kb/d (100%)
Suriname Tilenga & Kingfisher
Owowo • Large reserves > 1 Bboe
• Technical costs < 20 $/b
Block 20/21
Mero 2 • 15% IRR at 50 $/b
Mero 3 • Carbon intensity 23 kgCO2/boe
Mero 4
Iara 3
2019 Lapa 3 Angola short cycle tie-backs
2020
Total ~30% - Relaunching drilling
2021+ (FEED, under study)
• Production 150 kb/d (100%)
Ensuring consistency for Capex allocation • Flexible Capex, quick pay-out
with Total Climate ambition • > 20% IRR at 50 $/b
* ASC 932 • Carbon intensity < 15 kgCO2/boe
2020 Strategy and Outlook | 40Net zero by 2050 or sooner
across Total’s worldwide operations
Scope 1 & 2 emissions from operated oil and gas facilities All sites mobilized
Mt/y – CO2e
on carbon footprint reduction
50 46
41.5
< 40
40 Acquisitions Developing strong internal
& start-ups
from 2015
low-carbon culture
25
All levers activated:
efficiency, operating philosophy,
process optimization or upgrade
0 0
2015 2019 2025 > 500 emission reduction initiatives
Carbon sinks bottom-up across all sites
(NBS, CCS)
-25 -25
2015 2019 2050
or sooner
Objective: 5 to 10 Mt/y sink capacity by 2030
2020 Strategy and Outlook | 41Becoming a leader in renewable diesel
Capturing synergies with existing assets
Renewable diesel production
Mt/y
Converting Developing on
Co-processing
existing assets existing platforms
5.0
La Mède: 500 kt/y 300 kt/y in Europe, Evaluating 500 kt/y
starting-up over project on Daesan
Zero oil platform, 2022-24 integrated platform
400 kt/y bio-refinery in South Korea
in Grandpuits, Evaluating project
start-up 2024 in Port Arthur refinery
in US 2.5
600-750 $/t Capex ~500 $/t Capex ~750 $/t Capex
Low Capex vs. greenfield development (> 1,000 $/t) 2020 2025 2030
Designing assets to allow feedstock flexibility
CFFO 2019-20 : 350 $/t
2020 Strategy and Outlook | 42Decreasing Scope 3 emissions of our customers by adapting energy sales to market evolution
Actively shaping demand
Adapting to customers, shifting sales to gas and electricity

                 • Promote renewables and
                   gases
    Power
                 • Develop storage solutions
  generation
                 • No more fuel oil sold to
                   power generation from 2025

                 •   EVs
                 •   CNG, LNG, biogas and H2
    Mobility
                 •   Biofuels
                 •   SAF for the future

                 • Promote natural gas use for
                   domestic boilers (vs. heating
    Heating        oil) and steam production
                   (vs. heavy fuel)
                 • Foster energy efficiency

                                                               2020 Strategy and Outlook   |   44
Growing biofuels in our sales mix
Biofuel sales
kboe/d
300 ü Largest biofuel retailer in
Rest of
Europe
the world
ü Actively promoting E85 in
France
150
Europe
ü Expanding biofuels retail in
Brazil
2019 2025 2030
Biofuels representing 10 to 15% of fuel sales by 2030
2020 Strategy and Outlook | 45Gases for mobility
LNG bunker fuel Natural Gas Hydrogen
for marine transportation for road transportation for road transportation
Building global supply chain for > 500 NGV stations in the US1 26 hydrogen stations in Germany
LNG bunker fuel Expanding NGV. By 2025: (> 25% of the H2 MOBILITY
Long-term chartering of network in 2020)
• 450 NGV stations in Europe
2 LNG-propelled VLCCs with ≥ 50% biomethane Private hydrogen refueling
Supply agreements with leading stations for bus fleets in Benelux
• > 600 NGV stations in Asia and France
shipping companies (India, Pakistan)
Targeting > 10% market share Developing H2 truck-stations
Targeting 1 Mt/y sales by 2025 in Europe by 2025
1 Through Group’s participation in Clean Energy
2020 Strategy and Outlook | 46Developing top tier positions in Electric mobility value chain
Committing over 1 B$ in the next 10 years
Investing in battery manufacturing Positioning on EV charging segments
2020 JV with PSA in Europe 15,000 operated charging points end-2019
• Phased project with pilot in SAFT factory B2B/B2G: successes in large European cities:
starting in 2020 London, Amsterdam, Brussels
• 500 M$ equity injection over 10 years Fast Charging Points: one super-fast charging
station (150 kW+) every 150 km in Europe by 2022
• Leveraging cutting-edge R&D from Group
48 GWh capacity (1 M EVs) in 2030 Targeting 150,000 charging points by 2025
> 10% equity IRR > 10% equity IRR
2020 Strategy and Outlook | 47Ambition for our global Scope 1+2+3
Emissions reduction,
Net Carbon Intensity of energy products sold to our customers a cross industry effort
Base 100 in 2015
Realized Ambition
vs. 2015
-6% -60% CO2
> -15% -35% or more
100 100
90 Airline companies
22 tCO2 *
80
70
60 Plane
Airports
manufacturer 22 tCO2 2 tCO2
22 tCO2
50
40
Engine
30 30 manufacturer
22 tCO2
2015 2019 2030 2040 2050
Scope 1 Scope 3
Total vs. Majors: the best track record since 2015
* Emissions from jet fuel for 1,000 km journey
2020 Strategy and Outlook | 48Meeting our customers demand :
growing sales while reducing emissions
Energy sold to our customers Scope 3 emissions*
PJ/y MtCO2e
12,000
15% Electrons
400
Biogas, H2
5% Emerging
world
40% 50%
Natural Gas
200 -30%
Biofuels
Europe
55%
35% Oil products
2019 2030 2015 2030
Commitment for Europe: -30% by 2030 on the way to Net Zero by 2050
Worldwide : 2030 lower than 2015
* From energy products used by our customers
2020 Strategy and Outlook | 49Resilience & Growth underpinning investment case
Be excellent on what we control
Cash breakeven < 25 $/b in 2020

      HSE              Delivery   Costs            Cash

                                          2020 Strategy and Outlook   |   51
Capital investment: discipline and flexibility
Capital investment*
B$
Renewables & Electricity
13-16
• Growing share with > 15% of
< 14 Group Capex over 2021-25
< 12 • Confirming floor > 2 B$/y
2021
• Facing uncertainty
• Preserving flexibility
with > 30% not committed
2020 re vised 2021 2022-25
Brent ($/b) 40? 50-60
* Capital investment = Organic Capex + acquisitions – disposals
2020 Strategy and Outlook | 52Cost reduction: accelerating and
increasing efforts in all segments
Opex savings vs. 2019 base
Exercising Leveraging
contracts favorable
flexibility market
2 B$
1 B$ Optimizing
Digital operations
& logistics
Feb. 2020 guidance Freezing
recruitments Streamlining
2020 2023 Excl. new HQ staff
energies
& digital
On track to deliver 1 B$ savings in 2020
2020 Strategy and Outlook | 53Upstream production: value over volume
LNG projects driving 2021+ profitable growth
Production
kboe/d
~2%/y
Pre-FID Quotas* impact in 2020:
Projects already 100 kboe/d
3
launched
+40% LNG production growth
over 2020-25
2
Base Low 3%/y decline thanks to
~50% of long plateau with no
decline (LNG, Middle East…)
1
2019 2022 2025
Weathering the storm Profitable project start-ups
• Quotas Short-cycle reactivation
• Portfolio flexibility
* OPEC+ quotas and curtailments
2020 Strategy and Outlook | 54Delivering cash flow growth
Debt adjusted cash flow (DACF)
B$
ROE >10%
@ 50$/b
60 $/b
+5 B$ 50 $/b
25 at 50 $/b
40 $/b
51 $/b
40 $/b
10
2H19-1H20 2021** 2025*
* Same European Refining margin than realized 2H19-1H20 (30 $/t)
** Brent 40 $/b – NBP 4.5 $/Mbtu - HH 2.5 $/Mbtu – European Refining margin 35 $/t
2020 Strategy and Outlook | 55Clear priorities for cash flow allocation
1 2 3 4
Capital Balance Share
Dividend
investment sheet buyback
13-16 B$
over 2022-25 Gearing < 20% Flexible at
Supported
higher oil prices
at 40 $/b
Renewables & Power Grade A credit rating when gearing < 20%
> 2 B$
2020 Strategy and Outlook | 56UN Global
Actively engaged in ESG Compact
LEAD
Company
Environment / Climate Social Governance
New by-laws: Board
Overcoming Covid-19 with
Getting to Net Zero ambition overseeing Social and
solidarity. No layoffs.
Environmental stakes
Lead Independent Director
Transparency Safety as a value.
directly engaged with
New biodiversity policy Mobilizing for Zero fatality
shareholders
Aligning advocacy with Promoting gender equality CEO compensation
climate ambition & international diversity linked to Climate ambition
2020 Strategy and Outlook | 57Transforming Total into a broad energy company
Growing profitably while decreasing emissions
Growing energy production from LNG and Renewables
• Capitalizing on competitive advantages to thrive profitably
in Renewables & Electricity
• High-quality low-cost hydrocarbon assets and strong
discipline on spend
Committed to reduce absolute Scope 3 emissions by 2030
• Clear Climate ambition and targets
• Adapting sales mix to demand evolution
Dividend supported at 40 $/b
• Low breakeven < 25 $/b
• Robust balance sheet
Total EnergieS : compelling investment case
supporting stock rerating
2020 Strategy and Outlook | 58
1Disclaimer
This document may contain forward-looking statements within the meaning of the Private Securities However, in certain instances, transactions such as restructuring costs or asset disposals, which are not
Litigation Reform Act of 1995, notably with respect to the financial condition, results of operations, business considered to be representative of the normal course of business, may be qualified as special items
activities and industrial strategy of TOTAL. This document may also contain statements regarding the although they may have occurred within prior years or are likely to occur again within the coming years.
perspectives, objectives and goals of the Group, including with respect to climate change and carbon
neutrality (net zero emissions). An ambition expresses an outcome desired by the Group, it being specified (ii) Inventory valuation effect
The adjusted results of the Refining & Chemicals and Marketing & Services segments are presented
that the means to be deployed do not depend solely on TOTAL. These forward-looking statements may
according to the replacement cost method. This method is used to assess the segments’ performance and
generally be identified by the use of the future or conditional tense or forward-looking words such as
“envisions”, “intends”, “anticipates”, “believes”, “considers”, “plans”, “expects”, “thinks”, “targets”, “aims” facilitate the comparability of the segments’ performance with those of its competitors.
or similar terminology. Such forward-looking statements included in this document are based on economic In the replacement cost method, which approximates the LIFO (Last-In, First-Out) method, the variation of
data, estimates and assumptions prepared in a given economic, competitive and regulatory environment inventory values in the statement of income is, depending on the nature of the inventory, determined using
and considered to be reasonable by the Group as of the date of this document. either the month-end price differentials between one period and another or the average prices of the
period rather than the historical value. The inventory valuation effect is the difference between the results
These forward-looking statements are not historical data and should not be interpreted as assurances that
the perspectives, objectives or goals announced will be achieved. They may prove to be inaccurate in the according to the FIFO (First-In, First-Out) and the replacement cost.
future, and may evolve or be modified with a significant difference between the actual results and those (iii) Effect of changes in fair value
initially estimated, due to the uncertainties notably related to the economic, financial, competitive and The effect of changes in fair value presented as an adjustment item reflects for some transactions
regulatory environment, or due to the occurrence of risk factors, such as, notably, the price fluctuations in differences between internal measures of performance used by TOTAL’s management and the accounting
crude oil and natural gas, the evolution of the demand and price of petroleum products, the changes in for these transactions under IFRS.
production results and reserves estimates, the ability to achieve cost reductions and operating efficiencies
without unduly disrupting business operations, changes in laws and regulations including those related to IFRS requires that trading inventories be recorded at their fair value using period-end spot prices. In order to
the environment and climate, currency fluctuations, as well as economic and political developments, best reflect the management of economic exposure through derivative transactions, internal indicators
changes in market conditions, loss of market share and changes in consumer preferences including those used to measure performance include valuations of trading inventories based on forward prices.
due to epidemics such as Covid-19. Additionally, certain financial information is based on estimates TOTAL, in its trading activities, enters into storage contracts, whose future effects are recorded at fair value
particularly in the assessment of the recoverable value of assets and potential impairments of assets
in Group’s internal economic performance. IFRS precludes recognition of this fair value effect.
relating thereto.
Furthermore, TOTAL enters into derivative instruments to risk manage certain operational contracts or
Neither TOTAL nor any of its subsidiaries assumes any obligation to update publicly any forward-looking
assets. Under IFRS, these derivatives are recorded at fair value while the underlying operational transactions
information or statement, objectives or trends contained in this document whether as a result of new
are recorded as they occur. Internal indicators defer the fair value on derivatives to match with the
information, future events or otherwise. Further information on factors, risks and uncertainties that could transaction occurrence.
affect the Group’s business, financial condition, including its operating income and cash flow, reputation or
outlook is provided in the most recent version of the Universal Registration Document which is filed by the The adjusted results (adjusted operating income, adjusted net operating income, adjusted net income) are
Company with the French Autorité des Marchés Financiers and the annual report on Form 20-F/A filed with the defined as replacement cost results, adjusted for special items, excluding the effect of changes in fair value.
United States Securities and Exchange Commission (“SEC”).
Euro amounts presented herein represent dollar amounts converted at the average euro-dollar (€-$)
Financial information by business segment is reported in accordance with the internal reporting system and exchange rate for the applicable period and are not the result of financial statements prepared in euros.
shows internal segment information that is used to manage and measure the performance of TOTAL. In
This document also contains extra-financial performance indicators, including a carbon intensity indicator
addition to IFRS measures, certain alternative performance indicators are presented, such as performance
indicators excluding the adjustment items described below (adjusted operating income, adjusted net for energy products used by Total customers, that measures the average greenhouse gas emissions of
operating income, adjusted net income), return on equity (ROE), return on average capital employed those products, from their production to their end use, per unit of energy. This indicator covers the direct
GHG emissions of production and processing facilities (scope 1) and their indirect emissions associated with
(ROACE), gearing ratio and operating cash flow before working capital changes. These indicators are meant to
facilitate the analysis of the financial performance of TOTAL and the comparison of income between periods. energy purchase (Scope 2), as well as the emissions associated with the use of products by the customers
of the Group (Scope 3) which Total does not control (for the definitions of scopes 1, 2 and 3, refer to Total’s
They allow investors to track the measures used internally to manage and measure the performance of the
Group. Universal Registration Document).
These adjustment items include: Cautionary Note to U.S. Investors – The SEC permits oil and gas companies, in their filings with the SEC, to
separately disclose proved, probable and possible reserves that a company has determined in accordance
(i) Special items with SEC rules. We may use certain terms in this presentation, such as “potential reserves” or “resources”, that
Due to their unusual nature or particular significance, certain transactions qualified as "special items" are the SEC’s guidelines strictly prohibit us from including in filings with the SEC. U.S. investors are urged to
excluded from the business segment figures. In general, special items relate to transactions that are consider closely the disclosure in our Form 20-F/A, File N° 1-10888, available from us at 2, place Jean Millier –
significant, infrequent or unusual. Arche Nord Coupole/Regnault – 92078 Paris-La Défense Cedex, France, or at our website total.com. You can
also obtain this form from the SEC by calling 1-800-SEC-0330 or on the SEC’s website sec.gov.
2020 Strategy and Outlook | 59For more information, please visit total.com TOTAL SE Investor Relations 10 Upper Bank Street, Canary Wharf London E14 5BF United Kingdom Share capital: 6,632,810,062.50 euros 542 051 180 RCS Nanterre Reception: +33 (0)1 47 44 45 46 total.com Investor Relations: +44 (0)207 719 7962
You can also read