Eskom 2018/19 Revenue Application Closing remarks - Nersa Public Hearing Midrand 20 November 2017
←
→
Page content transcription
If your browser does not render page correctly, please read the page content below
Eskom 2018/19
Revenue Application

Closing remarks
Nersa Public Hearing

Midrand
20 November 2017
Content

     1    System Performance and capacity

     2    Adjustments being made in terms of MYPD methodology

     3    Clarification of issues raised during public hearings

     4    Analysis by external parties

     5    Financial position, debt and rating agencies

     6    Conclusion

                                                                  1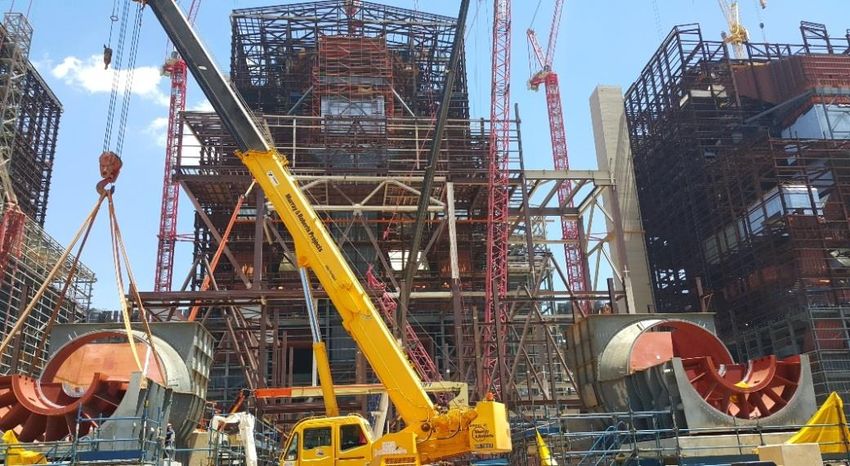
System Operator's Day-Ahead Generation
 Scheduling Process

   Renewable
                      Demand forecast
    Forecast

                                                       Network constraints

                                                                  Day ahead contract
Cost of generation

                     Unconstrained
                        schedule
                     (Cheapest mix)
                                        Constrained schedule

Operating reserve
  requirement
Nominal Capacity versus Peak demand

        Available Capacity          Operating Reserves         PCLF       UCLF         Peak Demand   Installed Capacity

45000
          7500 MW                                    Breakdowns (UCLF)            6500 MW

40000
                                                         Average Planned Maintenance (PCLF)
                                                         6800 MW
35000
                                                              Operating Reserve
                                                              2000MW
30000

                                                                                   Peak Demand
25000
                                                           Available Capacity
20000
             Nov                     Dec                        Jan                    Feb               Mar
                             2017                                                      2018

 Production plan is optimised to ensure that required maintenance is executed and demand is met.
 Excess generation will then be placed into Cold Reserve
                                                                                                                          3
Maintenance is on track in line with 80:10:10
     strategy

Generation planned maintenance performance1 FY2014 to FY2018
                                                                     Key Insights
 Percentage (%)
                                                                     • Current projections
                           12,99                                       indicate a PCLF of
                                    12,14                              10% by year end
      10,50                                                    PCLF
                    9,91                             10,00            • PCLF is higher in
                                                               Target
                                              8,37             10%      FY2016 and FY2017
                                                                        as Eskom conducted
                                                                        more maintenance to
                                                                        address to catch up
                                                                        with maintenance

    FY2014        FY2015   FY2016   FY2017   FY2018 FY2018
                                              YTD Projection

                                                                                         4
Source: Eskom Generation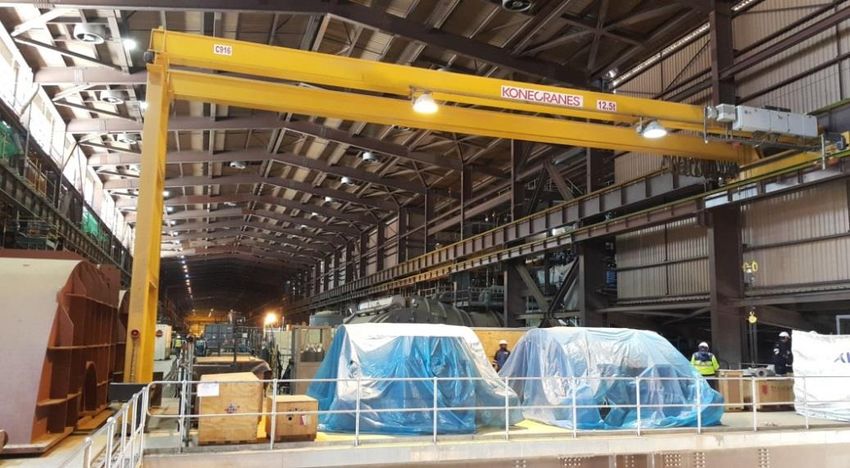
Percentage of breakdowns after Outages is very
     low

  UCLF, %                                                                  Key Insights
                                                                           ▪ The UCLF for
                                     Post outage UCLF    UCLF
                                                                             FY2018 YTD (31
                                             11,68   11,88                   October 2017) is
                                              0,44    0,64                   8.27%
               9,44   10,49                                                ▪ Post Outage UCLF
               0,68                   8,86                   9,60            contributed only 0.6%
                      0,88
                              7,54    0,55                          0,60     to total UCLF
    7,30
    0,34                      0,64

                                             11,24   11,24
                      9,61                                   9,00
               8,76                   8,31
    6,96                      6,90

   Apr-17 May-17 Jun-17 Jul-17 Aug-17 Sep-17 Oct-17 Average

SOURCE: GPSS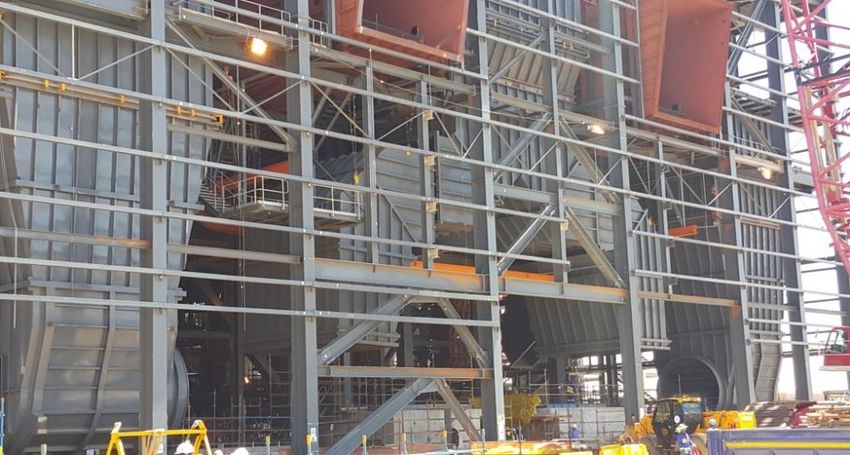
Threshold for operating stations is a function of
economics
The age based life expectancy used for long term planning (first & last units)
Camden : 2020 & 2023
Hendrina : 2020 & 2027
Komati : 2024 & 2029
Grootvlei : 2025 & 2028
However, life of a station can be extended beyond this age based life expectancy if it is economically
viable to do that
Eskom has determined that it is not economically viable to extend the life of Hendrina, Komati
Camden and Grootvlei beyond their age based life expectancy
These plants are of an old design with a lower thermodynamic efficiency which will not improve above
that of newer design even if the station is refurbished (these stations do not have reheaters whereas
newer designs have reheaters)
Moreover in FY2020, Hendrina, Komati & Grootvlei are not required to meet production and will not
be dispatched (even before most units reach age based life expectancy) due to the fact that they have
higher projected scheduling costs amongst stations that do not affect voltage stability of KZN
Source: Eskom Generation 6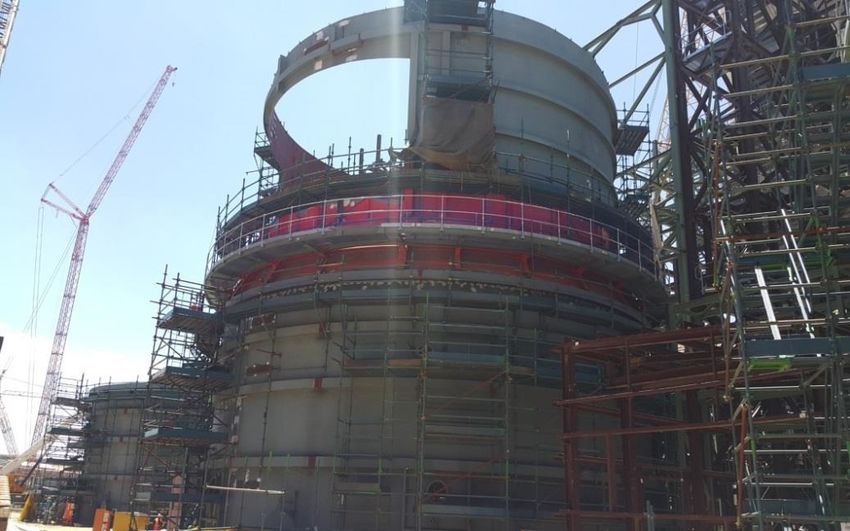
Extended cold reserve can be ringfenced
One of the key inputs to conclusion on economic viability and Production Commercial
Operation of new build (Medupi, Kusile, REIPP’s) which lead to conclusion of excess capacity
It is therefore advisable to put the plant in extended cold reserve as a risk mitigation against
any future uncertainties
cold reserve will result in massive savings in Opex and Capex because it is not operational
e.g. Eskom stopped the replacement of Turbines at Hendrina at contract stage
However, some preservation expenditure will be required for the stations in cold reserve
Eskom will provide written feedback to NERSA on the costs of preservation as well as savings
due to cold reserve per station
7
Source: Eskom Generation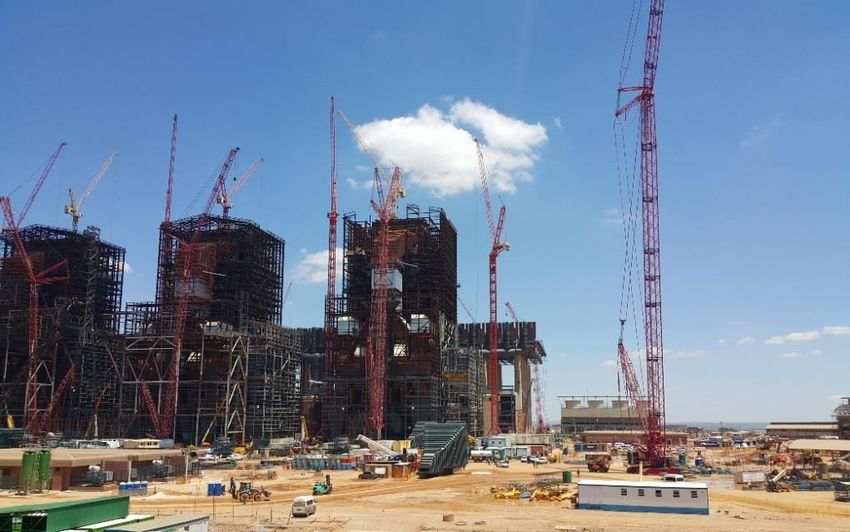
South Africa vs Australia

                                                                                                                   National
       Eskom                                                                                                       Electricity
                                                                                                                   Market
       + IPP                                                  Capacity (GW)
                         Integrated report 31 March 2017
                                                                                                                   (NEM) & (SWIS)
                                                                                  NEM Total electricity
                                                                                                                   (94% of Demand)
                         * Including imports
                                                           49 161     52 500      generating capacity April 2017

                                                                                  NEM Fact Sheet

Both Operates on one of the World’s Longest interconnected power systems around
         4,300 kilometres.                                    Energy (TWh)
                                                                                                        5,000 kilometres.
                                                           237 215    197 723
         32,220 km of                                                                                   40,000 km of
         transmission lines                                 84 %        77 %                            transmission lines
         and cables.                                                                                    and cables.
                                                           0.01 %        9%                             High developed Market’s
        No Market Electricity,
        Limited Gas & Coal Market’s                                                                     Electricity, Coal & Gas
                                                           *4.7 %            7%
                                                                                      Coal                          Gas
Coal              Gas
                                                             5%          5%

                                                             1%          1%

                                                NUCLEAR
                                                             6%              0%
                                                                                      8
Although similar electrical Capacity & Energy Mix Australia Market driven with mature Electricity/Coal/Gas markets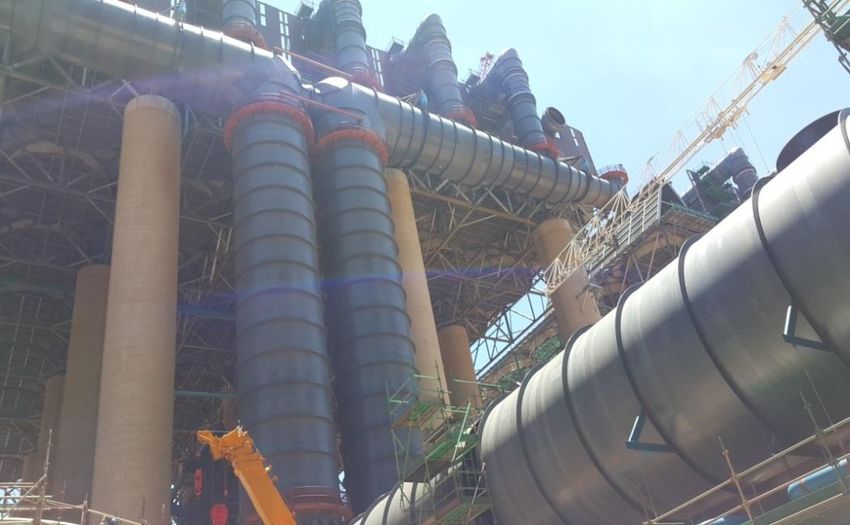
Household Energy Price &
     Comparative price in other open markets
  Australian Chief Economist & ACCC has reported significant increases in Household energy price
over the past 10 year in the Australia Electricity Market compared with the increase in wages and CPI

                                                                                                         ACCC – Australia
                                                                                                          Competition &
                                                                                                            Consumer
                                                                                                           Commission

       Australian Household Energy Price high compared with Competitive
                                                          Australia     markets in European
                                                                      residential           Countries
                                                                                    electricity prices
                                                                  (May 2017 prices Australia, 2015 prices European Countries)
   AEMO – Australia
    Energy Market
      Operator              South Africa
                             Aus ($) 1 = R10.58

                            2.5 R/kWh = 24
                           Australian cents

                      Competitive market high
                       renewable penetration
                                                      9
                      South Africa Household tariff remain lower than the Australian Household
Concerns about aging power plant
Closed Coal Fired Power Plan and aging generation fleet in Australian is placing pressure on the
stability of the grid.
Conventional Capacity Closed
Capacity (GW)
Conventional Plant
Energy (TWh) provides multiple
services
Grid stability
Aging profile
Conventional Capacity Replacing with Renewable generation
provides dominantly energy
Capacity (GW) Energy (TWh) Grid stability
OCGT, CCGT, Batteries,
Renewables Flywheels, New
Pump storage,
batteries,, New Technologies,
Technologies, Smart Grid etc
etc
New energy from renewable source do not provide adequate capacity and system stability services.
Acquire these service maybe required Additional
2017/11/20 10 Markets which may increasing price pressures.The New Build Programme is at an advanced stage
In the event that part of Medupi Kusile
or all of the works are
suspended at Medupi & Considering construction In the case of Kusile, based on
Kusile there would be progress, it will not be the assumption that the
significant contractual feasible to suspend all suspension would be
and commercial or part of the works at implemented with immediate
implications Medupi. effect it would result in
significant additional cost.
Although expenditure In addition the decision to cease
would be temporarily construction would have a
deferred, the net result tremendous social and
would be that the projects economic impact on in excess
would incur significant of 22,000 people currently
additional costs when it directly employed on the Project
came to restarting and Site and a further undetermined
completing the remaining number of people and business’s
construction and indirectly employed in the
commissioning Works. surrounding communities
providing support and services to
Most contract packages the Project.
are placed and
committed for Medupi
and Kusile.Eskom has made significant progress in
implementing Medupi new build project
84.70% overall project completion
Unit 6: Unit 5: Unit 4: Unit 3: Unit 2: Unit 1:
99.72% 99.67% 88.43% 87.95% 68.71% 63.67%Eskom has made significant progress in implementing
Kusile new build project
82.60% overall project completion
Unit 1: Unit 2: Unit 3: Unit 4: Unit 5: Unit 6:
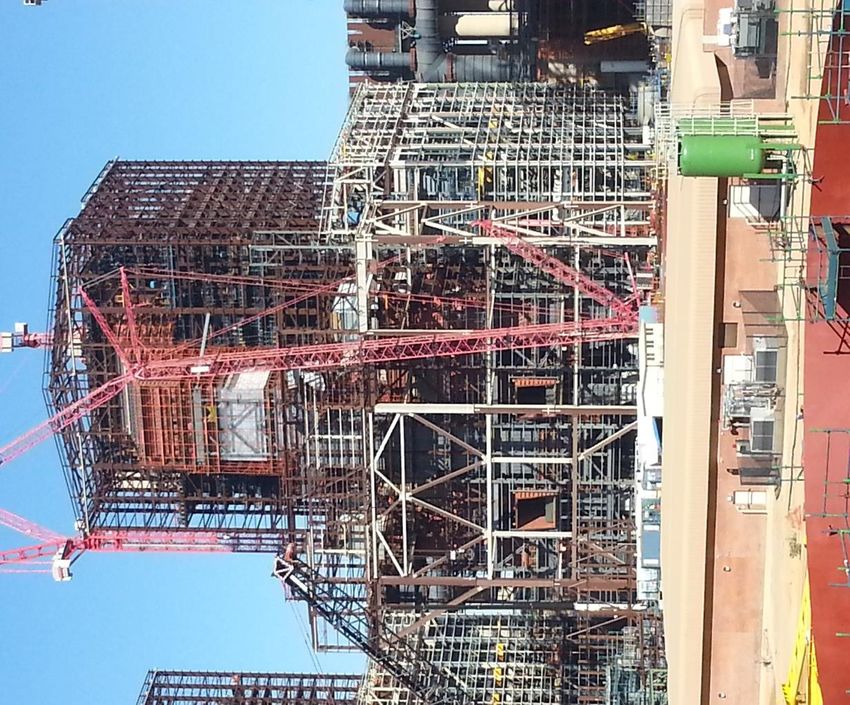
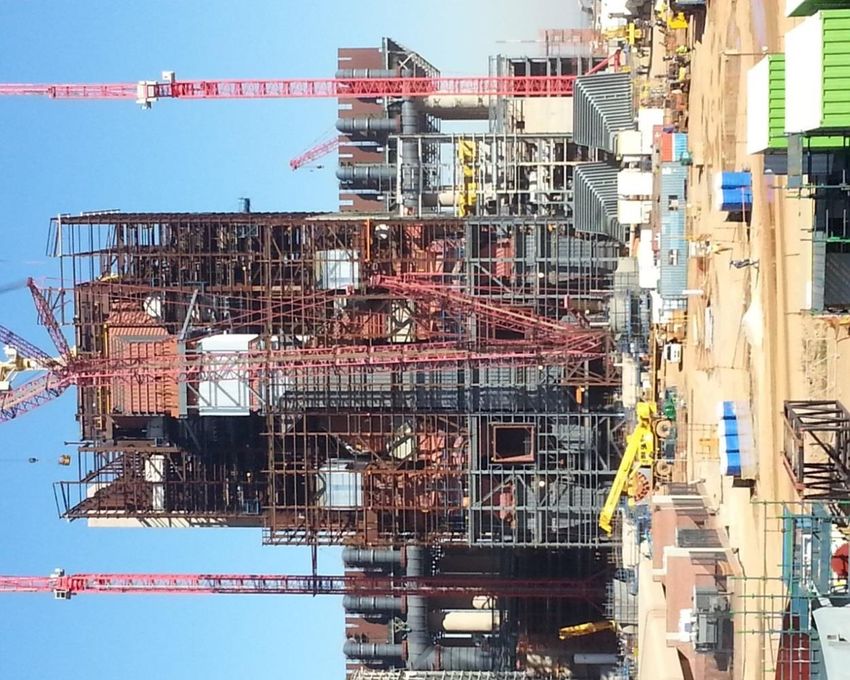
99.02% 93.12% 75.27% 61.83% 53% 46%Kusile Unit 5: Progress in Pictures
CRT Tank Assembly and Installation
Unit 5 Overall Progress: 53% (A) vs. 48% (P) Unit Transformer Foundation ConstructionKusile Unit 5: Progress in Pictures
Installation of Burners Refractory Rings FGD Pump House
ACC Top Steam Header Installation Progress on Aux Bay Rooms (Brick works and Fire proofing)Kusile Unit 5: Progress in Pictures FGD Absorber Tank ACC Main Exhaust Ducts Unit 5 Turbine Hall ID Fans Installation
Kusile Unit 6: Progress in Pictures

                                               Generator Rotor Installation

Unit 6 Overall Progress: 46% (A) vs. 41% (P)   Turbine Piping Installation
Kusile Unit 6: Progress in Pictures ACC Top steam headers installed 2 Bunkers Delivered to Site Welding Connecting Tubes to Headers Turbine Piping Installation
Kusile Unit 6: Progress in Pictures

Unit 6 Turbine Hall                   Primary Air Ducts

PJFF Support Structure Installation   Units Over view
Adjustments being made to Eskom’s application
  in accordance with MYPD methodology

Sales
Changes in sales volume projections (GWh) for 2018/19 year, with a reduction in standard
tariffs sales volumes of 4 871GWh

        Standard Tariff Sales            188 082
        NPA Sales                          9 750
        Export Sales                      13 634
        Total Sales                      211 466
                                                        6,305

IPPs                            13,634
                                                                     4,871
 – Drop in 6 305 GWh of energy to be secured from IPPs
 – Drop in R7 080m for costs of IPPs

Coal Costs
Coal costs increase to address drop in energy that was to be secured from IPPs
 – Net increase in coal costs following drop in sales volumes and reduced IPPs of R450m

                                                                                           20
Update of Revenue Requirement and Price increase
after reducing IPPs by R7bn and accounting for the
latest sales forecasts with reflects a 5TWh decline
Application Adjustments to Revised Application
Allowable Revenue (AR) Fx
FY2018/19 (R’m) Application FY2018/19 (R’m)
Regulated Asset Base RAB 763 589 763 589
WACC (%) ROA × 2.97% 2.97% 2.97%
Returns 22 690 0 22 690
Expenditure E + 62 221 0 62 221
Primary energy PE + 59 340 450 59 790
IPPs (local) PE + 34 209 -7 080 27 129
International purchases PE + 3 216 0 3 216
Depreciation D + 29 140 0 29 140
IDM I + 511 0 511
Research & development R&D + 193 0 193
Levies and taxes L&T + 7 994 0 7 994
RCA RCA + - - -
Total Allowable Revenue 219 514 -6 630 212 884
Recovered from non standard tariff customers 13 309 244 13 553
Standard tariff customers R’m 206 2015 -6 840 199 331
Standard tariff sales volumes GWh 192 953 -4 871 188 082
Standard tariff price c/kWh 106.87 105.98
Standard tariff price adjustments % 19.90% 18.91%
Revenue requirement drops by R6630m with 18.9% average price increase & 26.9% for Munics from 1 July 2018In order to achieve a CPI price increase in 2018/19 will
require a revenue reduction of R22 billion – Scenario
Application Adjustments to Revised Application
Allowable Revenue (AR) Fx
FY2018/19 (R’m) Application FY2018/19 (R’m)
Regulated Asset Base RAB 763 589 763 589
WACC (%) ROA × 2.97% 2.97% 2.97%
Returns 22 690 0 22 690
Expenditure E + 62 221 -22 000 40 221
Primary energy PE + 59 340 450 59 790
IPPs (local) PE + 34 209 -7 080 27 129
International purchases PE + 3 216 0 3 216
Depreciation D + 29 140 0 29 140
IDM I + 511 0 511
Research & development R&D + 193 0 193
Levies and taxes L&T + 7 994 0 7 994
RCA RCA + - - -
Total Allowable Revenue 219 514 -28 630 190 884
Recovered from non standard tariff customers 13 309 244 13 553
Standard tariff customers R’m 206 2015 -28 874 177 331
Standard tariff sales volumes GWh 192 953 -4 871 188 082
Standard tariff price c/kWh 106.87 94.28
Standard tariff price adjustments % 19.90% 5.78%
Revenue requirement drops to R191bn which is R14bn lower than R205 billion allowed in 2017/18Specific reasons for drop in sales in industrial sector
provided by Eskom customers
Customers having improved co-gen capacity
Mines affected by worked out resources, uneconomical existing shafts, safety incidents and high running
costs
Ageing plant, decline in world commodities (post commodities boom) and importing of cheaper products
Customer exposed to depleting feedstock
Customers having liquidated or applied for business rescue due to financial vulnerability and low
competitiveness
Struggling to compete with international sister plants due to production costs, with production allocated
to most cost effective plants by the parent company
Shutting down operations and relocated to Asia due to incentives offered
Voluntary contribution to the Energy Conservation Scheme
Decline in world commodities, reduced competitiveness
Opting to export un-beneficiated ore
The price of electricity alone is unlikely to reverse the deterioration
in the economy; it would require a holistic approach
23It is common practice in most countries to provide
incentives for certain sectors of economy (1)
Nearly all countries have policies to protect certain sectors of the economy and society.
The State is significantly involved in determining sectors and type of support that is needed with short
and long term incentives including tax breaks
In South Africa the following is done to support the different sectors:
Residential Sector
– Facilitation of access to electricity through government national electrification program.
– Social grants provided directly to customers through Free Basic Electricity of 50 kWh per
household per month by national government to the indigent through the Equitable Share Fund.
Eskom provides FBE to customers in their area of supply as an agent for the municipalities
– For the MYPD3 period the increase on the Homelight 20A customers (lifeline tariff) was lower than
the average increase.
• Subsidised by direct Eskom large urban customers (affordability subsidy)
Agricultural Sector
– A challenge is the cost of the large networks to be built to provide supply to farmers – causing high
fixed network costs
– Agricultural customers are subsidized by large high voltage urban customers around 32% through
a ‘Low Voltage Subsidy”
24Minimal impact to Eskom poor residential customers
• Of the approximately 6 million Eskom customers the majority are on Eskom Homelight 20A tariff
• For 350kWh monthly electricity consumption, on the Homelight 20A tariff, customers would pay an
additional R57 per month
• The average usage for Homelight 20A customers is around 100 kWh/customer/month
• The majority of Eskom residential customers will pay around R16 per month more for electricity
1,712
Rand
274
Increase
2017/18 tariff
827
130 1,438
384
57 697
165
55 25 327
47 8 140
50kWH 150kWH 350kWh 700kWh 1400kWh
Consumption per month
25It is common practice in most countries to provide
incentives for certain sectors of economy (2)
Short Term Special Incentive Products to increase current sales
Industrial Sector – Government is in process of developing framework
– Short Term Pricing Incentive Framework to retain customers and sales
• DOE is developing a Short-term Electricity Incentive Programme to provide opportunities to
retain existing businesses that have closed down or are at serious risk of failure owing to
their inability to compete in markets
• Purpose is to provide incentives to encourage large consumers to increase their offtake of
electrical energy to fully utilise existing production capacity to support sustained and
increasing economic activity
– Proposed tariffs for electricity-intensive industry consumers
• To stabilise and increase sales to electricity intensive industrial consumers with very high
load factors
It is critical that National Government plays a significant role in
- determining which sectors of society and the economy require support,
- ensuring there is a level playing field between customers of Eskom and municipalities;
- ensuring that incentives are provided to contribute to economy
26Eskom response to Governance challenges and
Corruption
Eskom is mindful that actions in dealing with governance issues, are a test and a determiner of
future success. The following has already been implemented
– Strengthening general internal ethics and fraud framework
– Implementing independent audits on leadership
– Terminating all irregular supplier contracts and work:
• McKinsey contract was terminated in July 2017.
• Contract with Impulse International has been suspended, pending outcome of forensic
investigation
• There are no dealings with Trillian contractually or otherwise
• Independent audits on Tegeta contracts have been clarified as being within range of other
similar contracts and all control gaps have since been tightened
– Enhancing the internal commercial governance process
– Instituting disciplinary charges and taking legal action when required
• Suspended eight members of leadership who have allegedly been involved in governance
irregularities. Four of whom are from Executive team
• Have instituted criminal charges against certain Eskom management in this regard
27Clarifications of certain points raised during public
hearing
The NERSA decision for the last year of the MYPD 3 period (2017/18) was a nominal increase of 2.2%
from the previous year’s tariff.
This is experienced as an effective decrease in real terms by consumers
Difference in accounting and regulatory rules for capacity charges for DOE Peakers results in difference
in IPP costs reflected in Eskom’s Annual Financial statements and Eskom’s revenue application
Avon and Dedisa are two contracts that are classified as finance lease according to IFRIC 4 for
Financial Accounting purposes.
MYPD methodology: Purchases or procurement of energy and capacity from IPPs, including
capacity payments, energy payments and any other payments as set out in the PPA, will be
allowed as a full pass-through cost.
Eskom is required to undertake Generation build projects when determined by the Minister of Energy in
accordance with the IRP and the ERA
The IRP 2010 included Sere, Ingula, Medupi and Kusile
Eskom is not in a position to undertake further renewable build projects unless determined by the
Minister of EnergyStaff complement has escalated over last 10 years
with a reduction reflected in over the next few years
Distribution headcount growth of 4300 over the 10 year period due to:
– Increase in electrification numbers – 1.75million more end customers
– Increase of 54 Customer Network Centers to improve response time and to reduce outages
– 900 Temporary Employment Agency workers absorbed due to change in legislation
– Significant focus to restore and improve network performance and manage customer risk on
service delivery.
Generation headcount growth of 2482 over the 10 year period due to:
– Majuba P/S that moved away from two shifting to running base load - 150
– RTS (Camden, Grootvlei, Komati ) plus Medupi and Kusile - 1605
– Peaking resource capacitation for Ankerlig, Gourikwa & Ingula - 237
– Nuclear New build preparation additional - 490
– Learners of 4308 and bursar intake of 1058 over 10 year period (some of these are included in
the Generation and Distribution staff complements)
– Eskom’s application reflects drop of 4454 from 43640 (2015/16) to 39186 (2018/19)
29What has Eskom done to contribute to easing
burden on the consumer and fiscus
Eskom has reduced its costs by R47bn for the first four years of the MYPD 3 period
The total target for the 5 year MYPD 3 period is R60bn – this is by March 2018
The application made for the 2018/19 year has already taken these into account
The areas where these savings against budget were realised include
– Employee benefit costs
– Primary energy costs
– Reprioritising of capital expenditure to the extent possible within the legislative requirements
Eskom has significantly rephased recovery of allowed ROA
Processes to recover debt from Municipalities and Soweto customers
– Municipality debt recovery is complex due to Municipalities not being able to recover from their
own customers – is a challenge that COGTA, NT and SALGA are also addressing
– Eskom has submitted rationalisation of Municipal tariffs to NERSA
– Eskom is making every effort to manage the Soweto challenge – installing split metering
– Have increased cut-off level – with increased cut-off this financial year – majority of which were
not reconnected
30How has Eskom’s costs moved from FY2017 to
FY2019
Coal burn costs have increased by 10,2% over a 2 year period , averaging 5.1%
Staff costs have increased by 1,6% over a 2 year period , averaging 0.8%
Other Operating costs have decreased by -11,9% over a 2 year period , averaging -6%
Maintenance costs have increased by 25.4% over a 2 year period , averaging 12.7%
Generation own PE costs (excl Coal usage and Coal provision) have increased by 23.3% over
2 year period , averaging 11.62%
IPP costs have increased by 25% (after reducing R7bn) over 2 year period , averaging 12.5%
Capital expenditure have increased by 30.5% over 2 year period , averaging 15.2%
Item 2016/17 2017/18 2018/19 % growth source
FY19 –FY17
Coal usage costs 44 164 45 642 48 687 10.2% Table 23
IPPs 21 720 24 450 34 209 -7080 25% Table 23
=27 129
Generation own PE (excl coal 7 582 8 794 9 349 23.3% Table 23
usage and coal provision costs)
Staff costs 27 902 28 213 28 363 1.6% Table 30
Other Opex costs 17 938 15 385 15 796 -11.9% Table 30
Maintenance costs 14 087 15 610 17 665 25.4% Table 30
Capital Expenditure 58 923 65 783 76 941 30.5% Table 22
31The ‘utility financial death spiral’ for Eskom should not be
artificially created through subsidies or through price
premiums (costs reflected for illustrative purposes only)
c/kwh For illustrative purposes only
230
‘Financial death spiral’ is actually another term for
True gap
‘demand reaching a relatively price elastic zone’.
to the
potential 187 It could potentially commence when the substitutes
start of and alternatives become economically viable,
utility compared to grid electricity.
financial 70 Gap as Subsidies to reduce the perceived cost of such
death 180 perceived substitutes and alternatives, or premiums to the cost of
spiral 117 by many grid electricity, could artificially narrow the gap.
municipal Indications are that Eskom’s current average price, and
customers, also the price reflective of prudent and efficient cost is
to start of well below the cost of substitutes and alternatives.
82 82
financial This might not be the case with many municipalities due
death to ‘surcharges’, cross-subsidies, etc.
spiral. Inappropriate decisions around the pricing of
50 electricity could potentially have significant
35 35 consequences:
- 42% of Eskom volumes are sold to municipalities. If
Eskom cost Off grid/own Average this volume is reduced due to artificial mechanisms
generation selling price it could create stranded assets and unrecovered
of Munic sunk costs, for Eskom as well as municipalities.
Self generation cost - Customers more able to afford own generation
Munic cost and surcharges could defect off-grid faster. Even if due to artificial
Eskom cost price signals, once off-grid it is likely to remain off-
Transmission and Distribution cost grid.
- Policy decisions needed on subsidies and
Self grid storage, back-up etc
surchargesIllustration of financial effects of price reduction and
volume increase
Various studies of price elasticity of demand for electricity have estimated electricity
demand as relative inelastic – e.g.
– textiles and clothing -0.23,
– manufacturing -0.3,
– metals -0.31,
– ferro-alloys commodities –0.89.
Thus, at -0.3 a real increase in price of 10% would cause a volume reduction of 3%
This dynamic would however mostly be observed once electricity prices reach a level that
is close to the cost of viable alternatives
The simple calculation shows however that a 10% general price reduction would require a
16.9% volume increase merely to break-even financially (and assuming that primary
energy increases at the average cost of Primary Energy per kWh)
33What BUSA and EIUG saw as a balanced price for
2017/18 year
EIUG analysis indicates that tariff increases in the range of 10% to 13% are
sufficient to support Eskom’s viability and fundability over the MYPD3 period.
Corresponds to 97.69c to 111.76c by 2017/18
BUSA – in MYPD 3 decision – would be 101.7c/kWh by the 2017/18 year
Entity Year Proposal for price (KWh)
EIUG during MYPD 3 hearings 2017/18 Range of 98 to 112c
BUSA during MYPD 3 hearings 2017/18 102c
34World bank Report 2016 – summary of inefficient
(hidden) costs
• The World bank study defined certain parameters that reflect efficient operations. Any deviation
from these norms are seen to be inefficient and defined as hidden costs
• The norms are
- Transmission & distribution losses (both technical and commercial) should beChamber of Mines agree that country should guard
against the impact on Government debt
Macroeconomic impacts of alternative scenarios to meet Eskom’s five-year revenue requirement
The impact of the 5 scenarios on Government Debt were modelled and the outcomes are
illustrated below
120% • The price increase cannot be
seen in isolation
104% • If Eskom does not receive the
100% 100% required revenue through the tariff
– it impacts the fiscus and
Government debt to GDP (%)
88%
80% taxpayer – someone needs to pay
– thus the VAT, debt and
68% downgrade impact
60% 67% • Significant changes are seen in
55%
1A: 13%, debt Government debt to GDP levels
1B: 19%, tariff • Concerns on impact of price
40%
increases were also raised
BAU2: 8%, downgrade • Addressing generating capacity
20% 3A: 8%, VAT was raised
• This is being done – will be after
BAU1: 8%, debt this revenue cycle
0% .
2014
2019
2012
2013
2015
2016
2017
2018
2020
2021
2022
2023
2024
2025
2026
2027
2028
2029
2030
36Financial Implications : Cash from operations over
MYPD3 covered debt service commitments but did not
allow for a build up of cash reserves in the balance sheet
50,000
40,000
Cash from
30,000 operations (CFO)
20,000
10,000
0
CFO after
Interest repayments
(10,000)
(20,000) CFO after
debt repayments
(30,000)
FY2013 FY2014 FY2015 FY2016 FY2017 FY2018
Note: In FY2016 and FY2017 the MYPD 2 and FY2014 RCA’s were liquidated which improved the cash from operations
37Full cost recovery would have required ave price of
120c/kWh in 2019, on reduced DRC asset values as per
application (and 129c/kWh on historical asset values – thus even higher)
c/kWh Gap
Gap
represents
represents
R59bn
R42bn
revenue p.a. Applied-for price in 2018/19 not yet
revenue p.a.
cost-reflective
Gap in 2018/19 approx. 20c/kWh
Revenue shortfall approx. R42bn in
2018/19
This shortfall cannot be closed with
efficiencies / cost-cutting as it would
imply eliminating 66% of total O&M
Eskom has been raising debt to fund
the cash gap caused by revenue
Revised shortfall
revenue
This has been the situation since
application
for R213bn / 2008 and is not sustainable
101c/kWh (for Revenue Application FY2018-19 the revenue
and price on DHC is higher than on DRC due to
low RAB value on DRC)
38Eskom has sacrificed Returns in an effort to reduce
impact on consumer
Eskom has reduced the ROA % from 4.7% (2017/18) to 2.97% (2018/19)
– Returns of R22 690 million does not cover interest costs
– Net interest costs paid in 2016/17 was R26 560 million
– Thus the equity returns in the application is negative
Price increase is minimal and remains in base electricity price until full RCA is recovered over longer
period
Item 2018/19
Returns on Asset R22 690m
Net Interest costs R36 200m
Return on Equity (R13 510m)
Eskom cannot be financially sustainable if it must borrow to pay for interest
In this application the depreciation component contributes towards covering interest
39Regulatory Clearing Accounts (RCAs)
BUSA , EIUG and other stakeholders have called for a waiver of the outstanding RCAs
Eskom rejects this proposal on the following basis:
– Contravenes the Electricity Regulation Act, MYPD Methodology – utility must be allowed to
recover efficient costs and earn fair return
– SALGA have confirmed that RCAs will allow Eskom to earned the Revenue which was awarded
– Outstanding RCAs (Year2, 3 and 4) – total R66billion with revenue variance contributing R45
billion
– Eskom expects the trend of approximately R20bn for RCA 2017/18 (year5) to continue
During selective reopener stakeholders criticised Eskom for not complying with
MYPD Methodology, while now they expect Eskom and NERSA to contravene
MYPD Methodology
Eskom does acknowledge the impact that RCAs will have on the electricity and
affordability
40Recommendation on outstanding RCAs
Eskom’s cost base grows by inflation between FY2017 to FY2019
– RCAs will be processed together with MYPD4 decision
– RCAs will be liquidated from April 2019 on phased in basis
Example
– Assume that of the R66bn – NERSA decides that R42bn is allowed to be recovered over a period
– Price increase is minimal and remains in base electricity price until full RCA is recovered over longer
period
Item 2019 2020 2021 2022 2023
Revenue allowed R200bn
RCA Price adjustment 1.0% 1.0% 1.0% 0% 0%
RCA Revenue impact R2bn R4bn R6bn R6bn R6bn
Benefits :
– Allows Eskom to address the affordability of consumers
– Use the RCA decision to refinance debt and raise loans (confidence to investors & rating agencies)
– Provide auditors with further certainty around revenue generation to address going concern
41Fitch Ratings puts Eskom on “Rating Watch
Negative” … extract from 17 Nov 2017
42In conclusion
Eskom appreciates the robust Nersa process and comments and criticism received
during the last 3 weeks – endeavor to address issues in the future
As a SOE – Eskom business model is determined by policy
We don’t have the latitude to pursue only profitable customers or stop supplying
non-paying customers
The impact of the reduced IPP costs plus the updated lower sales forecasts makes
a minimal impact on the price increase
Fitch Ratings have indicated the importance of this price decision and certainty
around the outstanding RCAs
Eskom’s cost base has escalated by inflationary levels from FY2017 – have sacrificed
returns to reduce impact on customers
However debt service commitments are escalating by more than inflation
Eskom is not financially sustainable with a CPI price increase as this would imply
an average price increase of 4% (2.2% in 2017/18 + 6% in 2018/19) over the 2 years
43You can also read