FY2021 results Year ended 30 June 2021 - Boral Limited

Page created by Barbara Payne
 
CONTINUE READING
FY2021 results Year ended 30 June 2021 - Boral Limited
FY2021 results
                                            Year ended 30 June 2021

                                       Building a stronger Boral

                                                                                              24 August 2021

Agenda

01   FY21 highlights & overview   Zlatko Todorcevski         04       Strategy & priorities

                                                                                                Zlatko Todorcevski

02   Financial performance                                   05       Outlook

                                  Tino La Spina

03   Financial Framework                                     06       Supplementary slides

                                                                                                                     2
FY2021 results Year ended 30 June 2021 - Boral Limited
FY21 strategy highlights
Significant progress to focus the portfolio, unlock value and build a competitive and profitable core business

 New strategy in place with progress across 4 pillars: FOCUS, POSITION, REDEFINE and EXTEND

 Sale of 50% interest in USG Boral for US$1.015b complete

 Sale of Midland Brick for A$86m complete

 Sale of Meridian Brick for US$250m1 targeting to complete in 1Q FY22

 Sale of North American Building Products business for US$2.15b (~A$2.9b) expected to complete in 1H FY22

 Sale of Timber business for A$64.5m expected to complete in 1H FY22

 Assessment of strategic options for Fly Ash undertaken – now well progressed with divestment decision / process

 Financial Framework supporting balance sheet and shareholder returns
     •   net debt at $0.9b at lower end of range
     •   10% of issued capital purchased at an average price of $7.012

 Significant surplus post completion of divestments

 New operating model effective 1 July sees Boral Australia organised along national products lines

1.   Equates to US$125m for Boral’s 50% share
2.   78.9m shares or 6% of issued capital purchased in FY21; with the remainder purchased after 30 June 2021                                                                                    3

FY21 financial highlights
Solid progress to improve returns and deliver better operating leverage
Total operations                                                                                                   Continuing operations
 Underlying profit after tax1 $251m, up 44%                                                                        Revenue of $2.92b, down 6%

 Statutory profit after tax $640m, versus loss of ($1.145b) in FY20                                                EBIT1 (including property) of $181m, down 8%

 Return on funds employed               (ROFE)1,2     of 7.4%, versus 4.3% in FY20                                 EBIT1 (excluding property) of $157m, up 11%

 Underlying EPS1 (cents) 20.6, versus 14.5 in FY20                                                                 Transformation benefits of $75m (net of inflation) in line with target;
                                                                                                                     including $69m in continuing operations and $6m in discontinued Building
 Statutory EPS (cents) 52.5                                                                                         Products Australia
 No final dividend                                                                                                 ROFE1,2 (including property) of 8.3%, versus 8.8% in FY20

                                                                                                                    ROFE1,2 (excluding property) of 7.2%, versus 6.3% in FY20

1.   Excluding significant items
2.   ROFE is EBIT before significant items on funds employed (average of opening and closing funds employed for the year)                                                                       4
FY2021 results Year ended 30 June 2021 - Boral Limited
Commitment to Zero Harm Today
Boral Australia
                                                                                                        Serious harm injury
                                                                                                                                                             Reporting of H&S metrics broadened to include two
Recordable injury frequency rates (RIFR)1                                                               frequency rates                                       indicators:
Figures may not add due to rounding
                                                                                                        (SHIFR)2                                               • actual SHIFR
                                                         Comparable data                                                                                       • potential SHIFR
13.1
                                                                  MTIFR
                                                                                                            Potential SHIFR
                                                                                  11.9                                                                       In FY21, Boral Australia reported a 67% reduction in
             11.2      11.3                                       LTIFR                                                                                       ASHIFR and 53% reduction in PSHFIR. This reflects
                                   10.5                                                                                                                       implementation of programs that focus on critical
                                                9.8        10.3       10.0                                    10.8                                            controls as well as identifying and preventing
                                                                                                                                                              incidents that cause serious harm
                                                                                                                                  5.1
                                                                                                                                                             RIFR1 up 19% to 11.9
                                                                                   8.7
                                                                                                             FY20               FY21
                                                            8.4                                                                                              Efforts to minimise risk of spreading COVID-19 virus
                                                                       7.4
                                                                                                                                                              remain a key priority including hygiene practices,
                                                                                                            Actual SHIFR                                      social distancing, tracking and tracing, and employee
                                                                                                                                                              wellbeing

                                                                                                                0.3                                          Serious environmental incident frequency rate
                                                                        2.6        3.1                                                                        (SEIFR)3 was 0.3, which was an improvement on the
                                                            1.8                                                                                               prior year. Boral Australia received no penalty
                                                                                                                                                              infringement notices in FY21
FY16       FY17        FY18        FY19       FY20        FY19        FY20       FY21                                             0.1

                                                                                                              FY20               FY21

1.   RIFR per million hours worked is made up of lost time injury frequency rate (LTIFR) and medical treatment frequency injury rate (MTIFR) for Boral Australia (incl Building Products). FY16 – FY20 data
     includes employees and contractors in all businesses and joint ventures. Comparable data includes only 100%-owned businesses and controlled joint venture operations only
2.   Serious Harm Injury Frequency Rates (PSHIFR and ASHIFR) per million hours worked for employees and contractors in 100% owned businesses and controlled JVs including Building Products                           5
3.   Serious Environmental Incident Frequency Rate (SEIFR) is defined as Level 3 (or greater) environmental, regulatory or community incident rate (per million hours worked)

Challenging market conditions
Australian market drivers                                                                                                                                                    Boral Australia2, %
Roads Highways Subdivisions & Bridges (RHS&B) & Other engineering1
 ~3% decrease in RHS&B VWD (-9% NSW, +1% Vic, +3% Qld, -8% SA, -5% WA)
    ~7% decrease in Other Engineering VWD (-5% NSW, -10% Vic, -4% Qld, -15% SA, -6% WA)

Non-residential1
    Non-residential VWD declined ~5% (-3% NSW, -8% Vic, -5% Qld, -9% WA)
    Commercial Office & retail segments heavily impacted due to uncertainty around post pandemic demand

Share of revenue from major projects at ~10% in FY21 versus 17% in FY20
    Boral’s NSW major projects revenue down 63% and Qld down 52%
    Temporary contraction in materials intensity of major projects – FY21 share of construction materials demand                                                                        42% RHS&B
     ~3% of VWD versus ~5% in FY20                                                                                                                                                       7%       Other engineering
    FY21 completion of key major projects (and some delays) ahead of new activity moving to execution                                                                                   18% Non-residential
      • Completed: Norfolk Island airport, North Connex, Pacific Highway and Northern Road (NSW),                                                                                        11% Detached housing
        Melbourne Metro Rail (Vic), Logan Enhancement, M1/M3, the Mudgeeraba to Varsity Lakes and                                                                                        9%       Multi-residential
        Sunshine Coast Airport (Qld)                                                                                                                                                     11% A&A
      • Delayed: West gate Tunnel (Vic)                                                                                                                                                  2%       Other
      • Limited significant new projects: West Connex & Line Wide System Connect projects (NSW) only
        significant projects commencing recently

1.    Macromonitor (Jul-21 Outlook) forecast
2.    Revenue by end market. Based on FY21 external revenue for continuing operations                                                                                                                                 6
FY2021 results Year ended 30 June 2021 - Boral Limited
Challenging market conditions (cont.)
Australian market drivers
Residential
    FY21 total housing starts1 estimated at ~201,000, up 16% on prior year (+11% NSW, +7% Vic, +13% Qld, +26% SA, +73% WA), reflecting:
     • ~32% increase in detached housing starts supported by government stimulus (+25% NSW, +21% Vic, +21% Qld, +49% SA, +91% WA)
     • ~6% decline (and 44% below peak) in multi-residential reflecting lower immigration (flat in NSW, -14% Vic, -1% Qld, -31% SA, +10% WA)

    FY21 total residential VWD2 estimated to be down ~1% on prior year, reflecting:
     • ~7% increase in detached housing VWD (+2% NSW, +5% Vic, +8% Qld, +21% SA, +18% WA)
     • ~12% decline in multi-residential VWD (-7% NSW, -16% Vic, -10% Qld, -22% SA, -13% WA)

    Alterations and additions2 VWD up ~11% (+17% NSW, +1% Vic, +21% Qld, +8% SA and +4% WA)

    COVID continues to reshape construction demand in Australia; with largest net migration out of capital cities on record in March Quarter3

    Overall, Boral’s share of revenue from residential (incl A&A) was 31% in FY21 vs 28% in FY20

Overall, VWD across all construction segments was down ~3% in FY21, with a greater impact on Boral due to:
    lower materials intensity from major projects relative to last year
    major project completions and project delays
    geographic exposure (NSW down ~3%, Vic down ~5%, Qld flat, WA down ~2%, SA flat)

1.   ABS original housing starts to Mar-21 quarter plus Macromonitor (Jul-21 Outlook) forecast
2.   ABS to Mar-21 quarter plus Macromonitor (Jul-21 Outlook) forecast                                                                           7
3.   Regional internal migration estimates, provisional, RBA March 2021, August 2021

       Financial performance
                                                                                                                                                 8
FY2021 results Year ended 30 June 2021 - Boral Limited
Summary of financials
 A$m                                                  FY21              FY203             Var %
                                                                                                                       Solid earnings from total operations
                                                                                                                       reflect improved US market conditions
 Total operations basis
 Revenue                                               5,346              5,728               (7)
                                                                                                                       and Australian transformation initiatives
 EBITDA1                                                882                807                 9                           For Total operations, the impact of lower revenue primarily from
                                                                                                                            continuing operations, was offset by delivery of the Group transformation
 EBIT1                                                  445                324                37                            targets and improved results in North America
 EBIT ROS 1                                            8.3%               5.7%
                                                                                                                           Net profit after tax of $251m, up 44% on prior year
 Net profit after tax1                                  251                174                44
 Significant gross items                                358              (1,408)                                           Significant items (gross) of $358m reflects:
                                                                                                                               • $399m profit on divestments and related matters
 Tax on significant items                                32                 90
                                                                                                                               •   $21m restructuring / transformation costs
 Statutory profit/(loss) after tax                      640              (1,145)                                               •   $10m SAP implementation costs
 ROFE1,2                                               7.4%               4.3%                                                 •   $10m takeover costs
 Continuing operations basis
                                                                                                                           For continuing operations, revenue was down and lower property
 Revenue                                               2,924              3,117               (6)                           earnings offset the benefits of Transformation
 EBITDA1                                                406                435                (7)
 EBIT1                                                  181                197                (8)
 ROFE1,2 including Property                            8.3%               8.8%

1.   Excludes significant items
2.   ROFE is EBIT before significant items on funds employed (average of opening and closing funds employed for the year)                                                                           9
3.   FY20 comparative figures have been restated – see Note 1 (d) of the premliminary final reports for further details

Continuing operations
                                                                                                                       Revenues and earnings impacted by
                                                      FY21              FY203             Var %                        lower volumes and softer prices
A$m
Revenue                                                2,924              3,117               (6)                      Revenue declined 6%
             1
                                                                                                                        lower volumes (3% lower in concrete and 4% lower in quarries) reflecting
EBITDA                                                  406                435                (7)                         less demand from infrastructure and major projects; weakness in demand
                                                                                                                          from multi-residential and non-residential construction; only partially
EBITDA1 ROS                                            13.9%             14.0%                                            offset by growth in detached housing and A&A
                                                                                                                        ~1-2% lower like-for-like selling prices in concrete, quarries & aggregates
EBIT1                                                   181                197                (8)
       1                                                                                                               Major projects (including concrete placing) contributed ~10% of revenue
EBIT ROS                                               6.2%               6.3%
                                                                                                                       relative to 17% in prior year, as key projects completed (esp in NSW and
                                                                                                                       Qld) and others delayed ahead of new projects moving to execution, and as
Property                                                 24                 55               (56)
                                                                                                                       current projects are less materials intensive (
FY2021 results Year ended 30 June 2021 - Boral Limited
EBIT drivers
                                                      Continuing operations
                                                                                                                                                                                                                                           445
                                                                                                                                  $51m of reversals from prior year COVID impacts and
                                                                                                                                  one-offs (continuing ops only) plus $14m benefit from
                                                                                                                                    lower D&A, partially offset by $13m of net one-off
                                                                                                                                       items including kiln outage and legal costs.

                              324      127                                                                                                                                                                              264

                                                                               Net volume decline impact of
                                                                             ~$77m after reversal of prior year                  Net Transformation benefit
                                                                            flood and bushfire volume impacts                     ~$69m (excludes $6m in
                                                                               of $24m (continuing ops only)                           discontinued)4

                                                       197      55
 A$m

                                                                                                                                                                                                24          181
                                                                                       24
                                                                                                                                                         50           52            157
                                                                            142                       101
                                                                                                                                      119

                                                                                                                   29

       FY20 EBIT1                                     FY20               FY20 EBIT1                                                                                              FY21 EBIT1                FY21                         FY21 EBIT1

                                                                                                                                       Cost savings3
                                                                                                                   Price / mix
                                      Discontinued2

                                                                                                                                                                                                                        Discontinued2
                                                              Property

                                                                                             Volume

                                                                                                                                                                                                Property
                                                                                                                                                         Inflation

                                                                                                                                                                      One-offs
               Total                                  EBIT1                 ex.                                                                                                     ex.                    EBIT1                          Total
             operations                                                   Property                                                                                                Property                                              operations

1.     Excluding significant items
2.     Discontinued operations include the Australian Building Products business, Boral North America and Boral‘s 50% interest in its USG Boral Joint Venture
3.     Cost savings delivered by Boral Australia from permanent cost reduction initiatives and exclude savings from discontnued operations                                                                                                       11
4.     Excludes $6m of Transformation benefits from Building Products business which is classified as discontinued. See slide 45 for a reconciliation of data for continuing and discontinued operations

Boral Australia FY21 volume movement EBIT drivers
                                                                                                                                                                                  The reversal of prior year flood and bushfire
                                                                                                                                                                                  volume impacts of $24m for continuing
                                                                                                                                                                                  operations is captured in the movements
                                                                                                                                                                                  across each segment driver1

                                                                8                       -6

                                      16                                                                               -21
       FY21 EBIT impact A$m

                                                                                                                                                                -34

                                                                                                                                                                                                                  -77

                                                                                                                                                                                       -40

                                    Detached                  A&A                       Multi-                     Non-                                RHS&B and                      Major                  Total volume
                                    housing                                          residential                residential                               other                      projects              impact on EBIT
                                                                                                                                                       engineering

1. See slide 45 for a reconciliation of data for continuing and discontinued operations
Note that management estimates for margins by sector have been used to determine EBIT impact by sector                                                                                                                                           12
FY2021 results Year ended 30 June 2021 - Boral Limited
Financial Framework
                                                                                                                                      13

Disciplined Financial Framework
   Optimal capital                                 Disciplined            Total shareholder return
     structure                                 allocation of capital
 Target net debt range of      ROFE                                         Total Shareholder Return ranks 5th in ASX 100 for the
                                                Disciplined investment
  2 – 2.5 times EBITDA,          >                                            year to 30 June 2021
                                                 / divestment decisions
  where ROFE = WACC             WACC
                                                Return surplus capital      TSR of 89.9% is top quartile of ASX 100, in line with
 Target net debt $900m                                                       target under the financial framework
                                                 to shareholders
  to $1.1b

                             EPS growth in
                             top quartile of
                                ASX100

                              TSR in top
                               quartile
                              of ASX100

                                                                                                                                      14
FY2021 results Year ended 30 June 2021 - Boral Limited
Optimal capital structure
Targeting net debt of 2 – 2.5 x EBITDA incl. leases                                                                         A$m Debt maturity profile –
                                                                                                                            30 June 2021
    Optimal net debt range (including leases) is 2 – 2.5 x EBITDA,
     equivalent to $0.9b - $1.1b where ROFE = WACC for continuing
     operations

    Net debt (incl. leases) for continuing operations at 30 June 2021 of                                                                              100      125
                                                                                                                                                                                672
     $900m

    Short-term liquidity at 30 June 2021 of ~$1.35b, including cash of                                                                                312      300
     $904m                                                                                                                           169
                                                                                                                                               225                       187                     32
    Undrawn committed bank facilities ~A$450m
                                                                                                                            FY22   FY23      FY24     FY25     FY26     FY27    FY28     FY29   FY30
       -     maturing in 2024, 2025 & 2026, currently undrawn
                                                                                                                                                     Bank     USPP       144A    Undrawn
    Weighted average tenor of 4.9 years
       -     next debt maturity ~US$127m Nov 2022                                                                                  Net debt reconciliation, A$m                   FY21
                                                                                                                                   Opening balance                                (2,580)
                                                                                                                                   Cash flow                                      1,213
                                                                                                                                   Transferred to liabilities held for sale        207
                                                                                                                                   Non cash (FX/lease)                             261
                                                                                                                                   Closing balance                                (899)

                                                                                                                                                                                                       15

Cash flow
A$m                                                                                FY21                FY202
                                                                                                                        Free cash flow higher following receipt of sale proceeds
(figures may not add due to rounding)                                                                                   and focus on cash flow generation through FY21
EBITDA1                                                                              882                   807
                                                                                                                           Improved EBITDA performance
Change in working capital and other                                                 (10)                    11
                                                                                                                           Steady net working capital performance
Interest and tax                                                                    (141)                 (152)
Equity earnings less dividends                                                        12                  (13)             Reduction in capital expenditure of $70 million in FY21

Other items - including profit on sale of assets                                    (28)                   (2)             Cash receipt from USG & Midland disposals of $1.45 billion
Restructuring, transaction & integration payments                                   (61)                  (38)
                                                                                                                           Share buy-back outflow of $507 million
Operating cash flow                                                                  654                   613
Repayment of lease principal                                                        (88)                  (98)
Capital expenditure                                                                 (258)                 (328)
Proceeds on disposal of assets                                                     1,450                    40
Free cash flow                                                                     1,758                   227
Share buy-back                                                                      (507)                    -
Dividends paid                                                                         -                  (158)
Settlement of financial instruments                                                 (38)                     -
Cash flow                                                                          1,213                    69

1.   Excluding significant items
2.   FY20 comparative figures have been restated – see Note 1 (c) of the preliminary final report for further details                                                                                  16
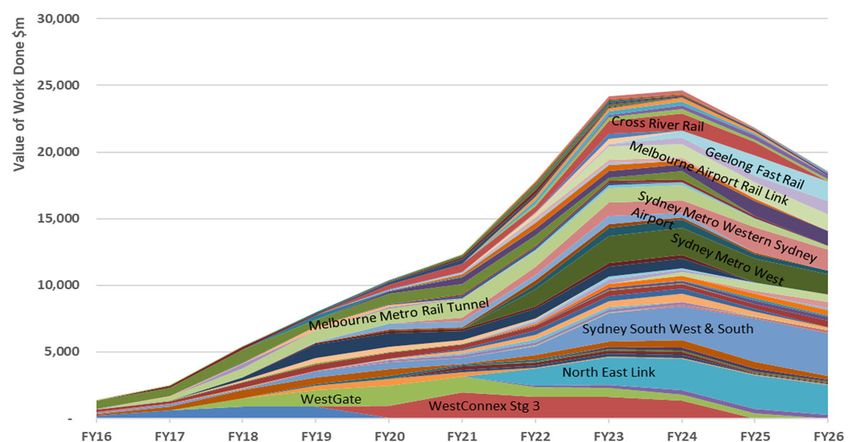
FY2021 results Year ended 30 June 2021 - Boral Limited
Transformation
Well underway to delivering our targeted $200-$250 million of transformation benefits

                                                              Indicative Australian transformation timing
                                                                                                                                                                                               Transformation target
     FY21 Gross Transformation
                                                                                                                                                  $5-10m             $125-175m                      breakdown
     benefits of $125m includes:                                                                                              $20-30m
     • Labour $51m
     • Ops Excellence $40m                                                                                   $15-25m
     • Procurement $29m
                                                                                     $25-35m
     • Supply chain $3m
     • Operating model $1m
                                                                $60-75m
     • Concrete network $1m
     Less
     • Inflation $50m

                                            $75m
                                                                                                                                                                                            Supply Chain ~$50-65m
                                                                                                                                                                                            Operating model ~$40-55m
                                                                                                                                                                                            Operations Excellence ~$20-30m
                                                                                                                                                                                            Adjacencies ~$15-25m

$75m includes $6m of
Transformation benefits in                  FY21                   FY22                   FY23                  FY24            FY25               FY26          Transformation
discontinued building                      Actual                                                                                                                  Target total
products businesses

                                                                                                                                                                                                                        17

Capital expenditure
Disciplined reinvestment in the business                                                                                  Depreciation & amortisation1 (continuing)
                                                                                                                          Capex continuing
 FY21 total capital expenditure (total operations) of $313m                                                              Capex discontinued
        •     $258m of capital acquisitions
        •     $55m of lease additions                                                                                                                                       169
                                                                                                                                                               150                       205
 Boral Australia
                                                                                                                                                   64
        •     Port of Geelong clinker grinding & storage
                                                                                                                                     101                                                             129
        •     Tarong Fly Ash                                                                                                                                                                   239
                                                                                                                                                                                   201                     225
                                                                                                                         60                 188          193          191
 Boral North America                                                                                                          184

        •     Kirkland natural pozzolan grinding
                                                                                                                                                                            284                                  ~300
                                                                                                                                                  276          275
        •     Miller ash collection upgrade                                                                                                                                              249
                                                                                                                                     223
                                                                                                                        190                                                                          184
 ~$300m capex for continuing operations expected in FY22,
  including:
        •     completion of Geelong clinker facility, Tarong fly ash and
              Berrima chlorine by-pass project (alternative fuels)                                                      FY15         FY16         FY17         FY18         FY19         FY202       FY21    FY22(f)
        •     strategic land purchase at Dunmore
                                                                                                                                                  Pre AASB 16                            Post AASB 16

1.    Depreciation & amortisation excludes acquired amortisation
2.    FY20 comparative figures have been restated  see Note 1(c) of the preliminary final report for further details                                                                                                   18
                                                                                                                                                                                                                         18
FY2021 results Year ended 30 June 2021 - Boral Limited
Disciplined capital allocation
 Focus remains on disciplined capital allocation
     •   Net debt of $0.9b is in line with target

     •   No surplus capital currently available to return to shareholders

 Post receipt of proceeds from Boral North America Building Products, Meridian Brick and Timber divestments, net debt will fall
  below the target, creating surplus capital

 Subject to any additional ROFE accretive opportunities, surplus capital will be available for distribution to shareholders

 Manner of distributing surplus capital to shareholders will consider the circumstances at the time and will be subject to:
     •   availability of franking credits

     •   Boral’s share price

     •   preferences of shareholders

                                                                                                                                   19

    Strategy & priorities
                                                                                                                                   20
Boral’s four strategy pillars
We have been progressing a comprehensive program of work to create a more purposeful organisation
with a clear strategy and frameworks to achieve our objectives

                                                                                            A   FOCUS Boral’s portfolio and unlock value:
                                                                                                Divest non-core businesses to strengthen
                                                                                                the portfolio from both a strategic and financial
                                                                                                perspective

                                                                                            B   POSITION our core business in Australia to build
                                                                                                a competitive and profitable core to underpin our
                                                                                                position as the national Australian leader in our
                                                                                                chosen segments

                                                                                            C   REDEFINE our business and operations to
                                                                                                become the leader in decarbonisation so that we are
                                                                                                best positioned to pre-empt and act upon emerging
                                                                                                trends

                                                                                            D   EXTEND Boral’s operations by exploring future
                                                                                                opportunities to create value from the
                                                                                                commercialisation of innovations

                                                                                                                                                    21

Delivering our strategy – Focus and Position
A   FOCUS Boral’s portfolio and unlock value                     B   POSITION our core business in Australia
     Financial Framework embedded; completed 10%                     New operating model effective 1 July sees Boral
      share buyback at average price of $7.01 per share                Australia organised along national products lines
     Sale of USG Boral complete                                      Business Transformation Program: Boral Australia
     Midland Brick complete                                           targeting $200-$250m of net EBIT transformation
                                                                       benefits; with $75m delivered in FY21
     Sale of Meridian Brick, targeting completion in 1Q FY22
                                                                      Potential to realise latent value within the existing
     Sale of North American Building Products business for            property portfolio – surplus property represents a
      US$2.15 billion (~A$2.9 billion) expected to complete in         market value of at least $850m
      1H FY22
     Progressing divestment of Fly Ash business

            We are focused on unlocking value                                Considerable rigour in approach
               and growing the bottom line                               including Steering Committee structure
                                                                                   across each stream

                                                                                                                                                    22
Delivering our strategy – Redefine
C   REDEFINE to strengthen our competitive advantage
     Adjacent growth strategies                              Targeting Net Zero by 2050 on 1.5 degree decarbonisation
                                                               pathway
          recycling and waste
                                                                   Sector-leading short- and medium-term SBTi targets
          supplementary cementitious materials (SCMs)
                                                                   Decarbonisation pathways identified
          accelerating lower carbon products / technology
                                                                   Economics and available technologies
     Lower Carbon Concrete                                         will determine timing of investments
          Envisia®, Envirocrete®, Envirocrete®Plus           External funding and partnerships supplementing own
                                                               investment in R&D / innovation e.g.
                                                                   UTS Boral Centre for Sustainable Building
                                                                   $2.4m funding from Federal Government’s CCUS
                                                                    Development Fund towards a pilot-scale carbon
                                                                    capture and use project

                                                                                                                         23

Our sustainability framework
Decarbonisation comes together with other focus areas in our sustainability framework

                                                                                                                         24
                                                                                                                              24
Adopting climate targets aligned with
“How” we’ll deliver the strategy
    Now organised along national product lines – cement, quarries, concrete, asphalt and recycling, and
    transitioning to a new Leadership structure to reflect Boral’s focused portfolio as divestments complete

                                                                              Executive Committee1
            CEO & Managing
               Director
          ZLATKO TODORCEVSKI
                                          Chief Finance &              Chief People &                  Chief                       Company                  Chief Operating
                                          Strategy Officer             Culture Officer              Legal Officer                  Secretary                Officer (Interim)
                                           TINO LA SPINA             REBELLE MORIARTY               AMY JACKSON                DOMINIC MILLGATE             WAYNE MANNERS

                                                                                                                                                         Asset & Product Solutions
                                                                                              EGM                                     EGM                Supply Chain & Logistics
               EGM                 EGM                EGM                  EGM                                    EGM
                                                                                           Recycling &                               Sales &            Health, Safety & Environment
             Concrete             Cement             Quarries             Asphalt                             Major Projects
                                                                                             Growth                                 Marketing                    Innovation
                                                                                                                                                          Operational Excellence

1   Darren Schulz as President & CEO Boral North America remains in that role until portfolio actions complete and remains a member of the Executive Committee.
    Kylie FitzGerald as Group Investor Relations & Communications Director remains in that role and a member of the Executive Committee until early November 2021.

                                                                                                                                                                                       27

          Outlook
                                                                                                                                                                                       28
FY2022 outlook
Mixed and uncertain conditions in Australia are continuing with COVID disruptions significantly impacting
   Underlying market conditions in Australia expected to be mixed in FY22:
    • Infrastructure activity expected to improve slightly in 2H and but more so moving into FY23, particularly road construction
    • Non-residential activity expected to be broadly steady
    • Continued flow through of stimulus led detached housing activity but lead indicators suggest softening of demand to follow
    • Multi-residential activity expected to remain weak, with a lift in activity not expected until immigration returns

   Uncertainty across all geographies and market segments remains:
    • We were seeing signs of improved demand as we ended FY21 and moved into FY22, however, COVID disruptions and unprecedented impact on construction
      through temporary closures from July 2021 present early challenges and considerable uncertainty
    • In July 2021 construction closures in Greater Sydney and South Australia had an estimated EBIT impact of ~$16m due to lost volumes and higher costs.
      Further impacts continuing in 1Q FY22 in Greater Sydney due to LGA closures together with restrictions in other states and the slow ramp up of activity in SA.
    • At this stage, the impact of COVID disruptions in the first quarter may be in the order of ~$50m
    • Ability to recover lost volumes remains unclear
    • Will continue to take actions to minimise the financial impacts of COVID-related measures, including short-term cost measures

   Targeting FY22 Transformation benefits of ~$60 – $75m net of inflation, contributing to $200 – $250m target

   Additional financial considerations:
    • No significant Property sales are currently contemplated
    • Boral’s financing costs will be approximately 4.2% pa on gross debt value (including leases)
    • Capital expenditure (continuing operations) for FY22 expected to be around $300m (including new leases) subject to market conditions.

                                                                                                                                                                 29
                                                                                                                                                                  29

    Supplementary information
                                                                                                                                                                  30
Boral’s portfolio of upstream and downstream assets
Geographically diversified network of 3671 construction materials sites across Australia

 The combination of upstream assets with the                                                Revenue by region1                          Boral’s construction materials network1                                             Concrete
                                                                                            (FY21, %)                                                                                                                                   226
 location and service reach of its downstream                                                                                                                                                                               & placing
 assets provides Boral with a vertically integrated
 and attractive geographic footprint:                                                                                                                                                                                       Quarries    67

  Well positioned, high quality and efficient quarries to                                                                                                                         NT
   take advantage of the growth in New South Wales                                                                                                                                                    QLD
                                                                                                                                                                                                                            Asphalt     46
   and other key East Coast regions                                                                                                                                             1
                                                                                                                                                         WA                     1                65     17                  Cement2      6
  Boral owns a cement kiln, located in Berrima, New
   South Wales, and is in the final stages of completion                                                                                                                                         15     1
   of an import terminal in Geelong                                                                                                                 12
                                                                                                                                                                                                                            Recycling   12
                                                                                                                                                     7                              SA
  Good position in South-East Queensland through the                                                                                                                                                 NSW / ACT
   Sunstate Cement joint venture with Adbri Limited, with                                                                                            1
                                                                                                                                                                              10         3             94     14        5
   potential for further expansion opportunities
                                                                                                                                                                               9                       19     4
  Access to cost competitive, efficient rail logistics for                                      43% NSW / ACT
   key quarry and cement assets in NSW to send                                                                                                                                                    VIC / TAS
   upstream materials into metro areas for downstream                                            29% VIC / TAS / SA
                                                                                                                                                                                                             44     11         7
   manufacturing and distribution                                                                23% QLD
                                                                                                                                                                                                             16     1
  Well-positioned footprint of concrete and asphalt                                             5%     WA
   plants in key East Coast metro locations

1.   At 30 June 2021. Includes transport, fly ash and R&D sites. Concrete and asphalt sites include mobile plants. Excludes mothballed plants, distribution and administration sites.
                                                                                                                                                                                                                                        31
2.   Includes cement manufacturing, grinding, bagging and lime plants in NSW, a clinker plant in Victoria and a clinker grinding JV in Queensland.

Valuable upstream and downstream operations
Vertically integrated positions in key regions, especially East Coast states

                        Cement                                                                                    Quarries                                                                    Bitumen
                         ~70% manufactured clinker,                                                              (All Product Types)                                                          Bitumen
                          ~30% imported                                                                               ~30m tonnes p.a.                                                           Importers
                         1.5m tonne p.a. clinker kiln                                                                Close to 1b tonnes total                                                   Australia (BIA)
                          capacity and ~4m tonne p.a.                                                                  reserves with ~20–50 years                                                 JV
                          cement grinding capacity1                                                                    reserves in key metro quarries

                          ~ 50–60% cement volumes
                          sold internally to Concrete2

                                                                              ~40–50% quarry volumes                                                      ~5–15% Quarry volumes              ~35% of bitumen supplied
                                                                              sold internally to Concrete2,3                                             sold internally to Asphalt2,3       by BIA JV2

                                                                  Concrete and Placing4                                                                                    Asphalt
                                                                   >7m m3 p.a. concrete                                                                                    >2m tonnes of asphalt p.a.
                                                                                                                      ~35–55% Quarry
                                                                   Per m3 concrete: ~0.3t                                                                                  Per tonne asphalt: ~0.055t
                                                                                                                       volumes sold
                                                                    cementitious material; ~1.0t                                                                             bitumen; ~0.7t aggregates;
                                                                                                                        externally2
                                                                    aggregates; ~0.9t sand                                                                                   ~0.2t sand

                                                                                                          End customer

1.   Includes Boral’s share of 1.5m tonnes of grinding capacity in 50% owned Sunstate Cement JV
2.   Based on long-term historical average
3.   For sand aggregates only                                                                                                                                                                                                           32
4.   Placing operations in Sydney and SEQ only
Boral Australia (continuing operations), cost data

     FY21 $2.5b cash cost base, %                    FY21 Energy and fuel costs (continuing operations), A$m

                                                                              ~$130m
                                                                             Coal $14m
                                                                             Gas $12m

                                                                           Electricity $44m

                 27% Raw materials
                 26% Payroll                                                Diesel $59m1
                 27% Logistics
                 6%      Other costs
                 9%      Repairs & maintenance
                 5%      Energy & fuel

1.    Net of fuel tax rebates and excludes hedging                                                             33
                                                                                                                33

         Market data
                                                                                                               34
Boral Australia’s market segments
Revenues are derived from various market segments
             RHS&B2,3, VWD A$b                                                                                                                                      FY21 External revenue                                        Detached housing4, starts
   35                                                                                                                                                                                                            160,000
                                                                                                                                                                      by end-market1, %
   30
   25                                                                                                                                                                                                            120,000
   20
                                                                                                                                                                                                                   80,000
   15
   10                                                                                                                                                                                                              40,000
    5
    -                                                                                                                                                                                                                      -

                                                                                                                                                            FY21F
             FY06

                      FY07

                              FY08

                                     FY09

                                            FY10

                                                    FY11

                                                            FY12

                                                                     FY13

                                                                               FY14

                                                                                         FY15

                                                                                                     FY16

                                                                                                               FY17

                                                                                                                          FY18

                                                                                                                                      FY19

                                                                                                                                                FY20

                                                                                                                                                                                                                                                                                                                                                       FY21F
                                                                                                                                                                                                                               FY06
                                                                                                                                                                                                                                      FY07
                                                                                                                                                                                                                                             FY08
                                                                                                                                                                                                                                                    FY09
                                                                                                                                                                                                                                                            FY10
                                                                                                                                                                                                                                                                    FY11
                                                                                                                                                                                                                                                                            FY12
                                                                                                                                                                                                                                                                                    FY13
                                                                                                                                                                                                                                                                                            FY14
                                                                                                                                                                                                                                                                                                    FY15
                                                                                                                                                                                                                                                                                                            FY16
                                                                                                                                                                                                                                                                                                                    FY17
                                                                                                                                                                                                                                                                                                                            FY18
                                                                                                                                                                                                                                                                                                                                     FY19
                                                                                                                                                                                                                                                                                                                                              FY20
             Other engineering2, VWD A$b
                                                                                                                                                                                                                                 Multi-residential4, starts
     75                                                                                                                                                                                                          160,000

     50                                                                                                                                                                                                          120,000

                                                                                                                                                                                                                  80,000
     25
                                                                                                                                                                                                                  40,000

         -                                                                                                                                                                42% RHS&B                                     -
                                                                                                                                                FY21F
               FY06
                       FY07
                              FY08
                                     FY09
                                            FY10
                                                   FY11
                                                           FY12
                                                                   FY13
                                                                            FY14
                                                                                      FY15
                                                                                              FY16
                                                                                                       FY17
                                                                                                                   FY18
                                                                                                                             FY19
                                                                                                                                      FY20

                                                                                                                                                                                                                               FY06
                                                                                                                                                                                                                                      FY07
                                                                                                                                                                                                                                             FY08
                                                                                                                                                                                                                                                    FY09
                                                                                                                                                                                                                                                           FY10
                                                                                                                                                                                                                                                                   FY11
                                                                                                                                                                                                                                                                           FY12
                                                                                                                                                                                                                                                                                   FY13
                                                                                                                                                                                                                                                                                           FY14
                                                                                                                                                                                                                                                                                                   FY15
                                                                                                                                                                                                                                                                                                           FY16
                                                                                                                                                                                                                                                                                                                   FY17
                                                                                                                                                                                                                                                                                                                           FY18
                                                                                                                                                                                                                                                                                                                                   FY19
                                                                                                                                                                                                                                                                                                                                            FY20
                                                                                                                                                                                                                                                                                                                                                     FY21F
                                                                                                                                                                          7%   Other engineering
                                                                                                                                                                          18% Non-residential
             Non-residential2, VWD A$b                                                                                                                                                                                           Alterations & Additions4, VWD A$b
                                                                                                                                                                          11% Detached housing
     60                                                                                                                                                                                                              12.5
     50                                                                                                                                                                   9%   Multi-residential                     10.0
     40                                                                                                                                                                   11% A&A                                     7.5
     30
     20
                                                                                                                                                                          2%   Other                                  5.0

     10                                                                                                                                                                                                               2.5
         -                                                                                                                                                                                                             -
              FY06

                       FY07

                              FY08

                                     FY09

                                            FY10

                                                   FY11

                                                           FY12

                                                                   FY13

                                                                             FY14

                                                                                       FY15

                                                                                                FY16

                                                                                                            FY17

                                                                                                                      FY18

                                                                                                                               FY19

                                                                                                                                         FY20

                                                                                                                                                  FY21F

                                                                                                                                                                                                                               FY06
                                                                                                                                                                                                                                      FY07
                                                                                                                                                                                                                                             FY08
                                                                                                                                                                                                                                                    FY09
                                                                                                                                                                                                                                                           FY10
                                                                                                                                                                                                                                                                   FY11
                                                                                                                                                                                                                                                                           FY12
                                                                                                                                                                                                                                                                                   FY13
                                                                                                                                                                                                                                                                                           FY14
                                                                                                                                                                                                                                                                                                   FY15
                                                                                                                                                                                                                                                                                                           FY16
                                                                                                                                                                                                                                                                                                                   FY17
                                                                                                                                                                                                                                                                                                                            FY18
                                                                                                                                                                                                                                                                                                                                    FY19
                                                                                                                                                                                                                                                                                                                                             FY20
                                                                                                                                                                                                                                                                                                                                                      FY21F
    1.       Based on split of FY21 Boral Australia external revenue                                                                                                           4.   Source: original series from ABS to Mar-21 and Macromonitor (Jul-21 Outlook)
    2.       Source: Macromonitor (Jul-21 Outlook) forecasts                                                                                                                        forecasts                                                                                                                                                                  35
    3.       Roads, highways, subdivisions and bridges

Australian construction VWD by segment
Construction spend in Australia in FY21 was lower than in recent years

 Total annual Australian construction spend by segment ($ billion)

                                                                                                48                                                 46
                                                                                                                                                                     44                 41
                                                   38
             38

                                                                                                30                                                 28                                                                Other Engineering
                                                   26                                                                                                                28                 27
             23
                                                                                                                                                                                                                     RHS&B

                                                   40                                         45                                                  46
             40                                                                                                                                                      49                 47                           Non-residential

             9                                     10                                           9                                                       9                                                            A&A
                                                                                                                                                                     9                  10
             30                                    33                                         34                                                  33                                    25                           Multi-residential
                                                                                                                                                                     28

                                                                                                                                                                                                                      Detached housing
             37                                    37                                         38                                                  38                 35                 38

         FY16                                FY17                                        FY18                                                FY19                   FY20            FY21 F

All historical and forecast data per Macromonitor                                                                                                                                                                                                                                                                                                              36
Australian residential construction decline
    Total housing starts1                                                                                          Housing starts – by state1
     (‘000)                                  Detached              Multi                                           FY21F vs FY20 (‘000)

        221         230                              16%
                                                            201                                     206
                                       197                                                 196
                                               173                     175       171
       106          108                                      66                                     65
                                       85                                                   68                                           +7%
                                                71                         70        72
                                                                                                                     +11%
                                                             134                           128      141
       115          121               112                              105
                                               102                                   99
                                                                                                                                                       +13%
      FY17         FY18               FY19     FY20        FY21F       1H20     2H20      1H21F    2H21F
    * Half year data annualised
                                                                                                                                                                                        +73%
    Alterations & additions1                                                                                                            59
                                                                                                                                               63
                                                                                                                             56
    (value of work, $b)                                                                                               50                                             +26%
                                              11%
                                                                                                                                                              35
                                                                                                                                                        31
                                                                                                                                                                                              24
                                                                                                                                                                         11    13       14
                                                           10.4        9.8                10.6     10.1
      9.6          9.2                9.4      9.3                              8.9
                                                                                                                     FY20 FY21F         FY20 FY21F     FY20 FY21F        FY20 FY21F     FY20 FY21F

                                                                                                                       NSW                VIC            QLD               SA                WA
     FY17         FY18            FY19        FY20         FY21F      1H20      2H20      1H21F   2H21F
    * Half year data annualised

    1. Original series housing starts from ABS to Mar-21 quarter. Forecast from Macromonitor (Jul-21) Outlook. % change FY20 vs FY21F
                                                                                                                                                                                                     37
    Note: Figures may not add due to rounding

Selection of Australian project work & potential pipeline1,2
                                            FY21 completed                                         FY22                                        FY23                                   FY24
  Boral                           •    Karratha Tom Price Rd, WA                 • Line Wide System Connect, NSW               • Snowy Hydro 2.0, NSW (precast),
                                       Melbourne Metro Rail Project                Mordialloc Bypass, Vic                        NSW
  projects                        •                                              •
                                       (Precast), Vic                            • Pacific Highway M1 (various), SE Qld        • Sydney Metro (Martin Place),
                                  •    Norfolk Island Airport, Offshore          • Saltwater Creek, Qld                          NSW
                                  •    RAAF East Sale, Vic                       • WestConnex 3B (above ground),               • Sydney Gateway Project, NSW
                                  •    Sydney Metro Precast, NSW                   NSW                                         • Queens Wharf – resort dev’t, Qld

  Tendering                                                                      •    Bunbury Outer Ring Road, WA              •   Bruce Highway Upgrade
                                                                                 •    Coomera Connector, QLD                       (Various), Qld
                                                                                 •    Great Eastern Highway Bypass, WA         •   North East Link, Melbourne, Vic
                                                                                 •    Groote Eylandt, NT                       •   Tonkin Highway extension, WA
                                                                                 •    Inland Rail Project, Qld, NSW, Vic       •   Warragamba Dam, NSW
                                                                                 •    New M12 Motorway, NSW                    •   Wyangala Dam Upgrade, NSW
                                                                                 •    Metronet MEL Line, WA
                                                                                 •    M6 – Kogarah, NSW
                                                                                 •    South Road Upgrade, SA
                                                                                 •    Sydney Metro (West), NSW
                                                                                 •    Tonkin Gap, WA
                                                                                 •    Warringah Freeway Upgrade, NSW
                                                                                 •    Western Sydney Airport, NSW

  Pre-                                                                           •    Rockhampton Ring Road, Qld               • Western Harbour Tunnel, NSW         • Outer Suburban Rail Loop,
                                                                                                                                 Coffs Harbour Bypass, NSW             VIC
  tendering                                                                                                                    •
                                                                                                                               • Raymond Terrace, NSW                • Brisbane Olympics
                                                                                                                                                                       Infrastructure, SE Qld

1. Boral’s major projects are generally defined as contributing >$15m of revenue to Boral
2. As at June 2021. Timing are best estimates and are subject to client schedule delays                                                                                                              38
,
A strong medium-term pipeline
While the pipeline is strong, the shifting nature                                                                                                                                          Softer concrete volumes driven by more tunnelling
of work is changing materials intensity                                                                                                                                                      Premix demand (million m3) from major transport construction1

                                                                                                                                                                                                                                                                                                               Runways
Major transport infrastructure projects1
                                                                                                                                                                                                                                                                                                               Rail
(A$m)

                                                                                                                                                                                                                                                                                                               RHS&B

                                                                                                                                                                                            Growing asphalt volumes driven by Vic demand
                                                                                                                                                                                                    Asphalt demand (million t) from major transport construction1

                                                                                                                                                                                                                                                     WA
                                                                                                                                                                                                                                                                                          VIC / SA / TAS

                                                                                                                                                                                                                                                                                          NSW / ACT
                                                                                                                                                                                                                                               QLD

1. Macromonitor Major Projects (Non Resource), VWD >$450M – May 2021 Final Forecasts                                                                                                                                                                                                                                                          39

Concrete and asphalt demand in Australia
Macromonitor forecast1 demand across all Australia construction markets

     Pre mix concrete demand1                                                                                                                                                   Asphalt demand1
     (‘000) m3                                                                                                                                                                  (‘000) tonne
                                                                                                                 Forecast volumes                                                                                                                                                                     Forecast volumes
                                                                                                                                                                                14,000
     35,000
                                                                                                                                                                                12,000
     30,000
                                                                                                                                                               WA / NT          10,000
     25,000
                                                                                                                                                                                    8,000
     20,000                                                                                                                                                    VIC / TAS / SA
     15,000                                                                                                                                                                         6,000

     10,000                                                                                                                                                    NSW / ACT            4,000

      5,000                                                                                                                                                                         2,000
                                                                                                                                                               QLD
          -                                                                                                                                                                            -
                                                                                                                       FY21F
                                                                                                                               FY22F
                                                                                                                                       FY23F
                                                                                                                                               FY24F
                                                                                                                                                       FY25F
              FY06
                     FY07
                            FY08
                                   FY09
                                          FY10
                                                 FY11
                                                        FY12
                                                               FY13
                                                                      FY14
                                                                             FY15
                                                                                    FY16
                                                                                           FY17
                                                                                                  FY18
                                                                                                         FY19
                                                                                                                FY20

                                                                                                                                                                                             FY06
                                                                                                                                                                                                    FY07
                                                                                                                                                                                                           FY08
                                                                                                                                                                                                                  FY09
                                                                                                                                                                                                                         FY10
                                                                                                                                                                                                                                FY11
                                                                                                                                                                                                                                       FY12
                                                                                                                                                                                                                                              FY13
                                                                                                                                                                                                                                                     FY14
                                                                                                                                                                                                                                                            FY15
                                                                                                                                                                                                                                                                   FY16
                                                                                                                                                                                                                                                                          FY17
                                                                                                                                                                                                                                                                                 FY18
                                                                                                                                                                                                                                                                                        FY19
                                                                                                                                                                                                                                                                                               FY20
                                                                                                                                                                                                                                                                                                      FY21F
                                                                                                                                                                                                                                                                                                              FY22F
                                                                                                                                                                                                                                                                                                                      FY23F
                                                                                                                                                                                                                                                                                                                              FY24F
                                                                                                                                                                                                                                                                                                                                      FY25F

         Macromonitor forecasts Concrete volumes to improve                                                                                                                   Macromonitor forecasts Asphalt volumes to decline in FY21 and
          slightly in FY21 and remain steady till FY25                                                                                                                          then improve in FY22 and remain at high levels to FY23/24

          •   ~1% CAGR2 in concrete volumes forecast FY21 to FY25                                                                                                               •     ~6% CAGR2 in asphalt volumes forecast FY21 to FY25

                                   Depending on phasing of projects and given Boral’s large share of major projects,
                                   Boral’s change in volumes could be different to what Macromonitor is forecasting

1.   Macromonitor Construction Materials forecast (Jul 2021 outlook)
2.   Compound annual growth rate                                                                                                                                                                                                                                                                                                              40
Financial data
                                                                                                                                                    41

Total and continuing Australian operations
The following charts provide a reconciliation of key data provided on slides 11 and 12 for continuing and discontinuing operations in Australia

       Transformation                                                                       Volumes prior year one offs

                                   Continuing operations
                                                                                                                          Continuing operations
          75               69                                                                                    24
                                                                                                26

                                   Discontinued operations
                            6                                                                                             Discontinued operations
                                                                                                                  2
       Total. ops                                                                           Total. ops

       Other prior year one offs                                                            COVID production slows and costs and PY one offs

                                   Continuing operations                                                         28     Continuing operations
           23              23                                                                   36

                                                                                                                  8     Discontinued operations

       Total. ops                                                                           Total. ops

                                                                                                                                                    42
Boral North America
 Discontinued operations                                FY21              FY20              Var %
 A$m                                                                                                                    Boral North American included as part of discontinued
                                                                                                                         operations
 Revenue                                                2,162              2,336               (7)

 EBITDA     1
                                                          419               350                 20
                                                                                                                        Sale of Boral North America for US$2.15b announced on 21
                                                                                                                         June 2021
 EBIT1                                                    209               121                 73
                                                                                                                        Transaction expected to close in 1H FY22
 US$m

 Revenue                                                1,616              1,566                3

            1
 EBITDA                                                   313               235                 33

 EBITDA1 ROS                                            19.4%             15.0%

 EBIT1                                                    156                81                 93

        1
 EBIT ROS                                                9.7%              5.2%

 Average funds employed                                 2,370              2,770

 ROFE1,2                                                 6.6%              2.9%

1. Excluding significant items
2. Divisional ROFE is EBIT before significant items on funds employed (average of opening and closing funds employed for the year)
                                                                                                                                                                                    43

USG Boral
 Discontinued operations                                FY21              FY20              Var %
 A$m (9 months)                                                                                                         Boral’s 50% interest in USG Boral included as part of
                                                                                                                         discontinued operations
 Reported result
 Equity income1,2                                         37                 25                46
                                                                                                                        Sale of 50% interest in USG Boral for US$1.015b
                                                                                                                         complete 31 March 2021
 Underlying result
                                                                                                                        Profit on sale before tax of $443 million
 Revenue                                                1,065             1,474               (28)

 EBITDA2                                                 184                217               (15)

 EBITDA2 ROS                                           17.3%              14.7%
        1
 EBIT                                                    103                107                (4)
        1
 EBIT ROS                                               9.6%               7.3%

1. Post-tax equity income from Boral‘s 50% share of USG Boral JV
2. Excluding significant items                                                                                                                                                      44
FY21 segment revenue, EBITDA and EBIT
                                                    External revenue, A$m                                            EBITDA1, A$m                                            EBIT1, A$m
Figures may not add due to rounding                      FY21                       FY20                          FY21                      FY20                          FY21       FY20

Boral Australia2                                         2,924                      3,117                          432                        472                         210         235

Corporate                                                    -                         -                           (26)                      (36)                         (28)       (38)

Total continuing operations                              2,924                      3,117                          406                        435                         181         197

Discontinued Operations3                                 2,422                     2,612                           476                        371                         263         127

 Total                                                   5,346                     5,728                           882                        807                         445         324

1. Excluding significant items
2. FY20 comparative have been restated – see Note 1 (d) of the Preliminary final report for further details                                                                                 45
3. Discontinued Operations includes Boral North America, Boral’s 50% post-tax equity accounted income from the USG Boral joint venture and Australian Building Products

Non-IFRS information

Boral Limited’s statutory results are reported under International Financial Reporting Standards. Earnings before significant items is a
non-IFRS measure reported to provide a greater understanding of the underlying business performance of the Group. Significant
items are detailed in Note 2.1 of the full year financial report and relate to amounts of income and expense that are associated with
significant business restructuring, business disposals, impairment or individual transactions.

A reconciliation of these non-IFRS measures to reported statutory profit is detailed on the next page.

The results announcement has not been subject to review or audit, however it contains disclosures which are extracted or derived
from the Full Year Financial Report for the period ended 30 June 2021. This Full Year Financial Report for the 12 months ended 30
June 2021 is prepared in accordance with the ASX Listing Rules and should be read in conjunction with any announcements to the
market made by the Group during the year.

                                                                                                                                                                                            46
Non-IFRS information (continued)
A$m
Sales revenue
                                                                            Before Significant Items     Significant items            Total   This table provides a
       Continuing operations                                                                   2,924.1                             2,924.1    reconciliation of
       Discontinuing operations                                                                2,421.6                             2,421.6
       Total                                                                                   5,345.7                  -          5,345.7    non-IFRS measures to
EBITDA
     Continuing operations                                                                      405.8              (41.2)            364.6
                                                                                                                                              reported statutory
     Discontinuing operations                                                                   476.2              398.9             875.1    profit
     Total                                                                                      882.0              357.7           1,239.7
Depreciation & Amortisation (incl acquired amortisation)
                                                                                               (224.6)
     Continuing operations                                                                                                         (224.6)
                                                                                               (212.8)
     Discontinuing operations                                                                                                      (212.8)
                                                                                               (437.4)                  -
     Total                                                                                                                         (437.4)
EBIT
     Continuing operations                                                                      181.2              (41.2)           140.0
     Discontinuing operations                                                                   263.4              398.9            662.3
     Total                                                                                      444.6              357.7            802.3
Net financing costs
     Continuing operations                                                                     (122.9)                             (122.9)
     Discontinuing operations                                                                    (7.7)                  -            (7.7)
     Total                                                                                     (130.6)                             (130.6)
Profit before tax
     Continuing operations                                                                       58.3              (41.2)            17.1
     Discontinuing operations                                                                   255.7              398.9            654.6
     Total                                                                                      314.0              357.7            671.7
Income tax benefit / (expense)
                                                                                                (10.4)              12.4               2.0
     Continuing operations
                                                                                                (52.9)              19.1            (33.8)
     Discontinuing operations
                                                                                                (63.3)              31.5            (31.8)
     Total
Profit after tax
     Continuing operations                                                                       47.9              (28.8)            19.1
     Discontinuing operations                                                                   202.8              418.0            620.8
     Total                                                                                      250.7              389.2            639.9

1.   Based on weighted average number of shares on issue of 1,219,708,646                                                                                         47

Funds employed – continuing operations
                                                    Continuing operations
                                                                                                         Actual   Funds Employed
                                                    A$m (figures may not add due to rounding)
                                                    Cash                                                  904
                                                    Receivables                                           497               497
                                                    Inventories                                           218               218
                                                    Financial assets                                       20               20
                                                    Tax assets                                            147
                                                    Other assets                                           54            54
                                                    Investments                                            15            15
                                                    Property, plant & equipment                          2,032          2,032
                                                    Intangible assets                                      72            72
                                                    Assets classified as held for sale                   3,626
                                                    Total assets                                         7,584          2,908

                                                    Payables                                              484               484
                                                    Provisions                                            236               236
                                                    Debt & lease liabilities                             1,803
                                                    Financial liabilities                                 42                42
                                                    Tax liabilities                                       45
                                                    Liabilities classified as held for sale               610
                                                    Total liabilities                                    3,220              762

                                                    Net Assets/ Funds employed as at 30 June
                                                                                                         4,364          2,146
                                                    2021

                                                    Funds employed - 30 Jun 2020                                        2,241
                                                    Average funds employed                                              2,193

                                                                                                                                                                  48
Funds employed – total operations
                                   Total operations
                                                                               Actual   Funds Employed
                                   A$m (figures may not add due to rounding)
                                   Cash                                         904
                                   Receivables                                  497          497
                                   Inventories                                  218          218
                                   Financial assets                              20          20
                                   Tax assets                                   147
                                   Other assets                                  54           54
                                   Investments                                   15           15
                                   Property, plant & equipment                 2,032        2,032
                                   Intangible assets                             72           72
                                   Assets classified as held for sale          3,626        3,626
                                   Total assets                                7,584        6,534

                                   Payables                                     484          484
                                   Provisions                                   236          236
                                   Debt & lease liabilities                    1,803
                                   Financial liabilities                         42          42
                                   Tax liabilities                               45
                                   Other liabilities                              0           0
                                   Liabilities classified as held for sale      610          610
                                   Total liabilities                           3,220        1,372

                                   Net Assets/ Funds employed as at 30 June
                                                                               4,364        5,162
                                   2021

                                   Funds employed - 30 Jun 2020                             6,918
                                   Average funds employed                                   6,040

                                                                                                                                          49

Disclaimer

The material contained in this document is a presentation of information about the Group’s activities current at the date of the
presentation, 24 August 2021. It is provided in summary form and does not purport to be complete. It should be read in conjunction with
the Group’s periodic reporting and other announcements lodged with the Australian Securities Exchange (ASX).

To the extent that this document may contain forward-looking statements, such statements are not guarantees or predictions of future
performance, and involve known and unknown risks, uncertainties and other factors, many of which are beyond our control, and which
may cause actual results to differ materially from those expressed in the statements contained in this release.

This document is not intended to be relied upon as advice to investors or potential investors and does not take into account the
investment objectives, financial situation or needs of any particular investor.

                                                                                                                                          50
You can also read