Investor presentation - March 2020 - Van Lanschot Kempen
←
→
Page content transcription
If your browser does not render page correctly, please read the page content below

Investor presentation

March 2020

Van Lanschot Kempen at a glance

Profile                                                                 Solid performance on all key financials
 •   Well capitalised, profitable wealth manager with a strong                                                     2019          2018
     specialist position in the market                                  • Net result                             €98.4m        €80.3m
 •   Strong brand names, reliable reputation, rich history              • Underlying net result                 €108.8m       €103.0m
 •   Clear choice for wealth management, targeting private,             • CET 1 ratio                                23.8%     21.1%
     institutional and corporate clients                                • Total capital ratio                        26.9%     23.2%
 •   Tailored, personal and professional service
 •   Mutually reinforcing core activities, each with its own distinct   • Client assets                         €102.0bn      €81.2bn
     culture and positioning as a niche player                          • AuM                                    €87.7bn      €67.0bn
 •   Strong track record in transformation processes and de-risking
     of the company                                                     • Loan book (excluding provisions)           €8.7bn    €8.7bn
 •   Strong capital position and balance sheet

Our wealth management strategy                                          2023 financial targets
 Supported by our strong client relationships we are a leading
 player in our relevant markets and geographies                                                              2019       Target 2023
                                                                        •   Common Equity Tier 1 ratio       23.8%      15 - 17%
 Our strategic pillars:
                                                                        •   Return on CET1                   10.5%      10 - 12%
 • Accelerate growth – organically and inorganically
 • Activate our full potential                                          •   Efficiency ratio                 75.5%      70 - 72%
 • Advance through digitalisation and advanced analytics
                                                                        •   Dividend pay-out                 57.4%      50 - 70%*
 • Adapt the workforce

* Of underlying net result attributable to shareholders
                                                                                                                                        2
Van Lanschot Kempen is a specialist,
independent wealth manager

Van Lanschot Kempen’s rich history reaches back over
   280 years

                                                                                                     Acquisition
                                                                                                     Staalbankiers’
                                                                                                     private banking
                                                                                                     activities
                                                                           Strategic
                                                                           review                    Successful
                                                                                                     placement
                                                                                                     secondary offering
                                                                                                     of 30% stake
                                                                           Launch of                                          Capital return
                              Van Lanschot          Acquisition            Evi van                   Strategy 2020            of €1.50 per
                              Switzerland           CenE Bankiers          Lanschot                  update                   share

       1737         1991          1995       1999     2004          2007     2013        2015           2016         2017       2018           2019

Cornelis van       Van Lanschot          Van Lanschot          Acquisition                                       Acquisition               Next steps wealth
                                                                                       Sale of portfolio
Lanschot founds    Belgium               listed on             Kempen & Co                                       UBS’ Dutch wealth         management
                                                                                       non-performing
Van Lanschot in                          Amsterdam stock                                                         management                strategy defined
                                                                                       real estate loans
‘s-Hertogenbosch                         exchange                                                                activities                and financial
                                                                                       Acquisition                                         targets set for
                                                                                       fiduciary activities      New name:                 2023
                                                                                       of MN UK
                                                                                                                                           Capital return of
                                                                                                                                           €1.50 per share
                                                                                                                 Capital return of
                                                                                                                 €1 per share to
                                                                                                                 shareholders

                                                                                                                                                               4
Our transformation to a specialised wealth manager

Client assets and AuM (€bn)                                      Risk-weighted assets (€bn)                        Commissions as % of operating
                                                                                                                   income (€m)
                                  102.0                                10.5                                                                           57,1
                                                                                                                                     +15.8 pps
                   +95%            14,3
                                                                                        -60%                              41,3
                                                                       6,1
          52.3
          11,4                                                                                  4.2
                                   87,7

          40,9                                                         4,4                      3,9
                                                                                                0.3
         2012                     2019                                2012                     2019                       2012                       2019
            AuM        Savings and other                        Private Banking and other      Corporate Banking      100% = 525.3               100% = 508.7

Common Equity Tier 1 ratio                                        Underlying net result (€m)                       Return on Common Equity Tier 1*
                                  23.8%                                                        108,8                                                 10.5%

                 +12.8 pps
                                                                                                                                  +23.2 pps
                                                                                +97.7
         11.0%

                                                                       11,1
                                                                                                                         -12.7%
         2012                     2019                                2012                     2019                       2012                       2019

* Based on underlying net result attributable to shareholders

                                                                                                                                                                5
As a wealth manager Van Lanschot Kempen builds on
the experience of its core activities

Private Banking                        Evi                                     Asset Management                 Merchant Banking
‒ Discretionary asset                  ‒ Online wealth management              ‒ Comprehensive fiduciary        ‒ Equities research and
  management, investment                 services for the mass affluent          wealth management                trading, corporate
  advice, financial planning,            and Millennials                         services                         finance and debt advisory
  savings and deposits,                ‒ Online wealth management              ‒ Niche investment strategies      services
  structured products and                solutions, discretionary asset          (high div. equities, small-    ‒ Focus on European
  lending                                management, savings and                 caps, real estate, credits,      corporates and worldwide
‒ Servicing entrepreneurs,               pension solutions                       infrastructure, government       institutional clients; sectors
  family businesses, high net-         ‒ AuM client base c. 17,000               bonds, etc.)                     covered are real estate, life
  worth individuals, business          ‒ AuM: €1bn                             ‒ Focus on European clients;       sciences & healthcare,
  professionals and executives,        ‒ Savings: €0.5bn                         institutional, wholesale         financial institutions &
  healthcare professionals,            ‒ 23 FTEs                                 distribution, family offices     fintech, infrastructure,
  foundations and associations         ‒ Focus on NL and BE                      and endowments                   maritime & offshore, as well
‒ AuM: €24.7bn                                                                 ‒ AuM: €73.1bn*, AuMG:             as our local alpha coverage
‒ Savings and deposits:                                                          €3.1bn                         ‒ 127 FTEs
  €8.9bn, loans: €8.1bn                                                        ‒ 264 FTEs                       ‒ Offices in NL, BE, UK, US
‒ 655 FTEs                                                                     ‒ Offices in NL, UK, FR
‒ Offices in NL, BE, CH

* As of 31 December 2019, including €11.1bn of AuM managed for Van Lanschot Private Banking and Evi
                                                                                                                                                   6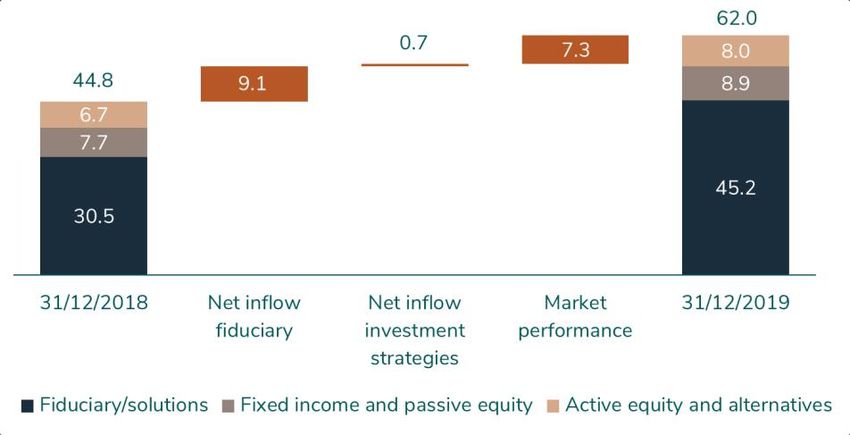
We are a leading wealth manager in our markets

Focused wealth • We’re a well-capitalised, profitable wealth manager with a strong position in the market
management     • We believe that our knowledge and experience, personal, client-focused approach, unique combination
                 of activities and track record set us apart from the competition
strategy       • We’re convinced our strategy offers ample growth opportunities

                   • A leading wealth manager in the Benelux region
Leading player     • The number one online wealth management alternative for the mass affluent in selected markets
in our relevant    • A prominent, active investment manager that delivers alpha in illiquid markets, as well as in income-
markets              generating strategies and ESG in Europe
                   • The leading fiduciary manager in the Netherlands, and a challenger in UK fiduciary market
                   • The preferred trusted adviser in selected merchant banking niches across Europe

From               • We’re a conviction-based, active investor, focusing on the long term
                   • We’re convinced we can achieve significant social and environmental impact by advising our clients in
responsible to       making sustainable investment decisions
sustainable        • We aim to increase our positive contribution and visibility
investing

                   •   CET 1 ratio:        15-17%
2023 financial     •   RoCET 1:            10-12%
targets            •   Dividend policy:    50-70% of underlying net result attributable to shareholders
                   •   Efficiency ratio:   70-72%

                                                                                                                             7
We have defined four strategic pillars that enable us to
deliver on our ambitions

• Pursue a solutions-led                                                      • Create solutions based on
  approach building on clients’      Accelerate          Advance through        superior insights into clients’
  needs                              growth-             digitalisation and     needs & market developments
• Consider acquisitions in           organically         analytics            • Enhance client experience
  existing and contiguous            and                                      • Streamline products, processes
  markets                            inorganically                              and systems

• Offer clients the full potential                                            • Empower our people to
  of services and products from                                                 embrace technology and adopt
  our group and open                                                            a more data-driven way of
  architecture platform              Activate our full        Adapt the         working and decision-making
• Benefit from knowledge             potential                workforce       • Embrace an agile approach with
  sharing, make optimum use of                                                  multidisciplinary teams
  resources and reduce overlap                                                • Hire new talent to bring in
                                                                                different skills and capabilities

                                                                                                                    8
In 2019, we have made good progress in delivering
on our ambitions

 Accelerate growth – organically and inorganically            Advance through digitalisation and analytics

• Client assets grew 26% to €102.0bn                         • Outsourced payment services to Fidor: new payments
• Net inflows of AuM at Private Banking and at Asset           platform and payments app launched
  Management                                                 • Laid the foundation for a modern, cloud-based
• Ongoing search for acquisitions to accelerate our growth     infrastructure for advanced analytics to enable faster
                                                               development

 Activate our full potential                                  Adapt the workforce

• Co-creation between Private Banking and Asset              • Transition to integrated HR practices and modernisation of
  Management allows for swift and tailored product             employment conditions
  development (e.g. European Private Equity Fund and         • Implementation of agile approach with multidisciplinary
  Global Impact Pool)                                          set-up of several teams
• Wealth management proposition for Evi’s mass affluents     • Encouraging development and training by launching a
  and closer collaboration between Evi and Private Banking     revamped learning management system to bring different
• Merchant Banking and Private Banking working together        skills and capabilities into our organisation
  on successful transactions for clients

                                                                                                                            9
From responsible to sustainable wealth manager –
2019 highlights

     98% of fund managers             AuM at Private Banking
     on the approved list             invested in sustainable or
     are scored on their              impact investing solutions
                                                                     Increased range of
     overall sustainability           grew by 55% to more than     sustainable and impact
     profile                          €2 billion                          solutions

                                                                   • Global Impact Pool showed
                                                                     significant growth in 2019,
                                      From 2023, we’ll
     We engaged with 84                                              passing the €100 million mark
                                      actively offer our
     companies in which               Private Banking clients
     our funds invest                 only sustainable             • Sustainable solutions in
                                      investment solutions           various asset classes

                                                                   • Duurzaam+ proposition

                                                                   • Launch of Groenhypotheek
     We’ve signed up to a             In 2019, over one-third of
     financial sector initiative to
                                      our new clients invested
     report on the climate
                                      in our Duurzaam+
     impact of our loan portfolio
                                      proposition
     and investments

                                                                                                     10
Our positioning in a changing environment
Key themes Our positioning
• Focus on wealth management, reducing dependence on
interest income
Low interest rates impact our
• Keep Private Banking loan portfolio stable
interest income
• Charge negative interest rates for larger savings balances (above €1
million from 1 April)
• Provide integrated wealth management solutions for private,
institutional and corporate clients
Market volatility and flat yield • Swift, tailored alternative product development
curve impact our clients
• Fulfil our role in combating money laundering and financial crime and
undertake continuous efforts to further optimise our control arrangements
Increased focus on compliance • Have an advanced monitoring system and team of experts in place
• Make a clear choice for wealth management with capital-light balance sheet
Pressure on sustainability of • Benefit from focused strategy and client base to allow for swift
business model for traditional implementation of new technology
banking
11Annual results 2019: net profit over €98 million
Good overall performance

        Net result €98.4m (2018: €80.3m)
                                           Commission income €290.4m (-1%)
         Underlying net result €108.8m
                                             Interest income €175.3m (0%)
                (2018: €103.0m)

              Operating expenses                 Efficiency ratio 75.5%
               €384.1m (-3%)                         (2018: 79.4%)

         Client assets €102.0bn (+26%)
                                                AuM net inflow €9.9bn
              AuM €87.7bn (+31%)

              Strong capital ratios
                                            Dividend per share stable at €1.45
            CET 1 ratio rises to 23.8%

                                                                                 13
2019 highlights
Sale AIO II Fourth closing of Successfully Infrastructure for
and VLC & European Private completed 37 advanced
Partners Equity Fund at Corporate Finance analytics
€193 million and ECM transactions
2019 2020
New payments Niche strategies Over €2.0 billion Special capital
platform and showed strong in sustainable return of €1.50
payments app net inflow of AuM at Private per share
launched €0.7 billion Banking
14Overview net result
€m 2019 2018 % chang e
Commission 290.4 293.2 -1%
Interest 175.3 175.6 0%
Other income 43.1 30.3 42%
Income fr om op er ating activities 508.7 499.2 2%
Operating expenses -384.1 -396.4 -3%
Gr oss r esult 124.7 102.8 21%
Loan loss provision 12.1 12.7 -5%
Other impairments -34.9 0.9
Operating profit before tax of non-strategic investments 37.8 17.8
Op er ating p r ofit b efor e sp ecial items and tax 139.6 134.3 4%
Strategic investment programme -11.1 -22.0 -50%
Amortisation of intangible assets arising from acquisitions -6.2 -8.3 -25%
Restructuring charges -2.8 -8.3 -67%
Op er ating p r ofit b efor e tax 119.5 95.8 25%
Income tax -21.1 -15.5 37%
N et p r ofit 98.4 80.3 23%
Und er lying net r esult* 108.8 103.0 6%
Efficiency ratio (%) 75.5% 79.4%
* Underlying net result excludes costs associated with the strategic investment programme and restructuring charges
15Net result considerably up to €98.4m
Key drivers of net result
€m
incl. book profit
VLC & Partners
• Impairment of goodwill relates to the write-down of goodwill involved in the acquisition of Kempen & Co in 2007
and more specifically to its Merchant Banking activities
• Ignoring exceptional items, impact of sale of our stakes and impairment of goodwill, net profit rose by 22%
16Cost-saving measures lead to operating expenses
below the 2019 target
Operating expenses
€m
• Cost level well below 2019 cost target of €390m
• Focus on costs reflected mainly in lower consultancy fees and marketing costs
• In 2019 total headcount decreased by approximately 60, partly as a result of the strategic investment programme
• In 2020, operating expenses expected to increase due to new pension agreement, and harmonisation and update
of employment conditions
17Private Banking client assets rose 13% to €34.5bn
Net result Private Banking* Private Banking client assets*
€m € bn
• Net result amounted to €44.0m (2018: €38.1m)
• Strategic investment programme successfully completed in 2019
• Client assets rose to €34.5bn, mainly due to positive market performance and net inflow of savings and deposits
• Inflow in AuM positive for the third consecutive year (2018: €0.5m)
• AuM breaks down into 55% discretionary management and 45% non-discretionary management
* As of 2019 Corporate Banking activities are integrated into our Private Banking segment. Comparative figures have been adjusted accordingly
18Succesful completion of strategic investment
programme in 2019
Multichannel Omnichannel
Discretionary management app Introduced New website and online portal
New payments platform and
merged into investment app; Vermogenshorizon in 2018, for clients in 2018,
payments app in 2019
functionality further expanded in integrated investment intake in functionality consistently
2019 2019 expanded in 2019
Budget c. €60m
2016 2019
Outsourced mortgage Improved and new Digital alerting and client
servicing to Stater in workflows, currently covering communication tools for Next steps in 2020
2017 >80% of client processes advisers and bankers
• Rollout of secure (video)
chat and document
sharing
• Continuous expansion
and improvement of
digital functionalities
19Net inflow at Asset Management amounted to €9.8bn
Net result Asset Management AuM Asset Management
€m € bn
• Net result rose to €15.2m (2018: €11.9m) thanks to higher commission income, lower operating expenses and
lower restructuring charges
• Net inflow driven by fiduciary mandates, mainly St. Pensioenfonds PostNL (€9.0bn)
• Inflow (€0.7bn) in investment strategies mainly realised at Global Small-cap Fund and Credit strategies, partly
offset by outflow from European Small cap Fund.
20Private Banking’s AuM margin fairly stable, decline at
Asset Management due to mix effect
AuM margin – Private Banking AuM margin – Asset Management
bps bps
Annualised
• Private Banking’s AuM margin relatively stable in 2019; higher margin in 2017 was recurring
due to higher transaction provisions and UBS portfolio acquisition in H2 2017 management fee
• Margin development partly reflects AuM composition rose 15% in 2019
• Inflow at Asset Management mainly in fiduciary management (around €30m)
21Evi’s net result improved, client assets relatively stable
Net result Evi Evi’s AuM
€m €m
• Net result amounted to -€2.1m (2018: -€6.7m)
• Operating expenses fell by €5.0m compared with 2018, due to lower marketing and IT costs
• AuM grew due to positive market performance; total client assets add up to €1,540m
• Evi announced in January 2020 that a.s.r. clients with investment accounts are given the opportunity to switch to
Evi at no cost
22Solid results at Merchant Banking
Net result Merchant Banking Commission
€m €m
• Solid results in 2019, after a very strong 2018
• Net result came in at €7.5m (2018: €10.5m), partly due to the €2.7m impact of model adjustments
• Last year, a total 37 Corporate Finance and ECM deals were closed, of which 30 were outside the Netherlands,
including three IPOs in the US
23Margin pressure due to low interest rate environment
Interest Interest margin (12-mth moving average)*
€m %
• Margin pressure as a result of low interest rate climate and a smaller Corporate Banking loan portfolio
• Nevertheless, interest income and charges were almost equal to 2018, partly due to a one-off interest claim
related to DSB Bank NV***
• Overall loan portfolio has grown, mortgage portfolio shows relatively stable margins
• Charge negative interest rates for larger savings balances (above €1 million from 1 April)
* The interest and clean interest margin are calculated excluding the one-off interest claim to be received from DSB NV
** The clean interest margin equals the gross interest margin adjusted for interest equalisation and interest-related derivatives amortisation
*** DSB Bank BV was a Dutch bank that failed in 2009. All Dutch banks contributed to the deposit guarantee scheme to indemnify DSB savers
24Income from securities and associates increases mainly
due to book profits
Income from securities and associates
€m
€m Book value Income
31/12/2019 2019
VLP (minority interests) 41.3 18.1
Bolster Investments Coöperatief U.A. 19.3 1.7
Co-investments in own products 119.4 14.3
Other equity investments 5.1 -0.7
VLC & Partners 0.0 17.1
Total 185.1 50.5
• Income from securities and associates relates to our minority equity investments and stakes in our own
investment funds
• In 2019, a capital gain was realised on the sale of VLC & Partners (€17.1m) and Marfo Food Group (€6.5m)
• Valuation gains up in 2019 due to positive market conditions compared with 2018
25Lower result on financial transactions
Results on investment portfolio Other results Total result on financial transactions
€m €m €m
• Result on financial transactions decreased by €6.6m to -€7.4m
• Fewer sales and the current investment climate led to a lower result on the investment portfolio
• Other results strongly negative due to:
‒ A negative result on hedges, mainly due to adverse results on futures (linked to positive gains on the
management book) and on the hedge of our Kempen Dutch Inflation Fund
‒ A correction as a result of a model adjustment
‒ Interest charges on medium-term notes
26Loan portfolio relatively stable, net increase in Private
Banking’s mortgage portfolio
€m Lo an Lo an % c hange Impaired P ro vis io n Impaired Co verage
po rtfo lio po rtfo lio lo ans ratio ratio
31/12/2019 31/12/2018
Mortgages 5,885 5,756 2% 60 6 1.0% 10%
Other loans 1,906 1,793 6% 73 36 3.8% 49%
P rivate Banking lo ans 7, 791 7, 550 3% 133 42 1. 7% 31%
Co rpo rate Banking lo ans 318 523 -39% 101 13 31. 6% 13%
Mortgages distributed by third parties 553 602 -8% 0 0 0.1% 0%
To tal lo an po rtfo lio 8, 662 8, 674 0% 234 54 2. 7% 23%
ECL stages 1 and 2 9
To tal 8, 662 8, 674 0% 64
• Other loans up by 6%, mainly driven by an increase in Lombard loans and current accounts, including loan
provided to the Reggeborgh family office for the VolkerWessels transaction
• Total impaired ratio improved to 2.7% from 3.8% due to improving credit quality, in addition the write-off of
residual debts with no prospect of recovery which have been fully provisioned
• After a successful run-off, Corporate Banking activities were integrated into Private Banking as of 2019
27Net release of loan loss provisions thanks to positive
economic conditions
Loan portfolio (excluding provisions) Additions to loan loss provisions
at 31/12/2019 100% = €8.7bn €m
- 22 bps* - 27 bps* - 27 bps*
• Corporate Banking loans came down from €0.5bn to €0.3bn (RWA Corporate Banking loans: €0.3bn)
• Release of loan loss provisions, mainly due to the continued positive economic environment in the Netherlands
* Loan loss provision / average total RWA
28Strong capital position
Common Equity Tier 1 ratio*
%
• CET 1 ratio increased strongly from 21.1% to 23.8%, with a 2023 target of 15–17%
• We expect an increase of around 15% in total RWA due to DNB’s announced minimum risk-weight floor on Dutch
mortgages. This absorbs our previously disclosed impact of Basel IV
* Some amounts differ from previously published reports, reflecting changes that result from the accounting changes related to provisions for pensions
29Delivering on our promise
Capital return and dividend
€m
• Special capital return in December of €1.50 per share
• Total shareholder return since 2013: 2.1x
• In future, we will continue to optimise our capital base while leaving room for possible acquisitions. If possible, we
will also consider paying out excess capital to shareholders, subject to approval by the regulator
30Overview of 2023 financial group targets
Common Equity Tier 1 ratio* Dividend pay-out ratio**
% %
50-70%
15-17%
23.8%
18.6% 20.3% 21.1% 64%
16.3% 56% 61% 57%
36%
2015 2016 2017 2018 2019 2023 2015 2016 2017 2018 2019
Efficiency ratio Return on Common Equity Tier 1**
% %
70-72%
10-12%
79.6% 76.2% 79.4% 75.5%
74.4%
10.4% 9.8% 10.5%
7.3%
4.9%
2015 2016 2017 2018 2019 2023 2015 2016 2017 2018 2019 2023
* As of 2016 fully loaded; 2015 phase-in
** Based on underlying net result attributable to shareholders
31Appendix
Key figures 2019 by segment

€m                                                                     Private             Evi           Asset     Merchant    Other      Total
                                                                       Banking                        Management   Banking
Commission income                                                           130.1              5.1         101.7        52.2        1.2     290.4
Interest income                                                             154.0              3.2           0.1        -0.1       18.1     175.3
Other income                                                                  1.2                 -         -0.7         2.6       40.0      43.1
Income from operating activities                                           285.3               8.2        101.1        54.7       59.3     508.7
Operating expenses                                                         -219.1            -11.1         -79.6       -44.4      -29.8    -384.1
Gross result                                                                66.2              -2.9         21.5        10.4       29.5     124.7
Impairments                                                                  11.2              -             -           -        -34.0     -22.9
Operating profit before tax of non-strategic investments                      -                -             -           -         37.8      37.8
Operating profit before one-off charges and tax                             77.4              -2.9         21.5        10.4       33.2     139.6
Strategic investment programme                                              -11.1              -             -           -          -       -11.1
Amortisation of intangible assets arising from acquisitions                  -4.7              -            -0.8         -         -0.8      -6.2
Restructuring charges                                                        -2.3              -             0.1         -         -0.6      -2.8
Operating profit before tax                                                 59.3              -2.9         20.8        10.4       31.9     119.5
Income tax                                                                  -15.3              0.8          -5.6        -2.9        1.9     -21.1
Net profit                                                                  44.0              -2.1         15.2          7.5      33.8      98.4
Underlying net result                                                       54.0              -2.1         15.1          7.5      34.3     108.8

FTE 2019                                                                      655                23         264         127        491      1,560

As of 2019, Corporate Banking activities are integrated into our Private Banking segment

                                                                                                                                                    33
Financial and non-financial KPIs
Theme KPI Target 2019 Score 2019 Score 2018 • This set of KPIs demonstrates our belief in
Financial and risk
1. CET 1 ratio 15-17% 23.8% 21.1%
value creation for the long term. It reflects both
management
2. Return on equity (CET 1) 10-12% 10.5% 9.8%
the interests of our stakeholders and our
70-72% 75.5% 79.4%
3. Efficiency ratio
ambitions as a wealth manager
Ethics and 4. Percentage of employees that feel the > industry
77% n/a* • In 2019 the KPI set is updated based on our
integrity responsibility to act and behave ethically average: 81%
new materiality matrix and as of 2020 the new
5. Net Promotor Score (NPS):
KPI set will be reported
a. Private Banking 10 23 2
Client relations
b. Evi 10 10 -20
c. Asset Management 20 31 44**
6. Private Banking: AuM invested in > last year 2019: €2,046m 2018: €1,318m
sustainable and/or impact investment +€728m +€180m
wealth management solutions
7. Engaging with companies in which our 80-100 84 91
funds invest engagements engagements engagements
8. Asset Management: increase in the > last year 2019: 98% 2018: 37%
Responsibility percentage of (internal and external) fund
and sustainability managers on our approved list that are
scored on their overall sustainability profile
9. Decrease in carbon emissions:
-2.5%/FTE per -5.6% -8.1%
a. Direct emissions of our own organisation
year
b. Indirect emissions via our balance sheet CO2/EUR < last -2.0% -11.3%***
(mortgage portfolio) year
10. Employee engagement score > 80% 82% 81%**
11a. Employer Net Promotor Score
> 10 n/a n/a n/a
(eNPS)****
Employees 11b. Employees that recommend VLK as a > 80%
83% 82%**
good place to work
12. Gender balance in management > 30% female 21% female 20% female
positions and 79 % male 80% male
> 30% male * An employee engagement survey is conducted once every two
13. Private Banking: 3-year relative > benchmark -0.4% -0.1% years. In 2017 these questions were not included
performance of discretionary management ** Measured once every two years, score for 2017
mandates *** A method of data cleaning has been applied retroactively to
Preservation and ensure that figures are comparable. This led to an adjustment of the
14. Evi: 3-year relative performance of > benchmark -0.9% -0.4%
creation of 2018 score
discretionary management mandates
wealth **** In 2019, no official eNPS was measured. Instead, the employee
15. Asset Management: average > 3.5 3.9 4.0
Morningstar rating of investment strategies
engagement survey included a comparable question. Please refer to
(institutional share class)
KPI 11b
34High scores on external ESG ratings
1st Sustainability certificates
in our peer group of on responsible investment policy
medium-sized banks and balance sheet screening
10th B rating
Transparantiebenchmark: place in league table of assessed by Carbon Disclosure
250 entrants Project
C+ rating A and A+ score
top 5 out of 80 financials For Kempen’s responsible
and asset managers investment policy and process
35Balance sheet shows strong capital and funding
position
Balance sheet 31 December 2019
€ bn, balance sheet total = €14.3bn
0.1 Due to banks
Cash and cash equivalents
1,7
and balances at banks
Financial instruments 3,1
9,5 Savings and deposits
Loans and advances 8,6
2,6 Debt securities
0,7 Other
Other 0,9 1,3 Equity
Assets Equity and liabilities
36Executive Board
Personal details of members of the Executive Board
Karl Guha Constant Korthout Arjan Huisman Richard Bruens Leni Boeren Leonne van der Sar
(1964) (1962) (1971) (1967) (1963) (1969)
Chairman CFO/CRO COO Private Banking Asset Management Merchant Banking
Appointed Appointed Appointed Appointed Appointed Appointed
2 January 2013 27 October 2010 6 May 2010 15 May 2014 5 February 2018 1 August 2017
Background Background Background Background Background Background
1989 – ABN AMRO: 1985 – ABN AMRO: 1995 – Various consulting 1991 – ABN AMRO: various 1983 - Paribas: Account 1994 – ABN AMRO: Various
positions in Structured management trainee, senior positions within BCG managerial positions in the Manager positions in Investment
1984 - Rabobank: Senior Banking
Finance, Treasury, Capital account manager corporate Amsterdam and Boston Global Markets division,
Management, Investor clients offices, with a strong focus Managing Director of Investment Adviser, Head of 1998 – ABN AMRO
Relations, Risk Management 1990 – KPMG Management on financial services Investor Relations Account Management Rothschild: Various positions
and Asset & Liability Consultant 2004 – Partner, Managing 2007 – Renaissance Capital: 1992 - Robeco Group: Head of in Investment Banking and
Investment Services Strategy, Equity Capital Markets
Management 1992 – Robeco: Group Director and Head of BCG Member of group managing
2009 – UniCredit Controller, CFO and member Prague office Board Head of Marketing and Product 2004 – ABN AMRO
Management Rothschild: Managing Director
Banking Group: CRO and of the executive board of 2008 – Partner and 2010 – ABN AMRO: Global
member of the executive Weiss, Peck & Greer in New Managing Director of BCG Head Products & Solutions 1997 – Amsterdam Exchanges: and Head of ABN AMRO
Member board of directors Rothschild Netherlands office
management committee, York, and Corporate Amsterdam office and Global Head Private
and Member of supervisory Development director Wealth Management 2000 – Euronext: Member 2006 – ABN AMRO: Executive
boards of Bank Austria, HVB 2002 – Robeco: CFO, executive committee Director Corporate
in Germany and Zao Bank in including Risk Management, 2005 – Robeco Group: Development
Russia Treasury and Corporate Member, Vice-Chair and Chair 2008 – Several interim
Development of the group management management assignments in
board and Chair/member of the the financial sector
boards of a number of Robeco 2014 – Van Lanschot Kempen:
Groep subsidiairies Head of Strategy & Corporate
Development
37Supervisory Board
Personal details of members of the Supervisory Board*
Willy Duron Manfred Schepers Jeanine Helthuis Bernadette Langius Lex van Overmeire Maarten Muller Frans Blom
(1945) (1960) (1962) (1960) (1956) (1954) (1962)
Chairman Vice-Chairman
Chairman board of Member of the Managing Director PC Member of the Chairman of the Audit Chairman at Stichting Advisor Boston
directors Windvision supervisory board of Uitvaart Supervisory Board of Advisory Committee Continuïteit TomTom Consulting Group The
NWB Bank IBM CIZ Netherlands
Previous positions Previous positions Previous positions Previous positions Previous positions Previous positions Previous positions
held held held held held held held
Chairman of Vice President & Chair of Monuta Member of executive Audit partner EY Partner Allen & Overy Chairman Boston
KBC Group CFO European Bank Holding/Monuta board VU Amsterdam Accountants LLP LLP Consulting Group The
for Reconstruction Verzekeringen CEO Commercial Netherlands
and Development Member board of Banking NL & CEO
directors Fortis Bank Private Banking NL at
Nederland ABN AMRO
* More information about the Supervisory Board members can be found on vanlanschotkempen.com/management-supervision
38Van Lanschot Kempen shares
Development of share price and trading volume Movements in Van Lanschot Kempen's share price
compared with industry indices
May-17: Ex- Dec-17: Ex-date Jun-18: Ex- Jun-19: Ex-
dividend €1.20 capital return €1 dividend €1.45 dividend €1.45 250%
€30 70.000
60.000
€25 200%
50.000
€20
150%
40.000
€15
30.000 100%
€10
20.000
50%
€5
10.000
Jun-16: secondary Sep-17: ABB of a Dec-18: Ex- Dec-19: Ex-
offering of a 30% 9.74% stake at date capital date capital
stake at €16 €25.10 return €1.50 return €1.50
€0 - 0%
Average daily trading volume (year) Van Lanschot Kempen share price MSCI World Banks Stoxx Europe 600 Banks
Stoxx Europe 600 Financial services Van Lanschot Kempen
39Diversified shareholder base
Van Lanschot Kempen’s shareholder base
at 11/03/2020
APG Asset Management
9.9% LDDM Holding
Janus Henderson Group
9.7%
Reggeborgh Invest
43.0% 5.6% FMR
Management & employees
5.0%
NN Group
5.0% T Rowe Price
CRUX Asset Management
3.7% Investec Asset Management
3.2% Invesco
2.9% 3.1%
3.0% Wellington Management Group
3.0% 3.0%
Other
Pursuant to Chapter 5.3 of the Dutch Financial Supervision Act, the disclosures in the chart have been entered in the Register
of Substantial Holdings as maintained by the Dutch Authority for the Financial Markets. The percentages reflect the number of
shares or depositary receipts on the register on the disclosure dates and our current number of outstanding shares.
40Disclaimer
Disclaimer and cautionary note on forward-looking statements
This document may contain forward-looking statements on future events and developments. These forward-looking statements are
based on the current insights, information and assumptions of Van Lanschot Kempen’s management about known and unknown
risks, developments and uncertainties. Forward-looking statements do not relate strictly to historical or current facts and are subject
to such risks, developments and uncertainties which by their very nature fall outside the control of Van Lanschot Kempen and its
management.
Actual results, performances and circumstances may differ considerably from these forward-looking statements as a result of risks,
developments and uncertainties relating to, but not limited to, (a) estimates of income growth, (b) costs, (c) the macroeconomic and
business climate, (d) political and market trends, (e) interest rates and currency exchange rates, (f) behaviour of clients, competitors,
investors and counterparties, (g) the implementation of Van Lanschot Kempen’s strategy, (h) actions taken by supervisory and
regulatory authorities and private entities, (i) changes in law and taxation, (j) changes in ownership that could affect the future
availability of capital, and (k) changes in credit ratings.
Van Lanschot Kempen cautions that forward-looking statements are only valid on the specific dates on which they are expressed,
and accepts no responsibility or obligation to revise or update any information, whether as a result of new information or for any
other reason.
Van Lanschot Kempen’s annual accounts are prepared in accordance with International Financial Reporting Standards as adopted by
the European Union (“IFRS-EU”). In preparing the financial information in this document, except as described otherwise, the same
accounting principles are applied as in the 2018 Van Lanschot Kempen consolidated annual accounts.
The financial data in this document have not been audited, unless specifically stated otherwise. Small differences in tables may be the
result of rounding.
This document does not constitute an offer or solicitation for the sale, purchase or acquisition in any other way or subscription to any
financial instrument and is not a recommendation to perform or refrain from performing any action.
41You can also read