Investor Briefing For year ended 31 March 2014 - Centum Investment
←
→
Page content transcription
If your browser does not render page correctly, please read the page content below
Investor Briefing For year ended 31 March 2014

Agenda

             1•   FY2009-14 Strategy (Centum 2.0) Update

             2•   Business Unit Review

             3•   Financial Performance

             4•   FY2015-19 Strategy (Centum 3.0)

             5•   Q&A

2
Our Mission

    To create real tangible wealth by providing the channel
    through which investors access and build extraordinary
                      enterprises in Africa

3
We are a channel providing investors with access to a portfolio of
    otherwise inaccessible, quality, diversified investments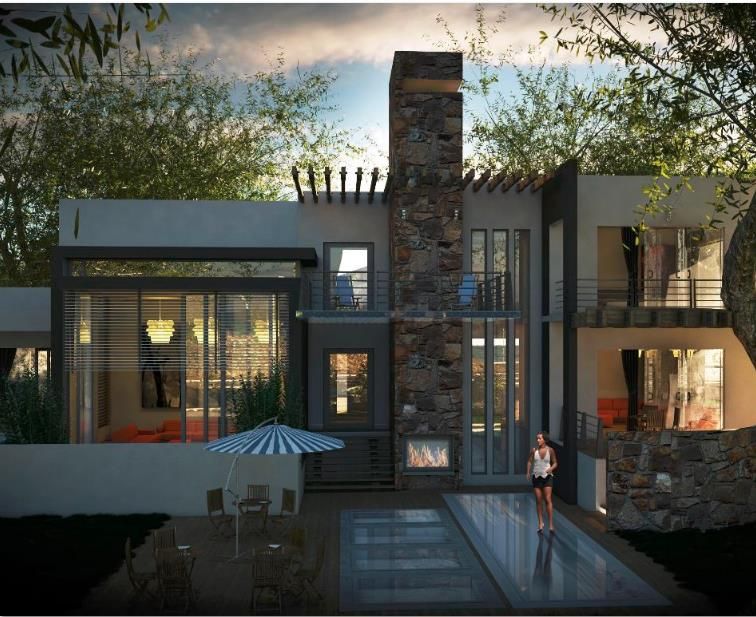
Our Business
    We invest across three asset classes

                                                Centum Investment Company
                                                        Kes. 29.4Bn

         Private Equity                              Real Estate & Infrastructure         Asset Management
        Kes. 14.1 Bn (49%)                                Kes. 10.3 Bn (17%)               Kes. 5.0 Bn (34%)

                                                                         Third party funds –         Third party funds -
                                                                         Centum Asset Mgrs                Genesis
                                                                             Kes. 1.2Bn                 Kes. 116.3Bn

As at 31 March 2014
Total AUM Kes 146 Bn (including third party funds)
5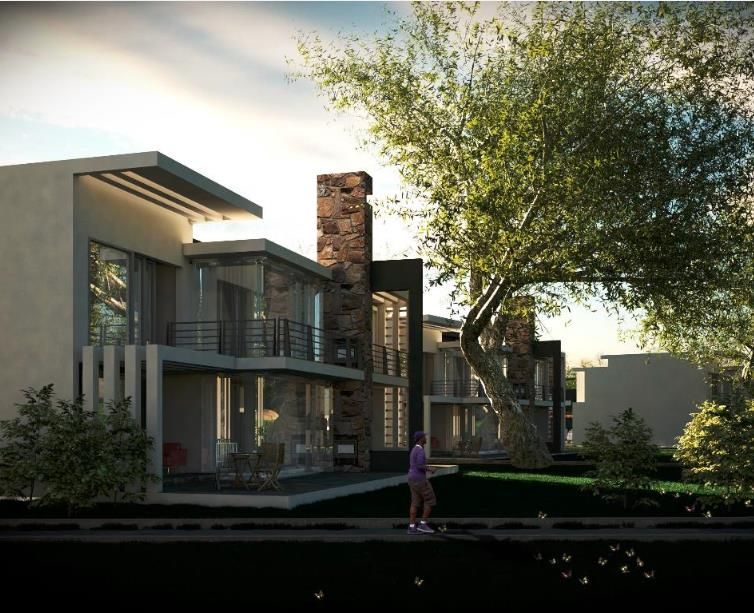
Strategy: we delivered to promise
2009-2014 Strategic themes 2014 Position
1 Grown market capitalization by KES 18.7 Bn
PERFORMANCE Constantly deliver market representing 334% growth over the period.
beating returns NAV return outperformed the NSE by 19% over
the period
2
Diversify by geography and 17% of the portfolio is outside Kenya
DIVERSIFICATION 17% of AUM in listed equities
asset class
3
Grow AUM to Kshs 30Bn by AUM at Kshs 147.2Bn
GROWTH 2014 Centum Portfolio value at Kshs 29Bn
4
• Centum has consistently delivered to promise
Deliver through people through a highly qualified team.
BRAND
• Centum has continued to attract and retain
top talent within the organization.
5 Costs closed at 1.5% in 2014.
Maintain costs below 2.5% of
COSTS Costs maintained below 2.3% of AUM over the
AUM
period
6
Performance against strategy
               Kes. M                            2010     2011     2012     2013      2014
               AUM                               8,972   10,756   17,551   22,891    30,121
               Centum Portfolio                  8,972    9,965   14,859   18,257    22,926
               3rd Party funds                       -     791     2,692    4,634     7,195
    Strategy
               NAV (Kes m)                       6,972    8,756   11,430   15,399    20,640
               Total Return (Kes. m)              926     1,784    2,675    3,969     5,240
               Total return (%)                   13%      20%      23%      26%       25%

               Kes. M                   2009     2010     2011     2012     2013      2014
               AUM                      5,930    9,015   14,463   15,994   21,700   147,190
               Centum Portfolio         5,930    9,015   14,463   14,694   19,307    29,356
               3rd Party Funds               -       -        -    1,300    2,393   117,834
    Actual
               NAV(Kes. m)              5,859    9,157   12,552   13,675   16,137    22,936
               Total Return (Kes. m)   (2,980)   3,297    3,418    1,133    2,451     6,800
               Total return (%)         (37%)     56%      37%       9%      18%       42%

7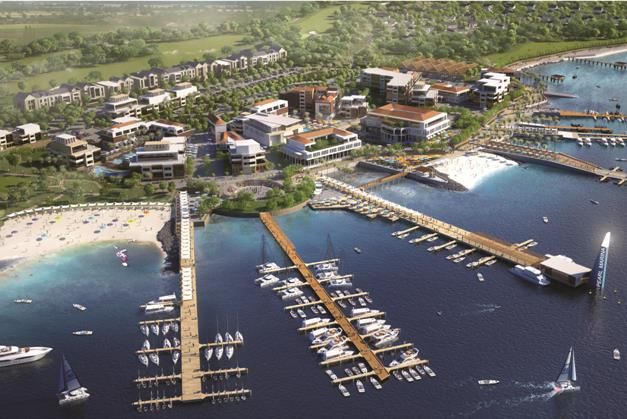
Performance
    288% growth in NAV, 19% outperformance to NSE

    19% average outperformance against the NSE over        288% growth in NAV. Share price currently trading
                        5 years                                       at a 17% premium to NAV

               Centum                                                                                     40.00
                           NSE 20        Centum     40                Share price     NAV
      Year      NAV
                           Return    Outperformance
               Return                                                                                      34.47
                                                      30
      2010       56%         43%           13%
      2011       37%         -4%           41%        20
      2012        9%        -13%           22%               8.9
      2013       19%         44%          -26%        10
                                                               8.47
      2014       42%         2%            40%
                                                       0
Geometric                                                    2009     2010   2011   2012    2013   2014   Jun-14
                 31%        12%            19%
 Average
Aggregated
                 294%       75%           219%
  return

8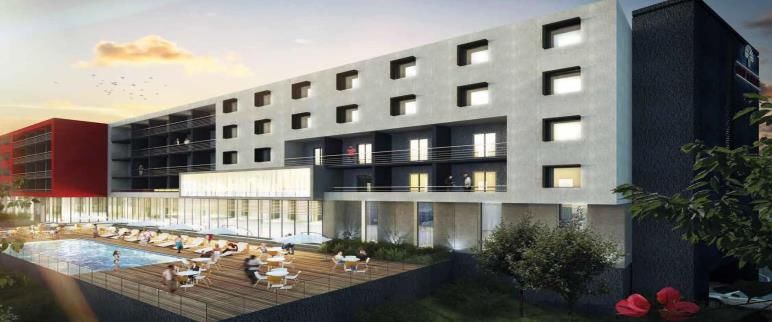
Performance
 334% growth in market capitalization as at 31 March 2014
 Every Shilling invested in Centum shares in 2009 was worth Kshs 4.34 on 31 March 2014

           30
                                Book Value         Mkt Cap                         26.6
                                                                    24.29
           25
                                                                                          22.9
                                                                        22.9
           20

           15

           10
                  5.9                 Mkt capitalization increase by KES 18.7 Bn
             5
                  5.6
             0
                  2009   2010      2011        2012          2013     2014          Jun-14
Mkt Cap (Bn)       5.6   8.6        13.0       9.8           13.2     24.3
Book Value (Bn)    5.9   9.2        12.6       13.7          16.1     22.9

 9
Diversification
17% of the portfolio is outside Kenya. PE & REI account for 83% of the portfolio
                Geographical Diversification                    Geographical Diversification across Asset Classes
                                              19       19
                                                                          AUMs outside Kenya (31 March 2014)
                              14
                                                                          Kenya        East Africa    Other SSA countries

                       7                                                       QPE                         REI

       1
                                                                        23%                          26%
     2010            2011    2012         2013        2014                           37%

                  Asset Class Diversification
                                                                                                                 74%
            Private Equity      Real Estate           QPE
                                                                         40%
                                                                                            PE
                                                                                       4%
                     20.0%    27.0%           26.0%
     41.0%                                              34.0%
                     28.0%    15.0%           19.0%
                                                        17.0%

     59.0%           52.0%    58.0%           55.0%     49.0%
                                                                                               96%

     2010            2011     2012            2013      2014

10
Growth
Total AUMs have grown x23, increasing from by KES 6Bn to KES 146Bn.
Net Asset Value has increased by 368%, increasing from KES 6Bn to KES 23Bn
Total AUMs Net Asset Value
150 Budgeted 25 Budgeted
147 23
Actual Actual 21
30
20
15 16
23 22 15 14
13
18 11
16
14 9 9
10
11 7
9 9
5
0
2010 2011 2012 2013 2014 2010 2011 2012 2013 2014
Return achieved through active value addition initiatives during the strategy period supported by
improved investment climate.
11Brand – Delivering through people Attracted and retained high caliber professionals, supporting the delivery of promise • Leadership Development program – Focused on identifying, developing and retaining the crop of leaders essential to drive Centum’s strategy. • Recruited several highly qualified team members into Centum, who have supported the delivery of the promise we made in 2009. • 2013 Graduate program – In FY2013, we launched our graduate program and recruited 10 graduate trainees. Due to organizational growth these trainees have since been assimilated into the various group entities. • 2014 Graduate Program - Recruitment of our 2014 Graduate program is underway, with an objective of recruiting 20 participants from across the East African region, with a diverse array of technical skills. The participants of the program are expected to join Centum in July 2014. 12
Brand - Key Awards
Our passion for excellence
1. Financial Reporting Excellence (FiRe) Awards 2013
   Centum won the following awards at the 2013 FiRe award ceremony;
   i. Overall winner East Africa
   ii. Overall Winner Kenya
   iii. Winner - Industrial Commercial & Services category
   iv. Winner - Listed Entities Category
   v. 1st Runners up; IFRS Category

2. Champions of Governance Awards
    Centum was feted with two awards at the champions of Governance Awards 2013;
   i. 1st Runners up Finance & Investment category ;
   ii. Fred Murimi was awarded the 1st Runners up Certified Company Secretary of the year.

3. CEO of the Year; WCA Africa Investment Summit
   James Mworia was awarded the Wharton Club for Africa (WCA); Africa CEO of the year award at WCA
   Africa Investment Summit held in Nairobi in November 2013.

4. Acquisition International Awards
   East Africa Investment business of the year
Costs
Maintained costs below 2.3% over the period
• Prudent cost management and monitoring have ensured that costs have been maintained at below our
2.5% objective over the strategy period.
Cost efficiency
2.5%
2.2% 2.0% 2.3%
1.6% 1.5%
14Key metrics
KPI 2010 2011 2012 2013 2014
Return on Equity 56% 37% 9% 18% 42%
Earnings per Share (Kes Group) 1.64 3.44 1.79 3.77 4.23
NAV per Share (Kes) 13.76 18.86 20.57 24.25 34.47
Gearing - 16% 5% 20% 23%
Cost Efficiency 2.2% 2.0% 1.6% 2.3% 1.5%
Liquidity (Kes Bn) 2.1 0.2 1.5 2.7 1.5
Bond Covenants Description 2014
Debt Service coverage 1.5 : 1 Internally generated funds will always be 5.26:1
1.5 times greater than the finance costs
Net debt to Equity ratio 1:2 Net debt will always less than half the fair 0.42 : 2
value of shareholder funds
ELN value uplift
Initial ELN value (Kes Bn) 1.250
NAV growth 65%
ELN return realized 15%
15Transition from Passive to Active Investor
We established operational subsidiaries to drive growth
Company Comments
• Athena Properties was established to manage Centum's real estate developments as
well as those of third party clients.
• The Athena team has over 100 year cumulative real estate development
experience.
• It has delivered significant value growth for the Group’s real estate portfolio
• Centum Asset Managers was established with a mandate to structure investment
Centum Asset
products and manage third party funds, in addition to managing Centum’s quoted
Managers Ltd investments and received a fund management license in May 2013.
• It was also among the first REIT managers to be registered by the CMA.
• In 2014, it received its pension fund management license from the RBA and has also
received approval for Kenya’s first Africa-focus Collective Investment Scheme.
Centum Shared • Centum Shared Services was established to provide business solutions to
Centum Group.
Services Ltd
• This allows the subsidiaries to focus on their business
16Dividend Payout
In line with our 2009-2014 strategy, the directors do not recommend a dividend for the year
ended 31 March 2014
• In line with our 2009-2014 strategy, we do not propose the payment of any dividend in the current year.
• Over the strategy period, we have outperformed the market by an aggregate return of 219%.
Demonstrating our ability to reinvest retained dividends in growing shareholder wealth.
• Shareholders have realized returns through increase in market capitalization. Over the period, Centum
shares delivered an aggregate return of 334% to its shareholders.
17Agenda
1• FY2009-14 Strategy (Centum 2.0) Update
2• Business Unit Review
3• Financial Performance
4• FY2015-19 Strategy (Centum 3.0)
5• Q&A
182) Business Unit Review
a• Private Equity
b• Real Estate & Infrastructure
c• Quoted Private Equity
19a) Private Equity
Private Equity Portfolio Companies
20PE Portfolio Evolution
292% growth in PE Portfolio since 2009
Fair Value Attribution
PE Portfolio Value (KES bn) 14.1 14 0.5
13 1.1
10.5
8.6 12
7.6 2.0
11 14.1
5.5 0.1
10
9 10.5
8
FV March Additions Earnings Multiples Share FV March
2010 2011 2012 2013 2014 2013 Mvt Mvt Price Mvt 2014
Fair Value Movement
61% PE NAV return
• PE has achieved a gross IRR of 35%.
42% • The growth is driven both through additional
41%
investments and improved financial performance of
the PE investee companies supported through value
creating initiatives.
16%
6%
2010 2011 2012 2013 2014
21Drivers of Return
PE has successfully driven and executed major value creation activities within existing investee companies
that resulted in a 116% and 346% increase in dividend income and value uplift in the year
Company Comments
• Acquired a 35% stake in January 2013. Dividend yield of 13% realized in the
current financial year
• Assisted the company secure cheaper local debt for the business
Almasi Beverages
• Independent highly qualified management team has been recruited.
• Performance of the company is tracking ahead of the business case
• Actively driving post merger integration and key valued adding strategies
• Active participation in the privatization process
• Active participation in increasing dividend distribution in 2012 and 2013
and treasury oversight to improve the return on financial assets
22Portfolio Allocation
75% of PE portfolio allocated to Beverages and Financial Services. 64% of the portfolio valuation based
on Multiples
Allocation by Sector Valuation Basis
10% 4%
18%
15%
38%
14%
64%
37%
Beverages Financial Services Multiples Recent Price
Automotive Other Trading Price NAV
Valuation of PE entities is based on the International Private Equity & Venture Capital Valuation (IPEV) guidelines
232) Business Unit Review
a• Private Equity
b• Real Estate & Infrastructure
c• Quoted Private Equity
24Real Estate & Infrastructure
Real Estate Portfolio Companies
Project &
Development
Management
Service
Company
Real Estate
Development
Companies
25Real Estate Portfolio Evolution and NAV Return
Real Estate portfolio value (KES bn) Portfolio Value Attribution (KES bn)
11 0.1
12 0.4
10
10
8 6.0
8
6 5 6
4 11.0
4 3 4
2 5.2
2
0
0 0
2010 2011 2012 2013 2014 Opening Additions Fair Realized Disposals Closing
Portfolio Value Gains Portfolio
RE&I NAV return
2,215% • Value created in the Real estate portfolio over the
61%
strategy period has been significant.
• Proportion of real estate to total portfolio increased
27% to 34% from 0% at the beginning of the FY2009-14
strategy. Total investments in RE&I amounted to KES
4.9Bn over the period.
-6% • In FY2014, KES 2.2Bn has been invested in Real Estate
• The increase in the real estate portfolio has outpaced
-36% our original strategy assumptions.
2010 2011 2012 2013 2014
26b) Real Estate & Infrastructure
i• Athena Properties
ii • Two Rivers
iii• Pearl Marina
iv • Other update
27i) Athena Properties Limited
• East Africa’s top real estate development firm, with a key focus
on large scale mixed use developments.
• Our goal is to become Sub-Saharan Africa lifestyle developer of
choice
VISION • We offer highly regarded complete suite of end to end solutions
To be Sub Saharan Africa’s in large scale property development ranging from:
lifestyle developer of choice – master planning,
– urban planning and management,
– project management,
MISSION
– construction management,
To develop mixed use nodes and
– development management, and
lifestyle retail offerings to a
world class standard of – project finance and structuring.
excellence
• Athena has quickly established itself as the partner of choice
within the East African real estate market
• With over 100 years of local and international combined
experience in real estate,
28Athena Properties – Crafting real estate strategies for Centum and for third parties Athena’s goal is to develop several large scale mixed use developments over the next strategy period • Track record – Athena has been able to attract a pool of highly qualified professionals who have been instrumental in executing the real estate strategy as envisioned in the Centum 2009-14 Strategy • Third Party Clients - Experience gained in managing Two Rivers, has enabled Athena to secure four third party clients and has crafted real estate development strategies for these third party clients. • Outlook – Athena’s role going forward will be to develop several projects similar to Two Rivers (large scale mixed use developments) across the region, beginning with the development of Pearl Marina in August 2014. 29
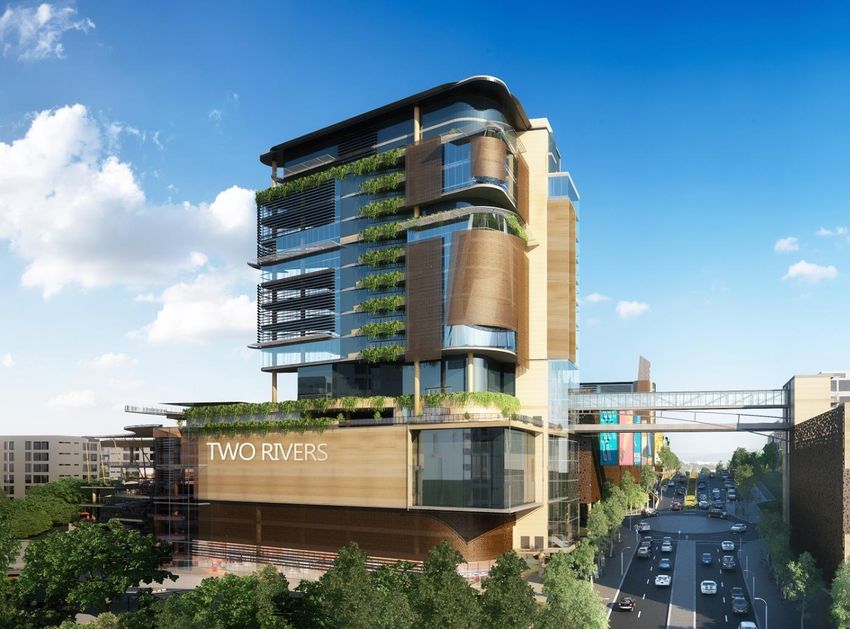
ii) Two Rivers

Key Facts
̶         102 Acres
  ̶       Located in the Diplomatic
          Blue Zone near the UN
          Complex
    ̶     851,000M2 approved bulk
      ̶   Phase 1 construction in
          progress
        ̶ Two Rivers mall is the anchor
          development

  30
Two Rivers Development - Update
Development
• Infrastructure construction on track – Permanent infrastructure to be
commissioned in June 2015
• In finalization stages of the sale of 54,600 m2 (over 580,000 sq ft) bulk rights
to developers
Funding
• We have signed investment commitments from two institutional investors, who
will invest USD 75Mn for 42% equity stake in Two Rivers Development. This
transaction will value Centum’s stake in Two Rivers at USD 104Mn (KES 9.0Bn)
valuation and values Two Rivers at USD 178Mn (KES 15.1Bn) as the post-money
valuation.
• Further, we have secured debt funding of USD 60Mn in 10-year long term debt
from a local bank
Outlook
• Two Rivers D-REIT – In the process of converting Two Rivers into a Development
REIT (D-REIT) and are currently awaiting approval. The D-REIT will provide
investors with the ability to invest in the project.
• Development of hospital and hotel – Leading the development of a luxury
hotel and a top range hospital, tailored for international operators who would
normally prefer to be operators without investing in the real estate.
• Joint ventures - Currently in discussions with potential partners for the joint
development of other sites. `
31Two Rivers Mall
Key Facts
̶ 900,000 sq.ft total GLA
comprising of :
670,000 sq.ft retail GLA
230,000 sq.ft office GLA
̶ Over 160 retail outlets
̶ Over 3,600 parking bays
Opening October 2015
32Carrefour – Two Rivers Mall Anchor Tenant
4th 10,105 Stores 364,795
Largest retail group in the International multi-format, Employees worldwide
world, with 1,421 Hypermarkets multichannel and multi-local
retailer
110,000 sq.ft 34 Countries
Committed retail space in Two a major player in global retail
Rivers Mall with strong roots in its
local communities
16% €20.9Bn €100.2Bn
Percentage of Carrefour retail Market Capitalization Global sales incl. VAT
space in Two Rivers Mall’s
670,000 sq.ft
33Two Rivers Mall – 50% let by value of which 45% is
reserved by international name brands
Everything under one roof …
- Food beverage and entertainment
- Over 25% taken up by new and existing F&B offers, providing signature
restaurant, fine dining, casual dining and QSRs
- Indoor and outdoor entertainment at the river front
- Hypermarket and food
- Carrefour hypermarket anchor
- A gourmet food offering over 35,000 sq ft
- Fashion
- Two major new international fashion sub-anchors over 65,000 sq ft
- Strong representation of Kenya’s leading retailers plus new local and
international fashion outlets
- Show casing Kenya's growing new designers
- Health beauty and wellness
- A new international gym with indoor pool and special kiddies areas over
37,500 sq ft
- Spas, beauty salons and new cosmetic outlets for men and women
- New major sports fashion and equipment outlets
34Two Rivers Mall – 50% let by value of which 45% is
reserved by international name brands
Everything under one roof…
- Jewelers and accessories
- Leading local and international brands for men and women
- Home zone
- A home zone introducing a 43,000 sq ft home furniture and lifestyle sub
anchor and an additional 45,000 sq ft home styling outlets
- Major electronics cluster
- Services
- A major specially designed banking hall with 9 banks
35Two Rivers - Other Development Components
Two Rivers has generated significant market interest and
attracted investments partners for:
i. 3 star hotel
• We have attracted a high quality development partners for
the construction and operation of the 3 star hotel
• Construction to commence in September 2014
ii. 5 star hotel
We are in advanced discussions with a top luxury hotel
brand for the operation of a luxury hotel.
iii. Apartments and Offices
We have finalised negotiations with two local property
developers and a financial institution for the development
of luxury apartments and offices.
iv. Hospital
We are engaging with some of the top providers of medical
healthcare services in the world to establish a world class
medical facility at Two Rivers.
36iii) Pearl Marina
Key Facts
̶ 361 Acres on Lake Victoria
̶ Over 3.8km of lake frontage
- ideal for waterfront
development
̶ Attractive site with variety
of flora and fauna
̶ Additional 40 acres
lakefront prime land
acquired in the year.
̶ Looking to acquire
additional strategic land
parcels in FY2015
Construction - August 2014
Limited edition Pre-Sales – Sep
2014
37Pearl Marina – Vision
To develop a premium world-class destination address recognized as the
number one tourism destination in East Africa and beyond
The development has competitive advantage, as there is no other
development of its kind in Eastern Africa
Pearl Marina will have unparalleled waterfront development that will
incorporate an up market resort, public marina, water related leisure
activities (e.g. water transport, sporting activities), retail centre, vibrant
public square (with restaurants, entertainment arenas), residential
apartments and villas
The development will have high quality infrastructure managed centrally
comprising of: Potable Water, Sewer, Underground Power with back up
generator, Wide dual Roads, sufficient parking ICT etc
38Pearl Marina – Prestigious residential villas in
Phase 1
Pearl Marina phase one will break ground in August 2014 and will involve the
development of residential villas and related infrastructure. The villas will
provide:
– the most prestigious and most sort after mix of villas.
– lifestyle product that will offer maximum convenience, luxury and a
high quality life.
– state of the art homes with stunning views over Lake Victoria
– Each home is located within discreet and exclusive sub-cluster with
landscaped gardens and terraces
The villas villa’s will include:
–Four bedroom villas
–Three bedroom villas
–Two bedroom luxury villas
High quality, reliable and sustainable infrastructure within a secure
environment.
A wide range of activities including sports, yacht, spa, tennis, cycling,
swimming, fishing, basket ball, mini-soccer and kids play areas
39Pearl Marina – 4 Br Villas Signature state of the art 4 bedroom villas on the lake front uniquely designed to offer ultimate privacy and tranquility Will provide expansive views across the lake Home Owners will choose from a range of three different finishes 40
Pearl Marina – 3 Br Villas

Luxury three bedroom homes
set in clusters of 5-8 units

Exquisitely and contemporary
designed green homes with
stunning views of lake Victoria

Each cluster compound will
provide a swimming pool,
gazebo, kids play area and
landscaped section

Designs should be based on
sustainability and   energy
efficiency

41
Pearl Marina – 2 Br Villas

Luxury two bedroom residences
set in unique blocks with
naturally landscaped areas

Home owners will have the
attractive opportunity to enroll
them to a rental pool

42
Pearl Marina – Club House

Will have conference facilities,
bar, lounge, kids play area &
swimming pool.

A wide range of activities
including sports, yacht, spa,
tennis,    cycling,   swimming,
fishing, basket ball, mini-soccer
and kids play areas

43
Pearl Marina – Cluster Concept

Each cluster will have 5-8 villas, a
swimming pool, gazebo, kids play
area and naturally landscaped
section.

The cluster concept will offer
complete privacy and unmatched
tranquility

Set to introduce the finest living
experience in Uganda that is
second to none.

Each home is located within
discreet and exclusive sub-cluster
with landscaped gardens and
terraces

44
Pearl Marina – Other development components
            School
            • We are in advanced discussions with an international school brand. The
               school will be developed in Phase 1(b) of the development.
            • The school will offer international curriculum and will be a day and
               boarding school

            Hospital
            • In discussions with leading hospitals to build a world class medical
               facility, to be developed as part of phase 2 of the development
            • The hospital will be a specialist hospital

            Marina
            • We are currently in discussion with marina operators, which will be
               developed in Phase 2 of the development
            • The marina will provide a unique experience to visitors and residents
            • Facilities will include jetty, boat launching and berthing facilities

            Resort
            • We are in discussion with 5 star resort operators and hotel groups, will be
               developed as part of phase 2 and will target business travellers,
               conferences and leisure tourist

45
iv) Other updates – Investment in Broll East Africa
Broll East Africa – Joint-venture between Centum (30%) and Broll Property Group(70%)
Invested in joint venture with Broll Property Group, the largest commercial property
services group in Africa, in the establishment of Broll East Africa.
Partnership with Broll, gives Centum the opportunity to provide end to end real estate
development solutions.
Service lines
• Asset Management
• Property Management
• Retail Propety Management
• Retail Leasing and Projects
• Facilities & Project Management
• Corporate Real Estate Services
• Broking – commercial and industrial
462) Business Unit Review
a• Private Equity
b• Real Estate & Infrastructure
c• Quoted Private Equity
47Consistently outperformed the NSE
QPE consistently outperformed the NSE over the 5 years and delivered on average outperformance of
18% over the 5 years
Centum
Year QPE/CAM Return NSE 20 Return
Outperformance
2010 56% 43% 13%
2011 10% -4% 14%
2012 0% -13% 13%
2013 53% 44% 9%
2014 43% 2% 41%
Geometric
30% 12% 18%
Average
48CAM Track Record
240% return in less than 5 years
300.0%
250.0%
200.0%
Cummulative Return
150.0%
100.0%
50.0%
0.0%
Apr. Jun. Aug. Oct. Dec. Feb. Apr. Jun. Aug. Oct. Dec. Feb. Apr. Jun. Aug. Oct. Dec. Feb. Apr. Jun. Aug. Oct. Dec. Feb. Apr. Jun. Aug. Oct. Dec. Feb.
09 09 09 09 09 10 10 10 10 10 10 11 11 11 11 11 11 12 12 12 12 12 12 13 13 13 13 13 13 14
-50.0%
One Month YTD 2 Years 3 Years 5 Years
0.9% 43.5% 132.6% 147.5% 240.7%
* Launch – Start of strategy Period (April 01/2009)
49QPE has grown from managing our liquidity
Delivered a record breaking KES 1.8Bn return in FY2014
6.0
0.3
0.6
5.0
1.8Bn 0.7
0.2
4.0 0.2
0.1
5.2
3.0
3.7
2.0
Opening Dividends Interest Other income Realized Unrealized Net cash Closing
Portfolio gains gains movement Portfolio
50Portfolio Allocation
74% of QPE portfolio allocated to Equities. 63% of the portfolio is outside Kenya
Allocation by Assets Allocation by Geography
Kenya East Africa Other SSA countries
26% 23%
37%
74%
Quoted Securities Bonds 40%
51Our chosen space
We play in all the major Sub-Saharan Africa Markets
TUNISIA
Mediterranean Sea
Canary Islands MOROCCO
(SPAIN)
LIBYA
ALGERIA EGYPT
WESTERN
SAHARA
MAURITANIA
MALI NIGER
CHAD
SENEGAL
GAMBIA
BURKINA SUDAN DJIBOUTI
GUINEA BISSAU
GUINEA BENIN
NIGERIA SOMALIA
TOGO ETHIOPIA
IVORY
SIERRA LEONE GHANA CENTRAL
COAST
AFRICAN REPUBLIC
LIBERIA
CAMEROON
EQUATORIAL GUINEA UGANDA
SAO TOME KENYA
& PRINCIPE CONGO DRC
GABON
RWANDA Indian Ocean
BURUNDI
(ANGOLA)
South Atlantic TANZANIA
ANGOLA MALAWI
Exposure & Experience ZAMBIA
NAMIBIA ZIMBABWE Mauritius
MOZAMBIQUE MADAGASCAR
SOUTH AFRICA BOTSWANA Reunion
(Walvis Bay) (FRANCE)
SWAZILAND
SOUTH AFRICA
LESOTHOOur Product Offering
We have several vehicles to attract 3rd party funds
1. Segregated funds 2. Private wealth 4. Collective
3. Cash Management
management management Investment Schemes
• Professional • Planning and • Treasury & • Pooled
management of management of liquidity investment
institutional funds assets belonging management of vehicle targeted
high net worth corporate surplus to individuals and
individuals & funds institutional funds
family officesThe Collective Investment Scheme (CIS)
..a uniquely differentiated CIS with a SSA scope
Umbrella Fund, Themed to
capture the Africa rising
Centum Africa CIS
opportunity
Africa Money Africa Fixed Africa Balanced Africa Equities
Markets Fund Income Fund Fund Fund
Sub funds; tailored to suit different risk/return characteristics of the target investors within
the SSA investing themeAgenda
1• FY2009-14 Strategy (Centum 2.0) Update
2• Business Unit Review
3• Financial Performance
4• FY2015-19 Strategy (Centum 3.0)
5• Q&A
55Group Statement of Comprehensive income
23% increase in PBT, 22% increase in PAT
Kes. m FY2014 FY2013 Var
Dividend income 460 301 53% • 25% improvement in income due
to improved Portfolio performance
Interest income 218 223 (2%)
Other income 279 89 213% • Increase in portfolio costs on
account of growth strategy.
Realized gains 993 1,641 (39%)
Unrealized gains 2,932 1,653 77% • Improvement in performance of
Associate companies
Income 4,883 3,906 25%
Portfolio costs (796) (520) 53% • Improvement in performance &
valuations of the investment
Finance costs (469) (401) 17% portfolio
Share of Ass. Profit 393 263 49%
Profit before tax 4,011 3,248 23%
Tax (956) (739) 29%
Profit after tax 3,055 2,509 22%
Other comp income 3,576 1,092 227%
Total comp income 6,631 3,601 84%
56Group Statement of Financial Position
56% growth in total assets as at 31 March 2014
Assets (Kes M.) FY2014 FY2013 Liabilities (Kes M.) FY2014 FY2013
Investment property 10,845 5,456 Borrowings 5,492 4,150
Equipment & Intangibles 1,049 49 Payables and accruals 1,840 289
Investment in associates 3,901 3,659 Unclaimed dividends 29 33
Unquoted investments 7,569 4,306 Current income tax 210 18
Quoted investments 3,036 2,733 Deferred tax liability 1,752 829
Corporate bonds 1,071 995 Liabilities 9,324 5,319
Receivables 1,282 261
Cash & cash equivalents 844 1,502 Shareholder funds 20,273 13,643
29,597 18,962 29,597 18,962
57Cash flow Statement
Kes M 2014 2013
Internally generated funds: 3,550 2,167
Investing activities:
Equity & Investment Property (4,776) (3,753)
Equipment & intangibles (18) (27)
(4,794) (3,780)
Financing Activities:
Net Proceeds from borrowings - 3,150
Dividends paid to shareholders (45) (2)
Interest paid (660) (344)
(705) 2,804
Net Increase/(Decrease) (1,949) 1,191
Opening cash 1,502 322
Closing cash & cash equivalents (Net of Overdraft) (447) 1,502
*Dividend paid relates to unclaimed dividends paid in the year and dividends paid to non-controlling interest in subsidiaries
58Company statement of comprehensive income
Kes. mc FY2014 FY2013 Var
Dividend income 1,789 283 531%
Interest income 40 108 -63%
• Increased dividend income from
Other income 11 80 -86% investment portfolio and subsidiaries
Realized gains 149 1,433 -90% • Improvement in performance &
Unrealized gains 0 10 -100% valuations of the investment
portfolio
Income 1,988 1,914 4%
Portfolio costs (431) (442) -2%
Finance costs (462) (401) 15%
Profit before tax 1,096 1,071 2%
Tax (48) (37) 31%
Profit after tax 1,047 1,034 1%
Other comp income 5,752 1,417 306%
Total comp income 6,800 2,451 177%
59Balance Sheet
Assets Liabilities & Shareholder Capital
Kes M. 2014 2013 Kes M. 2014 2013
Investment in Borrowings 5,492 4,150
8,159 3,442
subsidiaries Payables and accruals 326 230
Equipment & Intangibles - 46 Unclaimed dividends 29 33
Investment in associates 6,594 6,153 Current tax liability 28 19
Unquoted investments 5,495 3,539 5,792 4,432
Quoted investments 686 1,089 Shareholder funds 22,936 16,137
Corporate bonds - 106 Equity & liabilities 28,811 20,569
Due from subsidiaries 7,668 5,131
Receivables 27 132
Cash & cash equivalents 175 931
Total Assets 28,811 20,569
60Agenda
1• FY2009-14 Strategy (Centum 2.0) Update
2• Business Unit Review
3• Financial Performance
4• FY2015-19 Strategy (Centum 3.0)
5• Q&A
61Our Strategic Objectives 5 Years Ago vs. Today:
Summary of Key Changes
CENTUM 2.0 CENTUM 3.0
Developed three business units, with PE Focus will be placed on 8 priority sectors
Focus
having no specific sector focus
Active promoter and developer of investment
Portfolio manager looking for growth
Approach grade opportunities
capital and consolidation opportunities
Interested primarily in majority stakes, where
Focused on control or minority stakes in Centum can exert significant influence. Control of
Ownership
key sectors process of value creation is more important than
control of ownership
Preference to creating and building up market
Preference to invest in current or near-
Targets leaders, not investing in incumbent leaders where
off market leaders
values are high
Open to investing alongside or into Interested in supplying investment grade assets to
Competition
other PE funds mid- and large- cap PE funds
Disproportionate value creation in development
Perspective Long-term value creation phase, often coupled with longer term value
creation post-development
Target annual return of 30%-35%
Return Target annual return of 35%+
62Sector Growth
Real Estate Energy Agriculture
Real estate sector has been Research shows energy demand Best fit is in integrating
growing quickly for the last 5 yrs. will outstrip supply for next 20 primary production with
Sector growth
years: tariffs likely to remain processing.
The demand for affordable high
housing stands at 150,000 units Trading profits can be
annually but only 23% of this New PPA in KE widely considered attractive including food
demand is currently being met. bankable logistics provision
Financial Services Health Education
Industry profitability is growing at Research shows annual private Increasing investment in private
Sector growth
2x GDP—and market size grows health expenditure in Kenya education, with growing
rapidly due to low penetration will range from $1.8BN-$3.1BN demand for quality education.
by 2025, with new capex
Insurancepenetration in SSA low requirements exceeding
and growing: premiumsSector Growth (cont’d)
FMCG ICT
Africa’s middle class is expected In Kenya, ICT grew by an
Sector growth
to be more than 40% by 2020 estimated 20% annually from
By 2020, >50% of African 1999-2009.
households will have disposable There are more mobile money
income, rising from 85M to accounts than bank accounts in
~130M Kenya, Uganda, Tanzania and
Madagascar
Source: Dalberg Sector Deep-Dives
64FY2015-19 Strategic themes
1
RETURN • Generate 35%+ annualized return over the strategic period
• Develop, scale and grow investment capabilities in the 8 new
2
sectors, Agriculture, Education & Health, Energy, Financial
FOCUS
Services, FMCG and ICT and further grow our existing Real Estate
investments
3 • To grow Centum Total Assets Kshs 120Bn by 2019
SCALE
• Third party AUMs to Kshs 600Bn
4 • Develop teams with sector expertise
BRAND
• Build a track record of project development in our targeted sectors
5
COSTS • To maintain costs below 2.0% of total assets
65Funding
Centum 3.0 strategy will be largely funded through internally generated
funds and shall retain the zero-dividend policy for the FY2014/19 Period
Project Development Growth Phase Mature Growth
Centum’s internally generated Equity investment by financial Debt funding to unlock equity.
funds through portfolio cash investor at project level.
return and dividend retention
Group-level debt facilities Project-specific debt Full or partial exit to realize
fair value gains
Enterprise
Value
Cumulative
Capex
Cash flow
Investment Promotion Portfolio ManagementAgenda
1• FY2009-14 Strategy (Centum 2.0) Update
2• Business Unit Review
3• Financial Performance
4• FY2015-19 Strategy (Centum 3.0)
5• Q&A
67Q&A
Centum Investment Company Ltd.   Tel +254 20 316303
     International House,             Mobile +254 722 205339
     5th Flr. Mama Ngina St.          Fax +254 20 223223
     PO Box 10518-00100               Email info@centum.co.ke
     Nairobi, Kenya                   www.centum.co.ke

69
You can also read