1Q 2020 UPDATE 28 April 2020 - Investor Relations

Page created by Tracy Simpson
 
CONTINUE READING
1Q 2020 UPDATE 28 April 2020 - Investor Relations
1Q 2020
UPDATE

28 April 2020
1Q 2020 UPDATE 28 April 2020 - Investor Relations
AGENDA

 1       1Q 2020 KEY HIGHLIGHTS

     2     FINANCIAL PERFORMANCE

     3     PORTFOLIO UPDATE

 4       MARKET OUTLOOK & STRATEGY
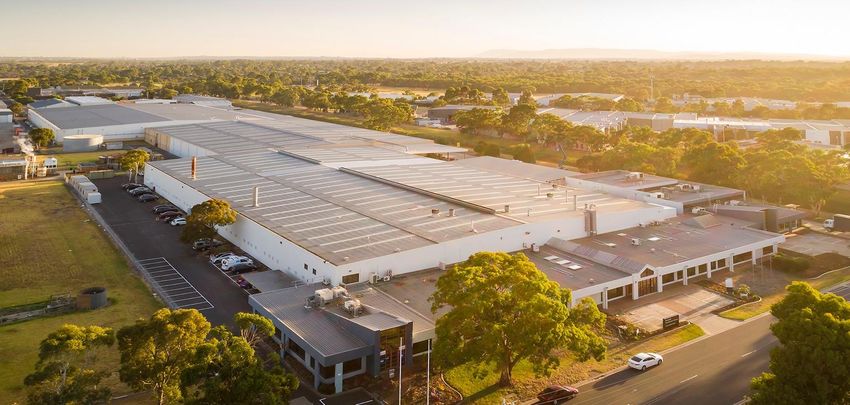
1Q 2020 UPDATE 28 April 2020 - Investor Relations
KEY
HIGHLIGHTS
1Q 2020 UPDATE 28 April 2020 - Investor Relations
1Q 2020 KEY HIGHLIGHTS

     Sound Fundamentals; Well-positioned to address future volatility
    Improved                                           Prudent                                            Strong
    Operating                                          Capital                                            Portfolio
    Performance                                        Management                                         Performance
     1Q 2020 Gross Revenue                               Aggregate Leverage                               Strong Portfolio Occupancy
     S$28.8 mil                                          40.8%                                            97.1% committed
                                                                                                          Singapore – 97.2%
     1Q 2020 NPI                                         All-in Financing Cost                            Australia – 96.9%
     S$22.0 mil                                          3.63%
                                                                                                          WALE (by NLA)
     Distributable Income                                NAV (1)                                          2.9 years
     S$13.4 mil                                          S$0.56 per unit
                                                                                                          Significant Leases Secured
     Distribution Retained                               Interest Coverage Ratio               (2)
                                                                                                          ~ 1.1 mil sf in 1Q 2020
     S$2.5 mil                                           3.7 times
                                                                                                          Tenants
     (approx. 20%)                                                                                        73 of whom >60%
     Distribution to Unitholders (3)                                                                      are High Quality
     S$10.9 mil                                                                                           MNCs Serving Well-
                                                                                                          Supported Logistics Sectors
     DPU to Unitholders
     0.997 cents
Notes:
(1)    Based on 1,088,684,835 Units. The NAV Per Unit is computed based on the net assets attributable to Unitholders.
(2)    ICR is computed based on trailing 12-month period ending on 31 Mar 2020. Includes margin and amortisation of capitalised upfront fee, excluding non-recurring finance expenses, upfront fees written off and FRS 116   4
       adjustments.
(3)    There are no capital distributions for 1Q 2020.
1Q 2020 UPDATE 28 April 2020 - Investor Relations
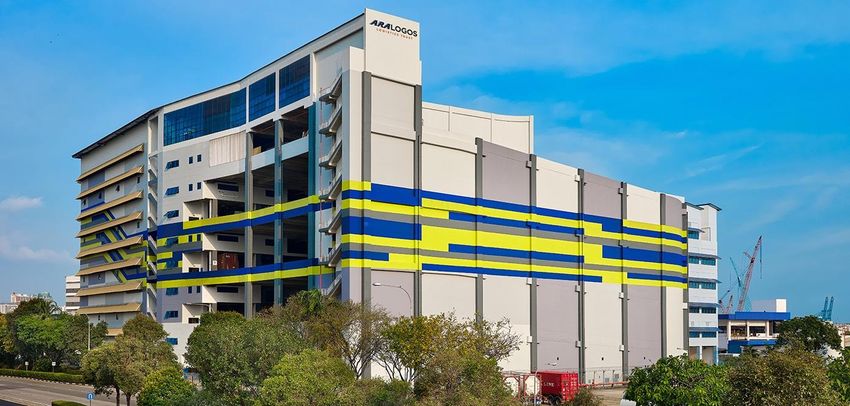
REBRANDING OF CACHE LOGISTICS TRUST

                 Demonstrates
                    Strong                      Mr Daniel Cerf, CEO of the Manager:
                 Commitment
                 from ARA and                   “This rebranding exercise reflects ALOG’s
  Access New        LOGOS                       enhanced growth potential, supported by
    Growth                                      the complementary strengths, capabilities
                                Alignment of
   Markets,
                                Interest with   and resources of ARA and LOGOS.
 Expansion and
                                 Unitholders
 Development
 Opportunities                                  We are now able to leverage on LOGOS’
                                                established track record and enlarged
                                                network of high-quality, modern logistics
                                                warehouses       and      strong   tenant
                                 Leverage on    relationships across Asia Pacific.
  Leverage on
                                  Collective
     LOGOS
   Expansive
                                  Expertise,    Coupled with its extensive development
                                Resources and   expertise, we are confident that ALOG will
    Network
                                Relationships
                   Access to                    continue to deliver sustainable growth for
                    LOGOS                       our Unitholders in the future.”
                  Integrated
                 Development
                   Platform

                                                                                             5
1Q 2020 UPDATE 28 April 2020 - Investor Relations
FINANCIAL
PERFORMANCE
1Q 2020 UPDATE 28 April 2020 - Investor Relations
Y-O-Y PERFORMANCE

                                                 • Lower gross revenue due to:
           Y-O-Y (S$mil)
                                                  i. conversion of Cache Gul LogisCentre from
  30.8                                               master lease to multi-tenancy in Apr 2019;
                 - 6.6%            28.8
                                                  ii. transitory vacancy downtime between
         23.8
                                                      leases;
                          - 7.3%          22.0    iii. lower signing rents for leases as compared
                                                       to the previous leases;
                                                  iv. a weaker Australian dollar; and
                                                  v. partially offset by additional rental
                                                     contribution from the warehouse in Altona,
                                                     Victoria, Australia acquired in Apr 2019.
                                                 • Lower NPI due to lower gross revenue,
                                                   higher expenses incurred from the conversion
                                                   of Cache Gul LogisCentre and partially offset
   1Q 2019                          1Q 2020        by lower expenses from the Australia
 Gross Revenue      Net Property Income (NPI)      portfolio.

                                                                                                    7
1Q 2020 UPDATE 28 April 2020 - Investor Relations
Y-O-Y DISTRIBUTION INCOME
                 Distributable Income (S$mil)                                          DPU (cents)

                        16.3                                                   1.513
                                            - 33.5%
                                                                                             - 34.1%
                                                              10.9

                                                                                                       0.997 (1)

                    1Q 2019                               1Q 2020             1Q 2019                  1Q 2020

 • 1Q 2020 Distribution to Unitholders : S$10.9mil (Retained S$2.5mil (approx. -20%))
 • 1Q 2020 DPU available to Unitholders : 0.997 cents
 • Lower distributable income and DPU to Unitholders mainly to conserving capital to
   address potential rental deferment and/or waivers required to support some tenants
   through this challenging period.

Notes:
(1) Based on 1,088,684,835 units issued and to be issued as at 31 Mar 2020.
                                                                                                                   8
1Q 2020 UPDATE 28 April 2020 - Investor Relations
1Q 2020 VS 4Q 2019 PERFORMANCE

                     Improved Performance in 1Q 2020

                     S$’mil
                                                  • Stronger performance
                                 28.8
     27.2          5.8%                             recorded in 1Q 2020 as
                                                    compared to 4Q 2019.
                                        22.0
            20.5          7.6%                    • Higher Gross Revenue
                                                    and NPI of 5.8% and
                                                    7.6%, underpinned by:
                                                    i. higher occupancy
                                                        level; and
                                                    ii. commencement of
                                                        new leases at several
                                                        properties.
       4Q 2019                     1Q 2020
   Gross Revenue      Net Property Income (NPI)

                                                                                9
1Q 2020 UPDATE 28 April 2020 - Investor Relations
DISTRIBUTION – 1Q 2020 vs 4Q 2019

        Achieved higher operating performance in 1Q 2020 vs 4Q 2019

       Distributable Income                                               DPU (cents)                       Adjusted DPU (cents)
              (S$mil)
                                                                                                             Excluding the S$2.3mil one-off
            14.9                                                      1.376                             tax exempt distribution in 4Q 2019 from
                                                                                                       the divestment of Jinshan and retention of
                              -27.4%                                                                          approx. S$2.5mil in 1Q 2020
                                                                                -27.5%
                                                                                                                                    1.226 (1)
                                         10.9
                                                                                                                      10.1%
                                                                                         0.997   (1)

                                                                                                             1.114

         4Q 2019                     1Q 2020                       4Q 2019           1Q 2020              4Q 2019                  1Q 2020

Notes:
(1) Based on 1,088,684,835 units issued and to be issued as at 31 Mar 2020.
                                                                                                                                                    10
PRUDENT CAPITAL MANAGEMENT

       Key Financial Indicators                                                                                                                                          31 Mar 20

       NAV Per Unit (1)                                                                                                                                                           S$0.56

       Total Debt (2)                                                                                                                                                   S$510.1 mil

       Aggregate Leverage Ratio                                                                                                                                                     40.8%

       All-in Financing Cost                                                                                                                                                        3.63%

       Interest Coverage Ratio (3)                                                                                                                                            4.0 times

       Average Debt Maturity                                                                                                                                                  3.7 years

Notes:
(1)   Based on 1,088,684,835 Units. The NAV Per Unit is computed based on the net assets attributable to Unitholders.
(2)   Excludes unamortised transaction costs.                                                                                                                                                      11
(3)   ICR is computed based on trailing 12-month period ending on 31 Mar 2020. Includes margin and amortisation of capitalised upfront fee, excluding non-recurring finance expenses and FRS 116
      adjustments.
PRUDENT CAPITAL MANAGEMENT
           Well-Staggered Debt Maturity Profile (S$ mil)                                                                   Floating
300                                                                                                                          Rate
                                                                                                                            30.4%
250                                                          225.4                                     Interest
                                                                                                         Rate
200
                                                                                                       Hedging
                                                                                       Fixed Rate
150                                                                       121.7
                                                 110.0                                   69.6%
100
                        53.0
 50                                                                                • 69.6% of total debt hedged.
                                                                                   • 86.8% of SGD debt and 28.6% of onshore AUD
    0                                                                                borrowings are hedged with an average term of 3.1
            2020        2021         2022        2023        2024         2025       years.
                                 SGD Loan    AUD Loan                                        Unhedged
                                                                                               (AUD)
 % of                                                                                           7.5%
 debt        0%         10%            0%         22%        44%          24%
 due                                                                                                                            SGD
                                                                                                         Forex                 62.0%
•       Well-Manageable Debt Maturity Profile.   No further refinancing required          Hedged
                                                                                                        Hedging
        until 2021.                                                                        (AUD)
•       Weighted Average Debt Maturity was 3.8 years as at 31 Mar 2020.                    30.5%
•       Sound Financial Covenants.
                                                                                   • 92.5% of distributable income is hedged or derived in
                                                                                     SGD to reduce the impact of adverse exchange rate
                                                                                     fluctuation.

                                                                                                                                        12
DISTRIBUTION DETAILS

    SGX                                            Distribution Per Unit     Payment
                     Distribution Period
 Stock Code                                               (cents)              Date

   K2LU          1 January – 31 March 2020            0.997 cents          29 May 2020

              Distribution Timetable

              Last day of trading on “cum” basis          5 May 2020

              Ex-Dividend Date                            6 May 2020

              Books Closure Date                          8 May 2020

              Distribution Payment Date                  29 May 2020

                                                                                         13
PORTFOLIO
 UPDATE
PROPERTY LOCATIONS

         Good Quality, Resilient Portfolio in Singapore and Australia
                                                                                        Australia
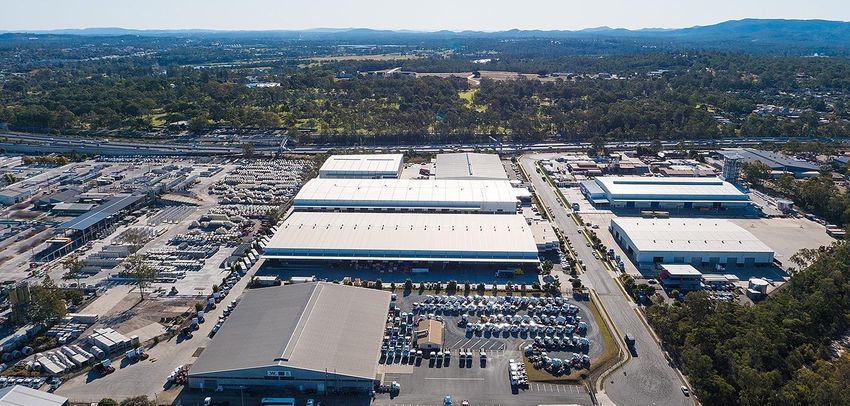
                                                                                        11. 51 Musgrave Road, Coopers Plains, QLD
                                                                                        12. 196 Viking Drive, Wacol, QLD
                                                                                        13. 203 Viking Drive, Wacol, QLD
                                                                                        14. 223 Viking Drive, Wacol, QLD
                                                                                        15. 11 – 19 Kellar Street, Berrinba, QLD
Singapore                                                                               16. 127 Orchard Road, Chester Hill, NSW
1. Commodity Hub                                                                        17. 3 Sanitarium Drive, Berkeley Vale, NSW
2. Cache Cold Centre                                                                    18. 16 – 28 Transport Drive, Somerton, VIC
3. Pandan Logistics Hub                                                                 19. 217 – 225 Boundary Road, Laverton North,
4. Cache Gul LogisCentre (formerly Precise                                              VIC
   Two)                                                                                 20. 16 – 24 William Angliss Drive, Laverton North,
5. Schenker Megahub                                                                     VIC
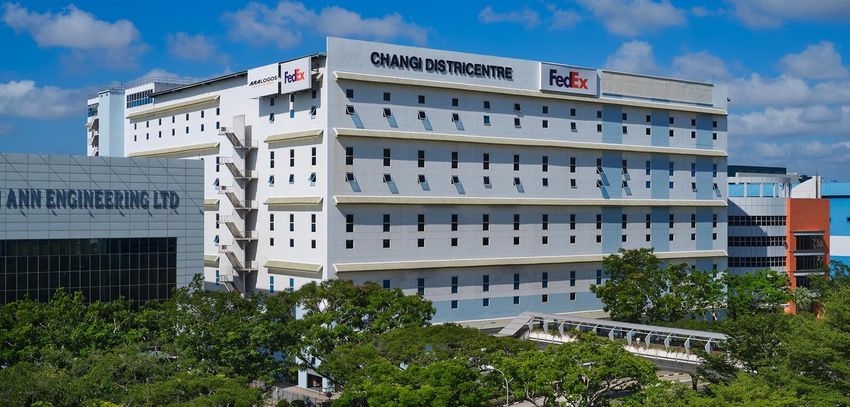
6. Cache Changi DistriCentre 1                                                          21. 151 – 155 Woodlands Drive, Braeside, VIC
7. Cache Changi DistriCentre 2                                                          22. 41 – 51 Mills Road, Braeside, VIC
8. Pan Asia Logistics Centre                                                            23. 67 – 93 National Boulevard, Campbellfield,
9. Air Market Logistics Centre                                                          VIC
10. DHL Supply Chain Advanced Regional                   10
                                             Singapore                                  24. 41 – 45 Hydrive Close, Dandenong South,
   Centre                                                                               VIC
                                                                                        25. 76 – 90 Link Drive, Campbellfield, VIC
                                                                                        26. 404 – 450 Findon Road, Kidman Park, SA
     Portfolio Statistics                                                               27. 182 – 198 Maidstone Street, Altona, VIC

     ✓ 27 Properties                                                            Brisbane
     ✓ 9.0 mil sf GFA                                           Australia
                                                                                    5

     ✓ S$1.26 bil in property value
     ✓ WALE of 2.9 years by NLA                               Adelaide
                                                                      1
                                                                            9
                                                                                2
                                                                                Sydney
                                                                Melbourne

                                                                                                                                         15
PORTFOLIO STATISTICS

Property Portfolio Statistics                                                                               as at 31 Mar 2020

                                                                                                              Singapore - 10
27 Logistics Warehouse Properties
                                                                                                               Australia - 17

Total Valuation(1)                                                                                                S$1.26 bil
Gross Floor Area (GFA)                                                                                       9.0 million sq ft

                                                                                                           Portfolio – 97.1%
Committed Occupancy                                                                                       Singapore – 97.2%
                                                                                                           Australia – 96.9%

Average Building Age                                                                                              15.8 years
Weighted Average Lease to Expiry (“WALE”) by NLA                                                                   2.9 years
WALE by Gross Rental Income                                                                                        2.9 years
Weighted Average Land Lease Expiry                                                                              54.1 years(2)
Rental Escalations within Single-Tenant / Master Leases                                                      ~1% to 4% p.a.
Number of Tenants                                                                                                          73

Notes:
(1) Based on FX rate of S$1.00 = A$1.0588.                                                                                       16
(2) For the purpose of presentation, freehold properties are computed using a 99-year leasehold tenure.
PORTFOLIO OVERVIEW : SINGAPORE

                  Changi North / Loyang                                                                                                     Airport Logistics Park

                                                                                                                                                   Schenker Megahub
   8 Pan Asia Logistics Centre   9 Air Market Logistics Centre                                  Sembawang                                    5
      21 Changi North Way               22 Loyang Lane                                                                                              51 Alps Avenue
                                                                                                 Wharves
                                                                          Johor
                                                                      Causeway Link

  Tampines LogisPark                                                                                                                                             Changi South
                                                                                                                            Pulau Ubin

                                                                                                                                        5
                                          Second link                                                           10              9
                                       (Tuas checkpoint)                                                                            8

                                                                                                                                      Changi
                                                             4            1                                                 7   International Airport
                                                                      2                                                 6
                                                                               3
                                                                 Jurong Port
  10 DHL Supply Chain ARC                                                                                                                                    6 Cache Changi DistriCentre 1
                                                             Jurong                                                                                             5 Changi South Lane
       1 Greenwich Drive                                                      Pasir Panjang             Keppel Terminal
                                                             Island
                                                                                Terminal
                                                                                              Sentosa

                                             Pandan/ Penjuru/ Gul Way

                                                                                                                                                            7 Cache Changi DistriCentre 2
                                                                                                                                                                3 Changi South Street 3

  1      Commodity Hub           2   Cache Cold Centre             3      Pandan Logistics Hub                 4     Cache Gul LogisCentre
         24 Penjuru Road             2 Fishery Port Road                    49 Pandan Road                               15 Gul Way

                                                                                                                                                                                             17
PORTFOLIO OVERVIEW : AUSTRALIA
                             Brisbane, Queensland                                                            Sydney, New South Wales

  11    51 Musgrave Road,         12     203 Viking Drive,      13    223 Viking Drive,                127 Orchard Road,
                                                                                               16                                 17      3 Sanitarium Drive,
          Coopers Plains                      Wacol                        Wacol                          Chester Hill                      Berkeley Drive

                                                                                                                             Melbourne, Victoria

                  14   11 – 19 Kellar Street,     15    196 Viking Drive,
                             Berrinba                        Wacol

                                                                                               18 16 – 28 Transport Drive,   19 217 – 225 Boundary Road,        20 16 – 24 William Angliss
                                                                                                          Somerton                        Laverton North              Drive, Laverton North

       Adelaide, South
          Australia                                                                 Brisbane
                                                                                               21   151 – 155 Woodlands      22        41 – 51 Mills Road,      23      67 – 93 National
                                                                                                       Drive, Braeside                      Braeside                 Boulevard, Campbellfield
                                                                                   Sydney
                                                                Adelaide
                                                                                   Melbourne
             404 – 450 Findon
       26
            Road, Kidman Park
                                                                                               24   41 – 45 Hydrive Close,    25       76 – 90 Link Drive,      27 182 – 198 Maidstone
                                                                                                      Dandenong South                    Campbellfield                    Street, Altona

                                                                                                                                                                                              18
WELL-SPREAD LEASE EXPIRY PROFILE

                More than 50% committed till 2022 and beyond;
                 only 8.1% lease expiries remaining for 2020
                               Portfolio Lease Expiry Profile
                                   By NLA     By Gross Rental Income (GRI)
   35%
                        32.7% 33.0%

   30%

                                                                                           25.3% 25.1%
   25%

                                                 20.7%
                                            19.8%
   20%

   15%
                                                               11.3%
                                                                    10.5%
   10%          8.1%
         7.8%

   5%                                                                        3.1% 2.6%

   0%
          FY2020          FY2021              FY2022              FY2023      FY2024     FY2025 and beyond
                             WALE by NLA : 2.9 years
                       WALE by Gross Rental Income : 2.9 years
                                                                                                             19
PORTFOLIO PERFORMANCE

                                             STRONG OCCUPANCY FUNDAMENTALS
 High Committed Portfolio Occupancy Achieved                                                                                                     97.1%

 Significant leases secured in 1Q 2020(1)                                                                                               1,115,800 sq ft

                                                                             Area                                            LEASES SECURED
                                                                             (sq ft)                             1,200,000
 1Q 2020(1)
                                                                                                                 1,000,000          218,100
   Renewal                                                                        897,700
                                                                                                                  800,000
   New Lease                                                                      218,100
                                                                                                                  600,000
   Total                                                                       1,115,800
                                                                                                                  400,000
                                                                                                                                    897,700
   Rental Reversion(2) (3)                                                        - 0.1%(4)
                                                                                                                  200,000
Notes:
(1) Excludes short-term leases.
(2) Based on the weighted average variance between the average signing rents for new and renewed leases                 0
    and the average signing rents of preceding leases.
(3) Excludes leases with different lease structures (e.g. master lease to multi-tenant), short-term leases and               Renewals   New Leases
    when the leased areas differ significantly.
(4) Based on 897,700 sq ft of relevant leased areas (in line with footnote 3 above) for 1Q 2020.

                                                                                                                                                          20
PORTFOLIO REBALANCING & GROWTH

  Australia
    41%                                                           Australia
                                                                    26%                                                           Australia
                                                                                                                                    32%

                       Portfolio                                                        Gross                                                             Portfolio
                         NLA                                                           Revenue                                                            Valuation
                                                                                                                                                                                            Singapore
                                                                                                                          Singapore                                                            68%
                                                      Singapore                                                              74%
                                                         59%

                                    WALE                                                                                                     NPI Yield

  Singapore                                                                                          Singapore                                                                                  7.5%
                                          2.7 years

    Australia                                                                3.2 years                 Australia                                                   6.5%(1)

    Portfolio                                           2.9 years                                       Portfolio                                                                        7.2%

                2.4           2.6          2.8            3            3.2          3.4                             5.0           5.5            6.0            6.5            7.0          7.5
                                WALE (by NLA, in years)                                                                                        NPI Yield (%)

Note:
(1) Includes the incentives reimbursed by the vendor in relation to the acquisition of the 9-property portfolio in Australia completed in Feb 2018 and rental support by the vendor in                 21
    relation to acquisition of the property in Altona, VIC, Australia completed in Apr 2019.
DIVERSIFIED, STRONGLY SUPPORTED
PORTFOLIO WITH QUALITY TENANTS/USERS
 1. Greater Balance between Multi-Tenanted and                     2. Geographical Diversification beyond Singapore
    Single-User Lease Structures
                                          Single-User
                                             29%                                                            Australia
                                                                                                             26%

                          Gross                                                             Gross
                         Revenue                                                           Revenue
                                                                         Singapore
      Multi-Tenanted                                                         74%
            71%

                   Single-User   Multi-Tenanted                                        Singapore     Australia

3. Credit Quality: Majority of End-Users/Tenants                   4. Users Serving Well-Supported Industry Sectors
   are Multinational Companies (MNCs)                                          1% 3%   1%          Industrial & Consumer Goods
                                                                           3%1%
                                                  MNCs                    2%
                                                                        1%                         Food & Cold Storage
                                                  62%
                                                                                                   Healthcare
        SMEs
         38%                                                            13%
                                                                                                   Aerospace

                           NLA                                                       NLA           Automotive

                                                                                                   Information Technology

                                                                                                   Materials, Engineering, Construction
                                                                                            75%
                                                                                                   E-Commerce

       Multinational Companies   Small-Medium Enterprises (SMEs)                                   Others

                                                                                                                                          22
DIVERSIFIED TENANT BASE

                                            High Quality Tenants
 • Top 10 tenants make up approximately 53.4% of Gross Rental Income.
 • Tenants comprise mainly high quality multinational businesses in the logistics / supply chain and
   other diverse sectors including FMCG, transportation and construction.
16                         Top 10 Tenants by Gross Rental Income
     14.4
            14.1
14

12
                         10.7
                   9.8
10

8
                                6.1 6.0
6
                                           4.8 5.1      4.7 4.6
                                                                    4.2 4.5
4                                                                                 3.2 3.4
                                                                                            2.7 2.7
                                                                                                        1.8 1.7     1.7 1.8
2

0
       DHL          CWT         Schenker   Metcash       Fedex      McPhee        Penske    Pan Asia    Fairprice    Mars
                                                                   Distribution             Logistics               Australia
                                                     31-Mar-20    31-Dec-19

                                                                                                                                23
PORTFOLIO UPDATE (COVID-19)
MEASURES TAKEN BY THE MANAGER
• BUSINESS AS USUAL
  ➢ ALOG’s properties remain open and Management continues to support tenants.
  ➢ Service levels are being maintained given the present circumstances (enhanced by
    ways described below).
  ➢ Marketing continues for vacant/upcoming space to prospective tenants to maintain
    ALOG’s track record of high portfolio occupancy.
• MINIMIZING THE POTENTIAL SPREAD OF COVID-19
  ➢ Management continues its attempt to keep tenants, visitors and employees safe.
  ➢ Pro-actively implemented precautionary measures early on:
    ❑ Issuing circulars and reminders to tenants on government advisories;
    ❑ Performing regular temperature checks;
    ❑ Recording of travel declarations; and
    ❑ Increasing cleaning and frequently sanitizing high-touch common areas.

                                                                                       24
COVID-19 OUTBREAK –
MANAGEMENT’S COMMITMENT

          Looking after the health, safety and public welfare of our tenants, visitors and
          their workforce.

          Recognizing that although an ‘essential service’, some logistics tenants find
          the going difficult due to a host of issues.

          Siding with the governments of Singapore and Australia to swiftly accord
          affected tenants the assistance and relief measures provided under
          legislation.

          Monitoring and adapting where necessary as well as proactively managing
          tenant relations in the best interest of all parties.

          Focusing on sustainability and protecting the ALOG franchise by way of
          prudent management of the portfolio and capital structure to safeguard the
          long-term interests of Unitholders.

                                                                                             25
COVID-19 OUTBREAK –
ASSISTANCE TO TENANTS
▪ Singapore - Property Tax Rebate -
  Tenant relief of approximately S$2.2 mil, being the total 30% property tax
  rebate, which will be passed on to its Singapore tenants.

▪ Singapore – Covid-19 (Temporary Measures) Act 2020
  Working with affected tenants to swiftly implement a monthly rental deferral
  plan over the next 6-months commensurate with the impact directly affected
  by the COVID-19 outbreak.

• Australia – Mandatory Code of Conduct
  Working with affected tenants (those with turnover 30% revenue loss, and participating in the JobKeeper program) to
  implement a rental payment programme based on the reduction in the
  tenant’s trade impacted by the COVID-19 outbreak.

                                                                                 26
RECENT REGULATORY UPDATES

                     • SGX amended the reporting framework from quarterly to semi-annual.
  SGX - Change in    • ALOG will be adopting half-yearly reporting of the financial statements
                       and providing business updates for 1Q and 3Q of each year.
   reporting and     • Extended AGM deadline for issuers with 31 Dec 19 year-end.
 FY2019 AGM Date
                     • ALOG announced that the AGM for FY2019 will be held in mid-June
                       2020.

                     • Raised the aggregate leverage limit for S-REITs from 45% to 50%.
MAS - Amendment
                     • MAS expects S-REIT managers to carefully assess the S-REITs’ ability
 to the Guidelines     to service financial obligations before taking on additional debt.

 MOF and IRAS -      • S-REITs have up to 12 months to distribute at least 90% of their taxable
                       income after end-FY2020 to qualify for tax transparency.
  Notice on Tax      • S-REITs have up to 31 Dec 21 to distribute at least 90% of their taxable
  Transparency         income derived in FY2020.

                                                                                                  27
MARKET
OUTLOOK &
 STRATEGY
MARKET OUTLOOK : SINGAPORE

                                                                 • MTI estimates Singapore’s 1Q 2020 economy contracted by 2.2% y-o-y,
                                                                   a reversal of 1% growth in the previously quarter and a contraction of
                                                                   10.6% on a q-o-q seasonally-adjusted annualised basis compared to
                                                                   the 0.6% growth experienced in 4Q 2019.
            Singapore
                                                                 • Manufacturing moderated downward by 0.5% on a y-o-y basis in 1Q
            Economy                                                2020 compared to the 2.3% decrease in 4Q 2019 mainly due to decline
                                                                   in the electronics and chemicals clusters. This is given the fall in
                                                                   external demand as global economic activity has slowed due to the
                                                                   ongoing COVID-19 outbreak.(1)

                                                                 • Overall industrial property market occupancy rate remained relatively
                                                                   unchanged at 89.2% in 1Q 2020 as compared to 4Q 2019, but lowered
                                                                   marginally by 0.1% y-o-y. Meanwhile,1Q 2020 industrial space prices
                                                                   and rental indexes fell slightly by 0.4% and 0.1% respectively as
            Singapore                                              compared to 4Q 2019. (2)
            Industrial                                           • According to CBRE, while industrial market leasing performance
              Market                                               remained relatively stable in the first two months of 1Q 2020, the
                                                                   impact of the COVID-19 pandemic was visible in March, which saw
                                                                   lower factory and warehouse rents. Demand during the quarter was
                                                                   also mostly driven by the third-party logistics, e-commerce,
                                                                   pharmaceutical and chemical sectors. (3)

Notes:
(1) Ministry of Trade and Industry (MTI), Press Release, “Singapore’s GDP Contracted by 2.2 Per Cent in the First Quarter of 2020. MTI Downgrades 2020 GDP Growth Forecast to “-4.0 to -1.0 Per Cent”, 26 March 2020.
(2) JTC Quarterly Market Report, Industrial Properties, 1Q 2020.                                                                                                                                                        29
(3) CBRE Research, Q1 2020, Cold feet from COVID-19, Singapore.
MARKET OUTLOOK : SINGAPORE

         Moderated Supply Pipeline; Soft Outlook on Business Environment

                    Singapore Warehouse Annual Net Completion, Absorption and Vacancy Rate (%)
1,000                                                                                                                                                                  16.0

 900                                                                                                               1Q 2020 Warehouse
                                                                                                                                                                       14.0
                                                                                                                     Vacancy: 12.5%
 800
                                                                                                                                                                       12.0
 700

                                                                                                                           Grey bars refer to supply space             10.0
 600
                                                                                                                           that has been committed. Figures
 500                                                                                                                       for 2020-2023 are based on total            8.0
                                                                                                                           new supply and projected take up
 400                                                                                                                       of the new supply on a GFA basis.
                                                                                                                                                                       6.0
 300
                                                                                                                                                                       4.0
 200
                                                                                                                                                                       2.0
 100

   -                                                                                                                                                                   0.0
          2009       2010       2011       2012       2013       2014       2015      2016      2017     2018      2019    2020 (E)   2021 (E)   2022 (E)   2023 (E)

                             Annual Net Warehouse Completion                                 Annual Net Warehouse Absorption
                             Average Annual Net Supply (Past 10 Years) '000 sqm LHS          Singapore Warehouse Year-End Vacancy Rate (%) RHS

Source: JTC J-Space / JTC Quarterly Market Report - Industrial Properties, 1Q 2020.                                                                                     30
MARKET OUTLOOK : AUSTRALIA

                                                          • RBA noted considerable uncertainty in the near term outlook. Much
                                                            is dependent on efforts to contain the Covid-19 outbreak and the
                                                            period required for social distancing measures.
            Australia                                     • A large economic contraction is expected in the second quarter.
            Economy                                       • However, the Government’s monetary and fiscal response,
                                                            accompanied with bank measures, will soften the expected
                                                            contraction, help to ensure that the economy is well poised for
                                                            recovery once this pandemic has passed and restrictions are
                                                            removed.(1)

                                                       • Consumer staples continue to be a significant and stable long-term
            Australia                                    driver for the industrial sector.
            Industrial                                 • Domestic population growth and global demand influences, especially
              Market                                     within APAC, will continue to further drive the industrial/logistics sector
                                                         in the short to long term.(2)

Notes:
(1) Statement by Philip Lowe, Governor: Monetary Policy Decision, 7 April 2020.
(2) JLL Research, Australian Industrial Investment, Review & Outlook 2020 Report.
                                                                                                                                   31
MARKET OUTLOOK : AUSTRALIA

       Muted Growth Outlook Expected Ahead; Fundamentals Remain Strong

• RBA lowered the cash rate to 0.25% in view of the COVID-19 outbreak.
• Series of comprehensive packages rolled-out to support the economy.
• Industrial sector continues to be highly sought-after, underpinned by stable long-term factors.
• Occupier demand for industrial stock remains strong, and vacancy is at a historic low.
• Australia’s gross industrial floorspace take-up in 2019 was in line with the 10-yr annual avg at 2.1 mil sqm.

Australian Gross Industrial Floorspace Take-Up, 2009 to 2019                          Cash Rate

 Source: RBA / Australian Bureau of Statistics / JLL Research
                                                                                                                  32
VISION & STRATEGY

              Provide highest quality, best-in-class
         logistics real estate solutions to our customers

                           OUR MISSION:
                             Long-Term
                         Sustainable Growth
                          in DPU and NAV
                              per Unit

                                                            33
VISION & STRATEGY

                               3 Focus Areas for Sustainable Earnings
                                  and Growth over the Longer Term

                                                                                                Focused AEIs &
      Asset Management                               Acquisitions
                                                                                                 Development

 ▪ Maintain high occupancy,             ▪ Leverage on broad Asia-Pac mandate and         ▪ Explore AEI, redevelopment and
   improve income margin                  continue to execute Portfolio                    Build-to-Suit opportunities
                                          Rebalancing & Growth Strategy for              ▪ Maintain attractiveness and
 ▪ Stabilize portfolio income; ensure     earnings growth and sustainability
   longevity of returns                                                                    competitiveness of assets
                                        ▪ Prudently manage assets & capital              ▪ Optimize portfolio performance
 ▪ Maintain prudent capital and risk      recycling – review potential of selling
   management                                                                              and unlock value
                                          lower yielding properties, redeploy into
 ▪ Manage lease renewals by close         higher-yield / better performing assets with   ▪ Utilize under-developed plot ratio
   engagement with tenants                upside                                           to increase NLA and rental revenue
 ▪ Secure longer-term relationships     ▪ Pursue freehold assets:                        ▪ Increase rental and WALE by
   with strong credit-worthy tenants                                                       rentalizing AEI works and
                                         • To preserve and grow NAV                        improvements for tenants
                                         • Increase proportion of income return          ▪ Leverage on strengths of -
                                           generated by revenue from freehold
                                           assets                                         • Track Record
                                        ▪ Right-price leasehold properties and            • ARA and LOGOS Depth &
                                          associated risk                                   Support
                                        ▪ Seek longer WALE profile and incorporate        • Strategic Relationships of
                                          annual rent step-ups where possible to            tenants, funds as potential
                                          improve sustainability and income                 partners as well as developers
                                          performance

                                                                                                                                34
CONTACT INFORMATION

                      For enquiries:
                      Cassandra Seet                ARA LOGOS Logistics Trust Management
                      Manager, Investor Relations   Limited
                      cassandraseet@ara-group.com   5 Temasek Boulevard #12-01
                                                    Suntec Tower Five
                                                    Singapore 038985
                                                    Tel: +65 6835 9232
                                                    Website: www.aralogos-reit.com

                                                                                           35
DISCLAIMER

This presentation has been prepared by ARA LOGOS Logistics Trust Management Limited, in its capacity as the manager of ALOG (the “Manager”) and includes
market and industry data and forecast that have been obtained from internal survey, reports and studies, where appropriate, as well as market research, publicly
available information and industry publications. Industry publications, surveys and forecasts generally state that the information they contain has been obtained from
sources believed to be reliable, but there can be no assurance as to the accuracy or completeness of such included information. While the Manager has taken
reasonable steps to ensure that the information is extracted accurately and in its proper context, none of the Manager or any of its officers, representatives, affiliates
or advisers has independently verified any of the data from third party sources or ascertained the underlying economic assumptions relied upon therein.

No representation or warranty, express or implied, is made as to the fairness, accuracy, completeness or correctness of the information, opinions and conclusions
contained in this presentation. The information contained in this presentation, unless otherwise specified, is only current as at the date of this presentation. To the
maximum extent permitted by law, the Manager and its officers, directors, employees and agents disclaim any liability (including, without limitation, any liability arising
from fault or negligence) for any loss howsoever arising, whether directly or indirectly, from any use, reliance or distribution of this presentation or its contents or
otherwise arising in connection with it.

Investors have no right to request the Manager to redeem their Units while the Units are listed. It is intended that unitholders of ALOG (“Unitholders”) may only deal
in their Units through trading on Singapore Exchange Securities Trading Limited (the “SGX-ST”). Listing of the units in ALOG (the “Units”) on the SGX-ST does not
guarantee a liquid market for the Units.

The value of the Units and the income from them may fall as well as rise. Units are not obligations of, deposits in, or guaranteed by, the Manager or any of its
affiliates. An investment in Units is subject to investment risks, including the possible loss of the principal amount invested.

This presentation may contain forward-looking statements and financial information that involve assumptions, risks and uncertainties based on the Manager’s current
view of future events. Actual future performance, outcomes and results may differ materially from those expressed in the forward-looking statements and financial
information as a result of risks, uncertainties and assumptions – representative examples include, without limitation, general economic and industry conditions,
interest rate trends, cost of capital, capital availability, shifts in expected levels of property rental income, change in operating expenses, property expenses and
government and public policy changes and continued availability of financing in the amounts and the terms necessary to support future business. You are cautioned
not to place undue reliance on these forward-looking statements and financial information, which are based on numerous assumptions regarding the Manager’s
present and future business strategies and the environment in which ALOG or the Manager will operate in the future. The Manager expressly disclaims any obligation
or undertaking to release publicly any updates or revisions to any forward-looking statement or financial information contained in this presentation to reflect any
change in the Manager’s expectations with regard thereto or any change in events, conditions or circumstances on which any such statement or information is based,
subject to compliance with all applicable laws and regulations and/or the rules of the SGX-ST and/or any other regulatory or supervisory body or agency. The past
performance of ALOG and the Manager is not necessarily indicative of the future performance of ALOG and the Manager.

                                                                                                                                                                         36
You can also read