Economic impacts of Myrtle rust - A dynamic CGE assessment
←
→
Page content transcription
If your browser does not render page correctly, please read the page content below
Economic impacts of Myrtle
rust
A dynamic CGE assessment

NZIER final report to Ministry for Primary Industries
August 2017
About NZIER
NZIER is a specialist consulting firm that uses applied economic research and analysis
to provide a wide range of strategic advice to clients in the public and private sectors,
throughout New Zealand and Australia, and further afield.
NZIER is also known for its long-established Quarterly Survey of Business Opinion and
Quarterly Predictions.
Our aim is to be the premier centre of applied economic research in New Zealand. We
pride ourselves on our reputation for independence and delivering quality analysis in
the right form, and at the right time, for our clients. We ensure quality through
teamwork on individual projects, critical review at internal seminars, and by peer
review at various stages through a project by a senior staff member otherwise not
involved in the project.
Each year NZIER devotes resources to undertake and make freely available economic
research and thinking aimed at promoting a better understanding of New Zealand’s
important economic challenges.
NZIER was established in 1958.

Authorship
This paper was prepared at NZIER by John Ballingall and Daniel Pambudi.
It was quality approved by Peter Clough.
Cover phot is from MPI website.

L13 Grant Thornton House, 215 Lambton Quay | PO Box 3479, Wellington 6140
Tel +64 4 472 1880 | econ@nzier.org.nz
© NZ Institute of Economic Research (Inc) 2012. Cover image © Dreamstime.com
NZIER’s standard terms of engagement for contract research can be found at www.nzier.org.nz.
While NZIER will use all reasonable endeavours in undertaking contract research and producing reports to ensure the
information is as accurate as practicable, the Institute, its contributors, employees, and Board shall not be liable (whether in
contract, tort (including negligence), equity or on any other basis) for any loss or damage sustained by any person relying on
such work whatever the cause of such loss or damage.

Key points
Myrtle rust is likely to have a limited, but non-trivial, macroeconomic
impact on New Zealand
     •     Our dynamic Computable General Equilibrium modelling suggests the short-
           run impacts of Myrtle rust are likely to be very small on an economywide
           basis, though could inflict more significant financial pain on individual
           nurseries, feijoa and guava growers, and Mānuka honey producers.
     •     Further out, Myrtle rust could lead to real GDP falling by between $144
           million and $411 million relative to baseline by 2030.
     •     The key driver of this economic loss is a drop in Mānuka honey productivity
           of between 3.5% and 10.5%, accumulated over 10 years as Myrtle rust
           spreads.
     •     Feijoa and guava exports and domestic sales also fall, but since these
           sectors are so small, this has very little macroeconomic impact.
     •     Nursery production is also negatively affected on an ongoing basis,
           primarily due to higher Myrtle rust management and monitoring costs.

If Mānuka honey production is more severely affected by Myrtle rust
than we or industry anticipate, the economic impacts are larger
     •     In a worst-case scenario requested by MPI, we have modelled a 50% fall in
           Mānuka honey productivity for likely at-risk regions that account for an
           estimated 70% of current production.
     •     In this scenario, real GDP falls by up to $1.0 billion below baseline by 2030.

Employment and wage growth will decline marginally
     •     As GDP dips below baseline, labour market demand also softens very
           slightly. This leads to weaker employment growth and real wage growth,
           but again these impacts are very small in the short-term.
     •     As Myrtle rust takes hold more widely, the labour market effects increase
           slightly, but remain relatively modest. By 2030, real wages are between
           0.028% and 0.084% lower than baseline.
     •     Employment starts to return to its long-run baseline this far out in our
           projection period, so there are minimal negative impacts on job growth.

These results should be seen as indicative only, given uncertainties
surrounding Myrtle rust in New Zealand
     •     There is little detailed information available on how Myrtle rust might play
           out in New Zealand. While we have overseas experiences with the fungus
           to draw on in designing our scenarios, we cannot be certain about how it
           will react to the New Zealand climate or plant life.
     •     We have tried to reflect this uncertainty by modelling four scenarios. The
           changes in parameters (or ‘shocks’) in these scenarios were based on

NZIER report -Economic impacts of Myrtle rust                                               i
discussions with representatives from directly affected industries and
officials.
• Should more information become available about the spread and severity
of impact of Myrtle rust in New Zealand, these scenarios can be re-visited
with ease.
• The macroeconomic impacts modelled are driven almost entirely by
reduced productivity in the Mānuka honey sector. An important
assumption in our modelling is that Mānuka honey sector grows strongly in
our baseline scenario (i.e. with no Myrtle rust), reaching $1.2 billion of
exports by 2028 as per the sector’s Primary Growth Partnership aspirations.
• Should the Mānuka honey sector grow less rapidly than this in the baseline
(i.e. if pre-Myrtle rust industry expectations aren’t met), then the
macroeconomic impacts we present here are potentially on the high side.
More research is required to explore other potential drivers of economic
and social loss
• We have focused here on the potential commercial impacts of Myrtle rust,
based on discussions we have had with likely at-risk sectors. We have not
been able to explore the costs to New Zealand of – for example – iconic
species such as pōhutukawa being treated, destroyed and replaced.
• For example, Wellington City Council estimates there are 4,000
pōhutukawa trees on Wellington’s streets, and 15-20,000 elsewhere in the
city. Removal costs, including traffic control, are estimated to be around
$300 per hour, and larger trees can take a day or more to remove.
• Clearly such treatment and/or removal requirements would impose
significant costs on Councils and the Department of Conservation, and
would have huge impacts on the social and cultural wellbeing of many New
Zealanders.
• The fact that we have not quantified these costs should not be taken as an
indication that we think they are not important – just that we do not yet
have sufficient information to hand to incorporate them into our modelling
framework.
NZIER report -Economic impacts of Myrtle rust iiContents
1. Scope and objectives ...................................................................................... 1
1.1. What is Myrtle rust? ................................................................ 1
1.2. How might it affect New Zealand? .......................................... 1
1.3. Our task.................................................................................... 1
1.4. Out of scope............................................................................. 2
2. Modelling approach ....................................................................................... 3
2.1. Overview of model .................................................................. 3
2.2. Scenario design ........................................................................ 3
3. Modelling results ............................................................................................ 8
3.1. What would we expect to see? ............................................... 8
3.2. Direct impacts .......................................................................... 8
3.3. Indirect impacts ..................................................................... 10
3.4. Labour market impacts .......................................................... 11
3.5. Macroeconomic impacts ....................................................... 12
3.6. The importance of the Mānuka honey BAU to the overall results
............................................................................................... 14
4. Conclusions................................................................................................... 15
5. References .................................................................................................... 16
Appendices
Appendix A Details of CGE model ................................................................................ 17
Figures
Figure 1 Impacts of Myrtle rust on real GDP and real household consumption ....................... 12
Figure 2 Impacts of Myrtle rust on economywide export volumes ........................................... 13
Figure 3 Structure of CGE model to examine Myrtle rust impacts ............................................ 17
Tables
Table 1 Regional distribution of honey production ..................................................................... 5
Table 2 Description of modelling scenarios ................................................................................. 7
Table 3 Summary of direct impacts – volumes ............................................................................ 8
Table 4 Summary of direct impacts – values ............................................................................... 9
Table 5 Direct impacts on feijoas and guavas............................................................................ 10
Table 6 Indirect impacts for High scenario, 2030 ...................................................................... 11
Table 7 Summary of labour market impacts ............................................................................. 11
NZIER report -Economic impacts of Myrtle rust iiiNZIER report -Economic impacts of Myrtle rust iv
1. Scope and objectives
We have been asked to estimate the potential macroeconomic impacts of the
incursion of Myrtle rust into New Zealand.

1.1.          What is Myrtle rust?
Myrtle rust (Austropuccinia psidii) is a fungus that affects New Zealand’s native trees,
including pōhutukawa, mānuka, rata, ramarama and swamp maire, as well as some
production trees such as feijoa, guava and eucalyptus.
Myrtle rust has been present in Australia and Raoul Island for several years, and was
detected in mainland New Zealand for the first time in early May 2017. It has now been
found in Northland, Taranaki, Bay of Plenty and the Waikato.
The Myrtle rust fungus attacks new plant growth, can affect seed development and
repeated infections can kill plants.

1.2.          How might it affect New Zealand?
Myrtle rust could affect the New Zealand economy in a wide range of ways:
     •     Lower exports of products from plants affected by the fungus.
     •     Disruptions to nurseries due to having to monitor and manage Myrtle rust.
     •     Impacts on plant retailers from having to switch to other types of plants.
     •     Household gardeners may need to change their purchases of plants away
           from myrtaceous species towards species that are not at risk from Myrtle
           rust, which may lower their utility.
     •     Treatment and replacement costs for local councils to deal with affected
           plants or trees.
     •     Biodiversity costs should iconic native species such as pōhutukawa get
           affected.
     •     Potential concerns over New Zealand’s clean and green reputation, and any
           associated risks to tourism or other primary exports.
     •     Higher costs to government agencies for monitoring and managing Myrtle
           rust.

1.3.          Our task
We have been asked to explore the commercial economic impacts of the invasion of
Myrtle rust, focusing on macroeconomic measures such as GDP, exports, employment
and wages.
We use NZIER’s dynamic Computable General Equilibrium (CGE) model of the New
Zealand economy to estimate these impacts for a range of potential scenarios. We
have previously used this approach to explore the economic impacts of Foot and
Mouth Disease, velvetleaf and the Brown Marmorated Stink Bug.

NZIER report -Economic impacts of Myrtle rust                                           1
1.4. Out of scope
Many of the potential impacts of Myrtle rust are not easily captured within a
macroeconomic modelling framework. We have limited our modelling work to focus
on commercial economic impacts, which means we do not estimate:
• Biodiversity losses – we recognise their importance, but understand these
will be addressed through other research commissioned by MPI.
• Impacts on domestic gardens – we assume that over time, gardeners will
use non-threatened species in their gardens instead.
• Any risk from reputational damage to New Zealand’s ‘clean and green’
brand.1
• Regional impacts – we are exploring national-level impacts only.
• Treatment or removal costs for Councils to address Myrtle rust-affected
species such as pōhutukawa. According to Wellington City Council2, there
are up to 24,000 pōhutukawa in the city, of which 4,000 are located on
streets. The cost of treating or removing these trees due to Myrtle rust is
around $300 per hour once traffic control is included. Since large trees
could take a day or more to remove, the costs to Councils (and hence
ratepayers) would be significant.
• Any fiscal implications of compensation by government to industry – we
treat these as a transfer between different parts of the economy, rather
than any new cost or benefit. We also assume the additional costs to
government agencies for managing and monitoring Myrtle rust are funded
within existing baselines by reprioritising activities.
All of these impacts will increase the economic costs of Myrtle rust compared to those
modelled here. Therefore, our analysis of the commercial economic impacts should be
seen as a lower bound.
We also recognise that the costs of Myrtle rust to individual nurseries, producers or
exporters could be significant. However, our focus is on the aggregate economywide
impacts.
There is considerable uncertainty about the severity of the potential impacts, both in
terms of the science and economics. We attempt to explore some of these
uncertainties through the design of modelling scenarios. However, it is important to
note that our estimates can only ever be indicative of direction and magnitude, rather
than precise forecasts.
1
It could be argued that the damage to or death of iconic trees such as pōhutukawa could have an impact on New Zealand’s
attractiveness as a tourism destination, but this seems like a long bow to draw. International visitors come to New Zealand
for a range of reasons, and we think it unlikely that tourists would not come because of the potential for Myrtle rust to
affect trees, no matter how beautiful they are. In any case, determining the magnitude of this impact would be almost
impossible in practice due to a lack of data.
2
A. Benbrook. (2017). Personal Communication.
NZIER report -Economic impacts of Myrtle rust 22. Modelling approach
2.1. Overview of model
We use our dynamic CGE model of the New Zealand economy to estimate the potential
macroeconomic impacts of Myrtle rust. We have also used this model to examine the
potential impacts of Foot and Mouth Disease, velvetleaf and Brown Marmorated Stink
Bug in New Zealand.3
The MONASH-NZ dynamic CGE model is a representation of the New Zealand economy
that contains information on 106 industries and 201 commodities in its basic form.
The model captures the various inter-linkages between these sectors, as well as their
links to households (via the labour market), the government sector, capital markets
and the global economy (via imports and exports).
Our model is based on the Australian version of the MONASH model, now known as
‘VU-National’. We summarise the key features of the model in Appendix A. A technical
description of the model is provided in Dixon and Rimmer (2002).
We first project the New Zealand economy out to 2030 to provide a baseline or
business as usual (BAU) scenario. We then design scenarios to represent the
commercial economic impacts of Myrtle rust, and shock the model to see how the New
Zealand economy deviates away from this baseline.
We have augmented the underlying database to incorporate a separate honey sector.
The BAU scenario for honey reflects industry expectations of growth to $1.2 billion of
mānuka honey exports by 2028.
2.2. Scenario design
There is limited scientific or economic evidence on how Myrtle rust affects an
economy. The precise impacts depend on the strain of the fungus, meteorological
conditions, climate, etc.
As such, we have based our scenario design on discussions with officials and industry
stakeholders, rather than drawing material directly from the international and New
Zealand literature.
2.2.1. Affected sectors
Based on our discussions with officials and industry, we identified the sectors most
likely to be directly commercially impacted by Myrtle rust to be:
• Mānuka honey (2016 export value of around $232 million4)
• Plantation forestry
• Nurseries
3
See Schilling et al (2014), Ballingall et al (2017a and 217b), respectively.
4
HS code 0409.00.00.09 - Honey; natural honey, extracted, in retail packs.
NZIER report -Economic impacts of Myrtle rust 3• Feijoas ($462,000)
• Guavas ($28,400)
The next step was to determine how significantly each sector might be affected. We
outline the key points of our discussions with industry below.
2.2.2. Mānuka honey
Our industry contacts (Apiculture NZ and Comvita) are not convinced that mānuka
yields will be significantly impacted. That is based on the Australian experience, where
there was considerable initial concern about production losses, but where the actual
impacts have been limited in practice.
Industry has seen no scientific or economic evidence that hints at any significant yield
losses in Australia, although they recognise it may be a “slow burn” that could yet to
happen.
Our contacts suggested that the impacts would range from “very minor” to “minor”,
depending on the region of production. Northland mānuka honey producers might
expect to suffer more than (say) South Island producers, due to differences in climate.
Industry also expects that if one region is negatively affected by Myrtle rust over time,
then production will instead shift to regions that are not at risk. Therefore, the NZ Inc
production impacts should be small, and limited to a slight decrease in nationwide
productivity from production occurring being weighted slightly more to slightly less
productive regions.5
A similar story exists for new plantings. While some regions might decide to put
investments on hold, there may instead be more in regions that are not at risk. Again,
the national impacts should be very small.
Mānuka honey production data is not available by region. However, MPI’s data shows
the following distribution of honey production across New Zealand (Table 1).
In lieu of any other data, we assume mānuka has the same overall regional distribution
as honey in total. We further assume that mānuka is unlikely to be affected in the
South Island (30% of national production) due to cooler climatic conditions.
That leaves 70% of the national mānuka crop at risk from Myrtle rust.
Based on our discussions with industry, we designed scenarios that see production
from this 70% of the mānuka crop fall by 5/10/15% from the business as usual, over
a period of 10 years.
At the request of MPI, we also consider a worst-case sensitivity analysis that considers
a 50% production decrease.
5
Our dynamic CGE model focuses on nationwide economic impacts, rather than regional impacts. However, we build up the
nationwide modelling shocks from regional data.
NZIER report -Economic impacts of Myrtle rust 4Table 1 Regional distribution of honey production
Honey producing region 6-year average Share of NZ
production, tonnes production
North Island
Northland/Auckland/Hauraki Plains 2,060 13%
Waikato/King Country/Taupo 2,393 15%
Coromandel/BOP/Poverty Bay/Rotorua 2,578 16%
Hawke's Bay/Wairarapa/Manawatu/Taranaki/Wellington 4,045 26%
South Island
Marlborough/Nelson/West Coast 1,215 8%
Canterbury/Kaikoura 1,964 12%
Otago/Southland 1,557 10%
New Zealand 15,809 100%
Source: MPI, 2016
2.2.3. Plantation forestry
Based on our discussions with the Forest Owners Association, the plantation forestry
industry is not overly concerned about the commercial physical impacts of Myrtle rust.
Eucalypts – the most at-risk plantation forestry species – are not a particularly
important commercial genus in New Zealand and of the more than 700 species of
eucalypts, only about four are currently grown for commercial purposes.
They are used primarily for pulp and paper manufacturing, but can easily be
substituted for other hardwood species such as poplar. Many eucalypts are grown in
the South Island and Central North Island, which may not be as susceptible to Myrtle
rust as other more temperate regions.
The main impacts on the conservation forest are likely to be related to iconic species
such as pōhutukawa, which have limited direct commercial value.
Industry’s biggest concern is that to manage and/or eradicate Myrtle rust, MPI
resources could be diverted away from other industry priorities. We cannot reliably
estimate this ‘opportunity cost’ argument.
We therefore suggest the commercial implications of Myrtle rust for the plantation
forestry sector are likely to be too small to model within a CGE framework.
2.2.4. Nursery production
Industry (NZ Plant Producers Incorporated) indicated to us that there’s very little hard
data available to gauge aggregate industry-wide impacts of Myrtle rust.
Some back-of-the-envelope calculations by NZ Plant Producers Incorporated (NZPPI)
suggested around $75 million of output is at risk from Myrtle rust (i.e. myrtaceous
species). But this is a nationwide estimate, so can’t be taken as the ‘true’ value of
output that could be lost, since not all regions are likely to be adversely affected.
NZIER report -Economic impacts of Myrtle rust 5There could be some downstream impacts if nurseries with large volume contracts
with big retailers (Mitre 10, The Warehouse and Bunnings, etc.) are not able to fulfil
those contracted deliveries due to the short term MPI response to Myrtle rust (i.e. if
they must shut down temporarily). But there would be some substitution away from
these affected nurseries to unaffected nurseries instead.
In May, Mitre 10, The Warehouse and Bunnings (collectively some 70% of garden
retail) instigated full or partial restrictions on stocking myrtaceae. This came about
over their need to mitigate the impact of MPI’s response should Myrtle rust be
detected in a store, and uncertainty over whether the response would impact just the
garden retail department or the whole of store. Simply, they cannot afford to have the
whole store shut.
We also consider a small production decrease (and price increase) in the nursery
sector in the short term (we assume the next two years).
Longer term, the impacts would likely be felt through higher costs of production across
the nursery industry (i.e. for all businesses involved). This will be due to higher
monitoring and fungicide treatment costs (preventative and curative) required to
manage Myrtle rust. With such monitoring and treatment, there should be no lasting
output impacts.
And even if myrtaceous species are affected, nurseries can choose to supply other
species instead.6
Industry estimates are for an overall 10% increase in production costs for myrtaceous
species’ share of nurseries’ total supply of plants. Industry data suggests this share to
be around 15% ($75 million from total nursery output of ~$500 million).
This equates to at most a 1.5% increase in costs for the nursery sector in the medium-
long term. We model this as a decrease in productivity.
Using the same production shares, we also consider Low/Medium/High short term
output impacts of 1.5/3/5% for the nursery sector (i.e. 10/20/33% of myrtaceous
species’ output being lost). We model this as a productivity loss, which effectively
reduces output and pushes production costs up. This automatically flows through to
the garden retail sector though the linkages in our CGE database, as fewer plants will
be available.
2.2.5. Guavas and feijoas
We could find little information in the literature or from industry on how Myrtle rust
might affect New Zealand production and export of guavas and feijoas.
These are not large export crops (in 2016: feijoas $462,000; guavas: $28,400).
We use Low/Medium/High scenarios of 10/25/50% falls in export values for these
sectors combined. We also consider the impacts on New Zealand consumption of
these fruits, since much of the output of these sectors is destined for households (from
gardens) or domestic retail, rather than export.
6
It could be argued that this would lead to a decrease in consumer surplus as buyers would not be able to buy their preferred
species, but this would be difficult to estimate with any degree of confidence, and certainly not within a CGE modelling
framework. It could also be argued that changes in consumer preferences might drive this change in production
composition (i.e. gardeners not wanting to risk having myrtaceous species in their gardens).
NZIER report -Economic impacts of Myrtle rust 6These are admittedly speculative and arbitrary, but will have very limited economic
impact due to the small size of the sectors.
2.2.6. Summary of scenarios
Table 2 Description of modelling scenarios
Scenario Mānuka Nursery production Feijoas and guavas
Low (L) Productivity falls for 70% Productivity falls by 10% loss in export values;
of sector by 5% from BAU 0.225% from BAU from 10% drop in domestic
over period of 10 years 2017-2018, then falls by sales
(2017-2026) with S-shaped 0.45% over 2019 -2030.
spread.
Medium As in Low, but 10% As in Low, but 0.45% then 25% loss in export values;
(M) productivity fall 0.9% productivity falls. 25% drop in domestic
sales
High (H) As in Low, but 15% As in Low, but 0.75% then 50% loss in export values;
productivity fall 1.5% productivity falls. 50% drop in domestic
sales
Worst case As in Low, but with 50% As in High. 50% loss in export values;
(WC) productivity fall 50% drop in domestic
sales
Source: NZIER
NZIER report -Economic impacts of Myrtle rust 73. Modelling results
3.1. What would we expect to see?
The direct impacts of Myrtle Rust are to reduce production in the Mānuka honey,
nurseries and feijoas and guavas sectors. This then reduces exports.
The indirect impacts for the wider economy will vary considerably across industries in
direction and size, depending on the nature of each industry.
We would expect resources (land, labour, capital) to move away from these directly
affected sectors into their next best alternative use – largely other agricultural and
horticultural activities. The expected result is increased output in these ‘competing’
sectors.
All non-directly affected export sectors will benefit slightly from the depreciation in
the New Zealand dollar that results from a decrease in Mānuka honey, feijoa and guava
exports. This includes manufacturing exporters, other primary exporters and services
exporters (especially those related to tourism).
We would expect these sectors to increase their exports because they are marginally
more internationally competitive due to the weaker currency, which will partially
offset the direct negative export impacts on Mānuka, feijoa and guava exports. Lower
real wages (see below) will also marginally reduce these exporters’ costs of production.
As the economy shrinks slightly due to the directly affected sectors’ output falling, we
would expect the economywide demand for labour to drop. Real wages will also fall.
These factors reduce household income, which will reduce their demand for
domestically-consumed services such as retail, grocery shopping, construction, etc.
The macroeconomic impacts will be the net effects of these various changes.
3.2. Direct impacts
Table 3 shows the percentage change from BAU in the output volumes of Mānuka
honey and nurseries, for each of our four scenarios. We present the results for 2020
and 2030, being representative of short term and long term impacts respectively.
Table 3 Summary of direct impacts – volumes
% change from BAU, volumes
Sector 2020 2030
L M H WC L M H WC
Nurseries -1.00 -1.99 -3.30 -3.29 -0.96 -1.91 -3.18 -2.97
Mānuka -0.90 -1.81 -2.71 -9.03 -6.80 -13.58 -20.41 -72.38
Source: NZIER
NZIER report -Economic impacts of Myrtle rust 8The output impacts on Mānuka are small to begin with, and then increase significantly
later in the projection period, reflecting our assumption about Myrtle rust spreading
across New Zealand over time in an S-shaped curve.
In our High scenario, output losses reach just over 20% below BAU by 2030.
In addition to the Mānuka honey productivity decreases that we assume, the sector
also loses labour, land (especially) and capital to competing uses in the primary sector
as profitability drops. It therefore suffers a double whammy: it loses resources, and
the resources it retains are less productive after Myrtle rust starts to take hold.
The nursery sector faces a much flatter profile for its output losses. This is because the
sector experiences similar cost increases – modelled as small productivity losses – in
both the short term (the initial adjustment to Myrtle rust) and longer term (prevention
and management of Myrtle rust).
At most, our estimates suggest nurseries output will drop by 3.2% below BAU in the
long term.7
Table 4 shows the change in the value of output of Mānuka and nurseries across the
various scenarios. In all scenarios apart from the Low scenario, nurseries see slightly
smaller dollar value falls in output than Mānuka in the short term. These drops reflect
the treatment costs and output losses facing nurseries due to the initial spread of
Myrtle rust. In the short term, Mānuka is relatively unaffected due to our assumptions
about the rate of spread of Myrtle rust.
However, once Myrtle rust is established, the losses to the Mānuka honey sector
escalate rapidly, and dwarf those of nurseries. In our High scenario, the value of
Mānuka production could be up to $466 million below BAU by 2030.
Table 4 Summary of direct impacts – values
% change from BAU, value of output, $millions, nominal
Sector 2020 2030
L M H WC L M H WC
Nurseries -4.9 -9.8 -16.4 -16.2 -7.2 -14.4 -24.0 -21.9
Mānuka -6.9 -13.7 -20.6 -69.9 -150.1 -304.6 -465.8 -1977.9
Source: NZIER
Feijoas and guavas are part of a much larger composite “Other fruit” sector in our
database. We do not report this composite sector’s results as the changes are tiny due
to the very small production and export of feijoas and guavas. However, the initial
shocks that we imposed on the model are summarised in Table 5Table 5
7
Recall that in the Worst-case scenario, only the Mānuka sector suffers a much more serious output loss due to Myrtle rust.
The shocks for nurseries and feijoas and guavas are the same as in the High scenario. The very minor differences in Table 3
for nurseries between the High and Worst-case scenarios are due to small resource reallocation effects when we impose all
shocks simultaneously.
NZIER report -Economic impacts of Myrtle rust 9Table 5 Direct impacts on feijoas and guavas
Change in $ value, 2017
Low Medium High Worst-case
Value of exports $50,000 $125,000 $250,000 $250,000
Value of domestic consumption $380,000 $950,000 $1.9 million $1.9 million
Source: NZIER, FreshFacts 2016
3.3. Indirect impacts
Our model database contains 106 sectors, all of which are impacted directly or
indirectly in some shape or form by the changes to the New Zealand economy that
result from Myrtle rust. As explained in section 3.1, indirect impacts affect various
types of sectors:
• Competing sectors – resources will move away from shrinking sectors
(Mānuka, nurseries, etc.) towards sectors that compete for resources with
them, such as other types of primary sector activities. These resources will
also be available at slightly lower cost.
• Exporting sectors – as Mānuka and feijoa and guava exports fall due to
Myrtle rust, this places slight downward pressure on the New Zealand
dollar. This very small depreciation improves the competitiveness of all
other exporters (dairy, manufacturing exporters, tourism, etc.) which boost
their exports.
• Supplying sectors – sectors that supply Myrtle rust-affected sectors, such as
transport, packaging and construction services, will also suffer from the
slowdown caused by Myrtle rust.
• Downstream sectors – as domestic production drops and export income
falls after Myrtle rust spreads, real wages and employment drop marginally
across the economy. This leads to lower household income and spending,
which will negatively affect sectors such as retail, recreation services,
groceries, and telecommunication services.
Lower government tax revenue as the economy soften leads to marginally
lower spending on social services, education and health.
These indirect effects are generally small (less than $10 million up or down, even in
the High scenario).
Table 6 presents some of the larger indirect impacts for the High scenario only, and a
full list of results is available on request.
NZIER report -Economic impacts of Myrtle rust 10Table 6 Indirect impacts for High scenario, 2030
Change in value of output for selected sectors, $ millions, High scenario, 2030
Sector Change in value Driver(s) of change
of output, $m
Dairy product manufacturing $67.51 NZ$, cheaper resources
Dairy cattle farming $53.42 Resource reallocation
Air and space transport $32.35 Tourism growth due to NZ$
Seafood processing $20.76 NZ$
Machinery manufacturing $23.65 NZ$
Horticulture and fruit growing $22.50 Resource reallocation
Sheep, beef cattle, and grain farming $15.65 Resource reallocation
Advertising, market research, and $14.98 Composition of economy shifts towards
management services manufacturing and services, which use
these services more than primary sector
Electricity generation -$12.48 Lower use by nurseries
Supermarket and grocery stores -$17.32 Lower household incomes
Construction services -$24.33 Lower use by Myrtle rust-affected
sectors, plus lower household demand
Residential property operation -$48.12 Lower household incomes
Source: NZIER
3.4. Labour market impacts
As Myrtle rust spreads and output falls in at-risk sectors, the economy grows slightly
slower than in the BAU. This reduces the overall demand for labour.
In our model, we have sticky real wages, so the short-term impacts of lower labour
demand are seen through reductions in economywide employment and real wages.
Further out, employment returns gradually to its long-term equilibrium and labour
market impacts are felt mainly through real wages.
As Table 7 shows, these impacts are not large. Under the High scenario, real wages
drop by 0.081% below BAU by 2030. Therefore, Myrtle rust is not expected to have
significant impacts on economywide jobs or wages.
Table 7 Summary of labour market impacts
% change from BAU, economywide
Sector 2020 2030
L M H WC L M H WC
Employment -0.002 -0.003 -0.005 -0.012 -0.002 -0.003 -0.004 -0.012
Real wages -0.002 -0.005 -0.008 -0.014 -0.028 -0.056 -0.084 -0.253
Source: NZIER
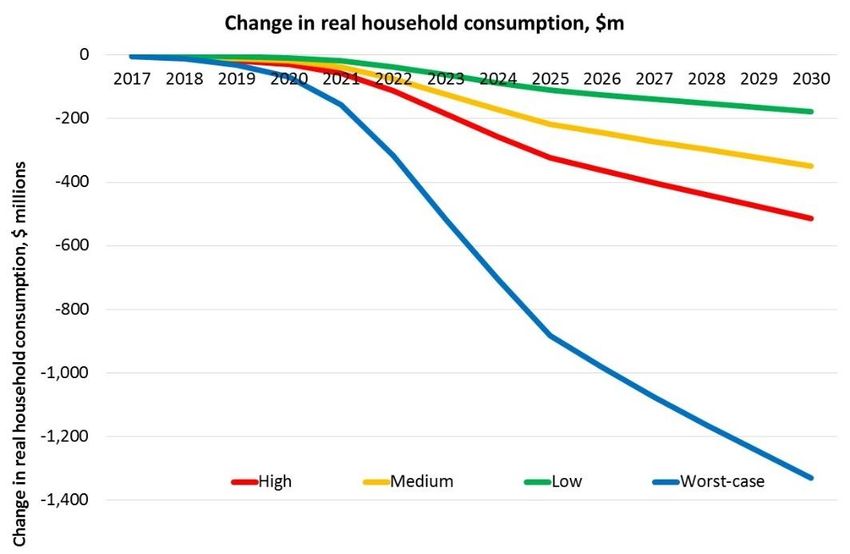
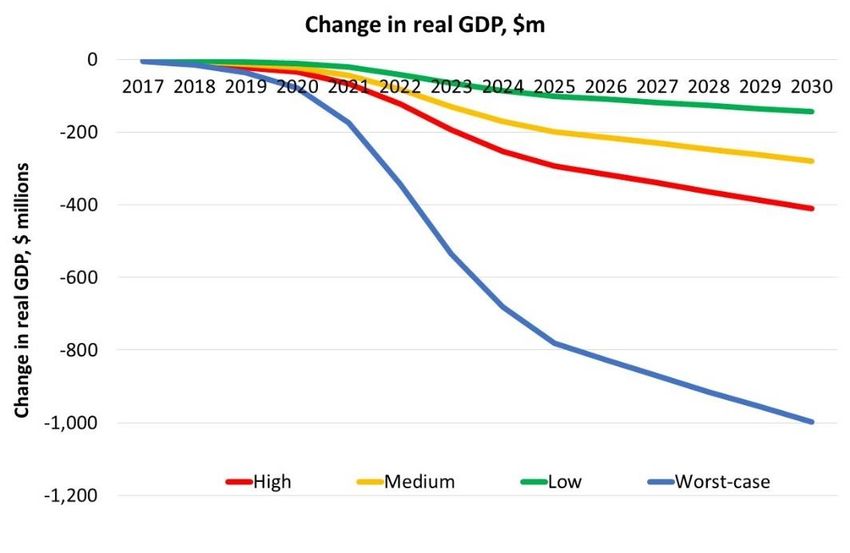
NZIER report -Economic impacts of Myrtle rust 113.5. Macroeconomic impacts Myrtle rust has minimal short-run impacts on New Zealand’s GDP. By 2020, New Zealand’s real GDP is between $11.4 million and $35.2 million lower than BAU in our central three scenarios. Even under the Worst-case scenario, real GDP is only $78.5 million (or 0.026%) lower by 2020. Figure 1 Impacts of Myrtle rust on real GDP and real household consumption Change from BAU, $ millions Source: NZIER NZIER report -Economic impacts of Myrtle rust 12
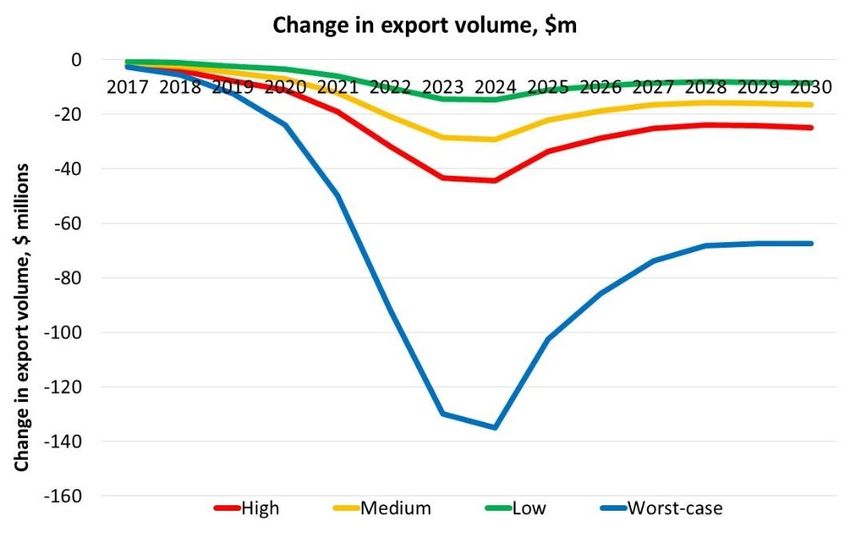
As Myrtle rust spreads, the macroeconomic impacts become more significant. By 2030,
real GDP would be between $144.3 million (0.028%) and $411.0 million (0.081%) lower
than BAU for our central scenarios, with a Worst-case impact of $998.3 million
(0.196%).
Real household consumption follows similar patterns to real GDP in levels, but is higher
in percentage change terms. This is due to the impacts of lower employment and real
wages affecting household incomes, along with the slight depreciation on the New
Zealand dollar, which makes imported consumer items marginally more expensive
(this reducing purchasing power).
Figure 2 below shows the impact of Myrtle rust on economywide exports. The top
chart shows how the S-shaped spread of the fungus plays out on export volumes – with
only small impacts in the early years, which then expand rapidly as Myrtle rust takes
hold more widely.
Recall that these charts are for economywide exports, so Myrtle rust-affected sectors’
export decreases are partially offset by expansion in other export sectors (e.g. dairy
manufacturing, tourism, etc.).

Figure 2 Impacts of Myrtle rust on economywide export volumes
Change from BAU, $ millions

Source: NZIER

NZIER report -Economic impacts of Myrtle rust                                        13
3.6.             The importance of the Mānuka honey
                 BAU to the overall results
Our BAU projections incorporate the Mānuka honey sector’s expected – or hoped for
– growth that will see exports rise to $1.2 billion by 2028 under a Primary Growth
Partnership approach.8 Therefore, as Myrtle rust spreads across the sector over time,
its productivity-decreasing impacts will be affecting a larger and larger base.
This leads to even small percentage changes having fairly large impacts on Mānuka
honey output and exports. To the extent that our BAU projection is over-optimistic,
then the Mānuka results – and the economywide costs – presented here are likely to
be over-estimated.
However, as noted in section 1.4, there are many potential economic costs that we
have not been able quantify in this modelling exercise, given time, resource and data
constraints. These would likely push up the macroeconomic costs for any given
scenario considered.

8
    See https://mpi.govt.nz/funding-and-programmes/primary-growth-partnership/primary-growth-partnership-programmes/high-
    performance-manuka-plantations/

NZIER report -Economic impacts of Myrtle rust                                                                          14
4. Conclusions The arrival of Myrtle rust in New Zealand has led to concerns about its potential impact on the New Zealand economy and society. This study has focused on estimating the commercial economic impacts of the fungus, under various scenarios that reflect uncertainty over its likely spread and severity of effects on at-risk sectors such as nurseries, Mānuka honey and feijoas and guavas. We find that the short-term economic impacts of Myrtle rust are likely to be limited. By 2020, New Zealand’s real GDP could be between $11.38 million and $35.19 million lower than BAU in our central three scenarios. Further out, the economic impacts start to be more significant, especially if the Mānuka honey sector suffers ongoing and relatively severe productivity losses. By 2030, real GDP would be between $144 million and $411 million lower than BAU for our central scenarios, with a Worst-case impact of $998 million. Should Myrtle rust start to damage iconic native species such as pōhutukawa, and a widespread treatment and replacement programme be implemented by central or local government agencies, we would expect much higher economic costs and social losses than those we have modelled here. As an illustrative example, removing a single large pōhutukawa tree could cost up to $2,500, and in Wellington City alone there are 19 – 24,000 pōhutukawa, of which 4,000 are located on streets. Estimating these costs is an avenue for future research. NZIER report -Economic impacts of Myrtle rust 15
5. References
Ballingall, J., D. Pambudi and P. Clough. 2017a. ‘The economic impacts of velvetleaf: A
dynamic CGE modelling analysis’. NZIER report to Ministry for Primary Industries,
February 2017.
Ballingall, J., D. Pambudi and P. Clough. 2017b. ‘Quantifying the economic impacts of
a Brown Marmorated Stink Bug incursion in New Zealand: A dynamic Computable
General Equilibrium modelling assessment’. NZIER report to Horticulture NZ, July
2017.
Benbrook, A. (2017). Personal Communication. Email 19 June 2017.
Dixon, P. and M. Rimmer. 2002. Dynamic General Equilibrium Modelling for
Forecasting and Policy: a Practical Guide and Documentation of MONASH.
Melbourne: North Holland.
New Zealand Horticulture. 2016. ‘Fresh Facts 2016’.
MPI. 2016. ‘2016 Apiculture Monitoring Report’.
https://www.mpi.govt.nz/document-vault/16621
NZIER. 2017. Quarterly Predictions: March 2017. Wellington: NZIER.
Schilling, C, Corong, E, Destremau, K, Ballingall, J. 2014. ‘Economic effects of a Foot
and Mouth Disease incursion in New Zealand – A dynamic CGE analysis’. NZIER report
to Ministry for Primary Industries. Wellington, New Zealand.
Statistics New Zealand. 2016. National Accounts input-output tables: Year ended
March 2013.

NZIER report -Economic impacts of Myrtle rust                                        16
Appendix A Details of CGE
model
A visual representation is shown in Figure 2, highlighting the complex and
multidirectional relationships between the various parts of an economy.

Figure 3 Structure of CGE model to examine Myrtle rust impacts

                                                                         Capital flows

                    Imports
                                          Global                               Imports
                       Exports           economy

         Productive sector

                                         Goods & services
      Myrtle rust-affected
                                             Labour                            Households
            sectors
                                             Wages

                                                                                         Government
                                                                          Tax
                                                                                          services

                                         Goods & services
          Other sectors                                                    Government
                                  Taxes & subsidies (compensation)

                                                        Government borrowing

                                          Financial
                    Investment                                                                   Spending
                                          markets

Source: NZIER

Key features of the model
     •       It is a large-scale macroeconomic model, designed for answering “what if?”
             questions. It is not a detailed farm-level spreadsheet model.
     •       It covers 106 sectors that produce 201 goods and services (or
             ‘commodities’). The model database is derived from Statistics New
             Zealand’s input-output tables, which show all the sales and purchases
             between these sectors, and from these sectors to the final consumer (i.e.
             Kiwi households or exports).
     •       Production inputs are intermediate inputs (domestic and imported) and
             primary factors (labour, land and capital).
     •       The demand for primary factors and the choice between imported and
             domestic commodities are determined by Constant Elasticity of
             Substitution (CES) production nests. This means an increase in price of one
             input shifts sourcing towards another input.

NZIER report -Economic impacts of Myrtle rust                                                               17
• Intermediate goods, primary factors and other costs are combined using a
Leontief production function. This means the proportion of production
inputs is held constant for all levels of output.
• The production mix of each industry is dependent on the relative prices of
each commodity. The proportion of output exported or consumed
domestically is also dependent on relative prices.
• The model assumes that the amount of resources (land, labour, capital) in
the economy are fixed in any single year. Therefore, if one sector (e.g.
mānuka honey) needs less labour, more labour is available for use
elsewhere (e.g. dairy).
• This means that there are always winners and losers from any imposed
change to the economy. Some sectors shrink; others expand. The overall
economic impact is the net effect of the wins and losses.
The model’s dynamic adjustment features
The model is dynamic, meaning that we can examine changes to the economy due to
shocks such as Myrtle rust incursion over time and see how key variables respond as
the economy returns to its long run growth path.
MONASH-NZ is a recursive dynamic CGE model. It can be thought of as a series of static
simulations linked by three dynamic adjustment procedures:
1. Labour market adjustment: We assume that wages are sticky (i.e. don’t change
much) in the short run and gradually adjust over time. This means that labour
market effects are initially seen through changes to employment. As employment
returns to equilibrium over time, the labour market returns to equilibrium
through changes in real wages.
2. Capital formation: An industry-specific capital accumulation mechanism allows
industries to build their stock of capital over time. Capital is generated by
investment, which in turn responds to rates of return in each industry.
3. Balance of payments adjustment: The model tracks changes in the current
account and capital account over time. Changes in net foreign liabilities affect
domestic consumption through the level of interest that must be paid to service
the foreign debt.
Core data is based on Statistics New Zealand’s input output tables
The model is based on a large database containing the value flows of the economy.
The database defines the initial structure of the economy, which is assumed to be in
equilibrium in all markets.
The structure of the database is broadly similar to a traditional input-output table. For
example, commodities may be used as intermediate inputs for further production,
used in investment, exported or consumed by households and the government.
Industry costs include the cost of intermediates, margins, taxes and primary factor
costs for labour, land and capital.
NZIER report -Economic impacts of Myrtle rust 18The database is sourced initially from Statistics New Zealand’s 2013 Inter-Industry tables (Statistics New Zealand, 2016). To provide a baseline (or BAU) against which to compare the effects of a Myrtle rust incursion, we project the model out to 2030 using NZIER’s Quarterly Predictions (NZIER. 2017) macroeconomic forecasts and longer term projections based on labour force growth and productivity assumptions. NZIER’s Quarterly Predictions forecasts include NZIER’s views on commodity prices, global economic growth, export growth, interest rates, exchange rates, etc. Since the model solves in percentage changes from the baseline or BAU, the precise level of the baseline is not critical to our findings. NZIER report -Economic impacts of Myrtle rust 19
You can also read