Extreme rainfall in New Zealand and its association with Atmospheric Rivers - IOPscience
←
→
Page content transcription
If your browser does not render page correctly, please read the page content below

LETTER • OPEN ACCESS

Extreme rainfall in New Zealand and its association with Atmospheric
Rivers
To cite this article: Kimberley J Reid et al 2021 Environ. Res. Lett. 16 044012

View the article online for updates and enhancements.

                                This content was downloaded from IP address 46.4.80.155 on 14/04/2021 at 14:26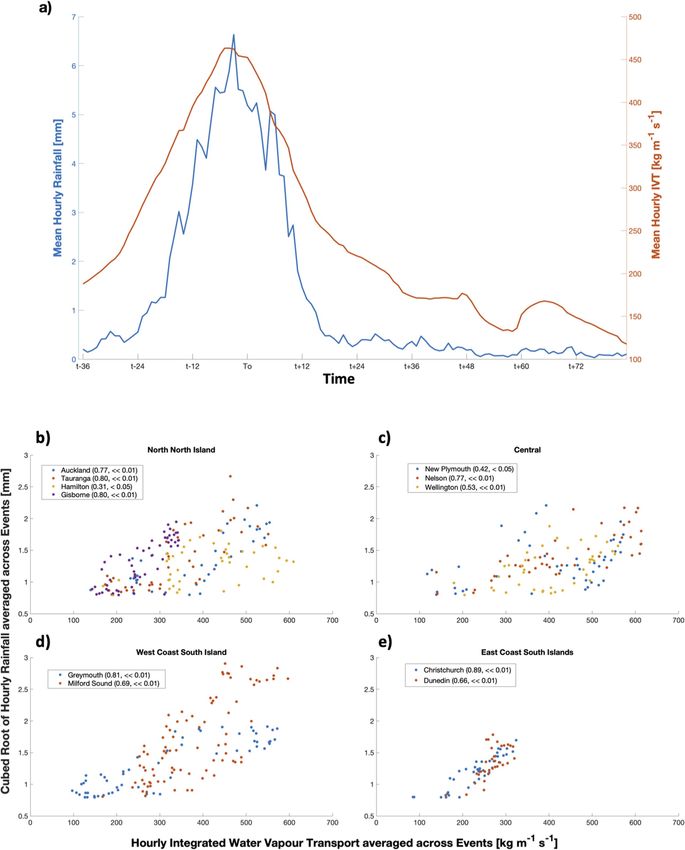
Environ. Res. Lett. 16 (2021) 044012 https://doi.org/10.1088/1748-9326/abeae0
LETTER
Extreme rainfall in New Zealand and its association with
OPEN ACCESS
Atmospheric Rivers
RECEIVED
16 September 2020 Kimberley J Reid1,∗, Suzanne M Rosier2, Luke J Harrington3,4, Andrew D King1 and Todd P Lane1
REVISED 1
19 February 2021 The School of Earth Sciences and ARC Centre of Excellence for Climate Extremes, The University of Melbourne, Parkville, Victoria,
Australia
ACCEPTED FOR PUBLICATION 2
The National Institute of Water and Atmospheric Research, Wellington, New Zealand
1 March 2021 3
Environmental Change Institute, University of Oxford, Oxford, United Kingdom
PUBLISHED 4
New Zealand Climate Change Research Institute, School of Geography, Environment and Earth Sciences, Victoria University of
12 March 2021
Wellington, Wellington, New Zealand
∗
Author to whom any correspondence should be addressed.
Original content from
this work may be used E-mail: kimberleyr@student.unimelb.edu.au
under the terms of the
Creative Commons Keywords: rainfall extremes, atmospheric rivers, New Zealand, flooding
Attribution 4.0 licence.
Supplementary material for this article is available online
Any further distribution
of this work must
maintain attribution to
the author(s) and the title Abstract
of the work, journal
citation and DOI. Atmospheric rivers (ARs) are narrow and elongated regions of enhanced horizontal water vapour
transport. Considerable research on understanding Northern Hemisphere ARs and their
relationship with extreme precipitation has shown that ARs have a strong association with heavy
rainfall and flooding. While there has been very little work on ARs in the Southern Hemisphere,
global climatologies suggest that ARs are equally as common in both hemispheres. New Zealand in
particular is located in a region of high AR frequency. This study aims to test the hypothesis that
ARs play a significant role in heavy precipitation and flooding events in New Zealand. We used a
recently developed AR identification method and daily station data across New Zealand to test for
the concurrence of ARs and extreme rainfall. We found that, at each of the eleven stations analysed,
at least seven to all ten of the top ten heaviest precipitation days between 1980 and 2018 were
associated with AR conditions. Nine of the ten most damaging floods in New Zealand between 2007
and 2017 occurred during AR events. These results have important implications for understanding
extreme rainfall in New Zealand, and ultimately for predicting some of the most hazardous events
in the region. This work also highlights that more research on ARs in New Zealand is needed.
1. Introduction Zealand between 1968 and 1984 cost $NZ 353 mil-
lion collectively (adjusted for inflation to 2020 Q3
New Zealand is located between 34 and 47◦ S, with using the New Zealand Reserve Bank inflation calcu-
a mountain range extending the length of the North lator www.rbnz.govt.nz/monetary-policy/inflation-
and South Islands in the path of the prevailing mid- calculator). More recently, the Insurance Council of
latitude westerlies. Broadly speaking, there are four New Zealand estimated that the 12 most expensive
main rainfall regimes: uplift and rainfall from fronts floods between 2007 and 2017 cost $NZ 472 million
and cyclones within the westerlies; orographically (ICNZ; Frame et al 2020).
enhanced rainfall; free convection and thunderstorm ARs are long, narrow regions of intense water
development triggered by summer heating; and sub- vapour transport (Newell et al 1992). The Guan and
tropical synoptic systems from the north (Tait and Waliser (2015) global climatology of ARs found a high
Fitzharris 1998). This research focuses on the hypo- frequency of landfalling ARs along coastal regions
thesis that atmospheric rivers (ARs) play an import- of Australia and New Zealand (NZ). Moreover, they
ant role in New Zealand’s rainfall and its extremes. found that AR frequency peaked at approximately
Flooding from heavy rainfall is one of the many 41◦ S, coinciding with the mean latitude of NZ.
hazards faced by New Zealanders. Ericksen (1986) Thus, NZ appears to be a location of high AR
estimated that the nine most serious floods in New activity.
© 2021 The Author(s). Published by IOP Publishing Ltd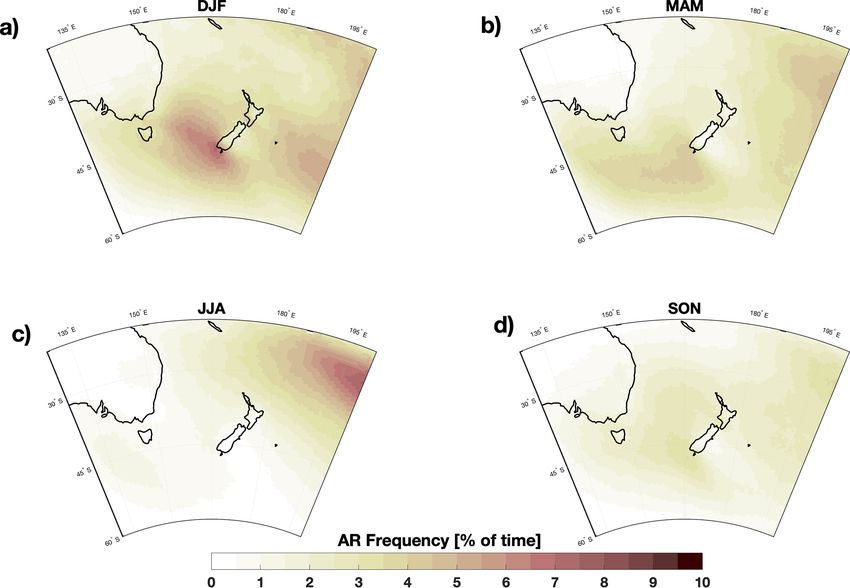
Environ. Res. Lett. 16 (2021) 044012                                                                    K J Reid et al

     Ralph et al (2006) was one of the first studies       frequently over NZ and can cause extreme rainfall
to empirically link ARs with extreme weather. They         and flooding, especially where the prevailing wester-
analysed seven floods that occurred on the Russian         lies meet the mountain ranges, there is currently no
River, California, between October 1997 and Feb-           study explicitly documenting the role of ARs in New
ruary 2006 using radar and satellite observations of       Zealand extreme rainfall and flooding comprehens-
wind and integrated water vapour respectively. It was      ively for the whole country.
found that all seven floods were associated with heavy          In this article, we aim to build on this previ-
rainfall caused by orographic precipitation associated     ous work by analysing the most extreme rainfall days
with ARs. Nayak and Villarini (2017) analysed Cent-        (since 1980, or thereafter) at each of 11 stations
ral USA hydrological impacts of ARs using station          throughout NZ, and also the most damaging recent
records of 60–80 years. From these long-term records       flooding events (as measured by insured losses). In
they showed that annually about 40% of daily extreme       both cases, we determine the extent to which ARs are
precipitation events (defined as above the 99th per-       associated with extreme rainfall and flooding in New
centile) were associated with ARs and up to 70%–90%        Zealand.
of extreme rainfall events in winter were associated
with ARs.                                                  2. Data and methods
     While North American-focused analyses of ARs
and their impacts dominate the AR literature, there        2.1. Heavy rainfall and flooding data
have been a number of studies demonstrating that           We used daily rainfall data from the New Zealand
ARs have considerable impacts elsewhere. Lavers et al      National Climate Database at 11 stations across
(2011) described ARs as critical in explaining extreme     New Zealand: Auckland, Christchurch, Dunedin,
winter flooding in the UK and demonstrated that ARs        Gisborne, Greymouth, Hamilton, Milford Sound,
were responsible for the ten largest winter floods in      Nelson, New Plymouth, Tauranga and Wellington
Britain since the 1970s. Additionally, ARs have been       (figure 1).
associated with extreme precipitation and flooding              Almost all were automatic weather stations at
leading to considerable socio-economic impacts over        which daily rainfall accumulations were measured
the Iberian Peninsula (Ramos et al 2015, Eiras-Barca       using standard tipping bucket rain gauges with a res-
et al 2018). In the Southern Hemisphere, about half of     olution of 0.2 mm; at one station (Milford Sound)
the extreme daily rainfall in Central-Southern Chile is    the record used was a manual rain gauge reading
associated with ARs (Valenzuela and Garreaud 2019),        (at 9 am daily) at a resolution of 0.1 mm. The tip-
while around 70% of extreme winter rainfall was asso-      ping bucket technique tends to under-record rain-
ciated with ARs in South Africa (Blamey et al 2018).       fall amounts compared to the manual process; how-
Paltan et al (2017) modelled the global relationship       ever, the use of data from both techniques was not
between AR rainfall and hydrological parameters and        deemed to be a significant issue for the purposes of
found that more than 50% of mean annual runoff             this study, namely identifying the dates of the most
on the west coast and North Island of New Zealand          extreme rainfall amounts. At each location, the sta-
was associated with AR precipitation. Studies from         tion was chosen to maximise the length and com-
around the world have shown that ARs can have sig-         pleteness of the record, whilst also stipulating that the
nificant impacts like extreme rainfall and associated      record finish in the present.
flooding due to the very large volume of moisture the           At each station, we ranked daily rainfall amounts
systems can transport. However, most of the literat-       to find the days of the top ten daily rainfalls. In order
ure has focused on the Northern Hemisphere, with           to have ten (temporally) independent days to exam-
Southern Hemisphere ARs relatively under-studied.          ine, we stipulated that if any of the top ten days were
     Regarding New Zealand, Kingston et al (2016)          within one week of each other, we only retained the
analysed the role of ARs in contributing to floods         single day with the highest rainfall amount. We used
via enhanced snowmelt on the NZ Southern Alps              rainfall events between 1980 and 2018 to coincide
due to both rain on snow causing melting and the           with the available AR data (see section 2.2). We also
advection of warmer air masses from the northwest.         analysed the top ten costliest floods between 2007
They found that all eight major winter floods on the       and 2017 as determined by insured losses from the
Waitaki River (South Island) between 1979 and 2012         Insurance Council of New Zealand (ICNZ; Frame
were associated with ARs. A separate study (Little et al   et al 2020); we did so in order to investigate socio-
2019) found ARs to influence both extreme ablation         economic impacts of extreme rainfall, as well as
and snowfall on the NZ Southern Alps, while Cullen         the rainfall itself. By investigating the relationship
et al (2019) and Porhemmat et al (2020) showed a           between ARs and costly impacts we hope to encour-
link between ARs and the largest snowfall events in        age future research aimed at forecasting ARs at daily
the same region. Some case studies of extreme rain-        to seasonal scales, together with its implications for
fall events in New Zealand have indicated an influ-        emergency management (Lavers et al 2014). It is
ence of ARs (Dean et al 2013, Rosier et al 2015).          worth noting that the costs of these flooding events
However, despite previous indications that ARs occur       have likely been underestimated given that the metric

                                              2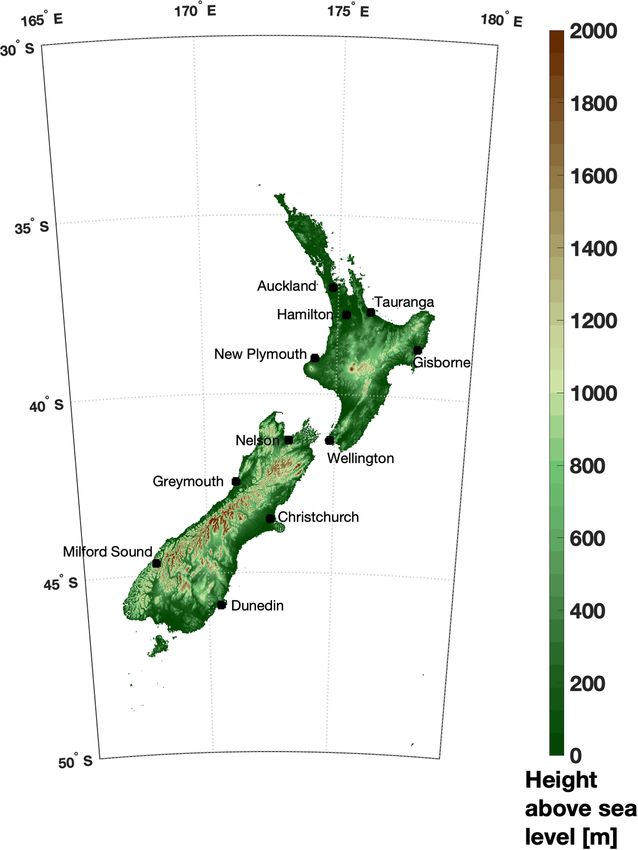
Environ. Res. Lett. 16 (2021) 044012                                                                                 K J Reid et al

   Figure 1. Map of New Zealand topography and stations used in this study (elevation data courtesy of NASA WorldWind and data
   from the Shuttle Radar Topography Mission).

of insured losses does not include publicly owned                 and minor axes lengths, orientation angle (relative
assets and damage to uninsured property (Frame et al              to line of latitude), and mean and maximum IVT.
2020).                                                            The algorithm then excludes potential ARs if they do
                                                                  not meet the following criteria: major axis length is
2.2. AR identification                                            greater than 2000 km, length to width ratio is greater
We used the Reid et al (2020) AR identification                   than two, and the orientation angle relative to latit-
algorithm where the boundary of an AR is defined as               ude is greater than 10◦ (to exclude the Inter-Tropical
integrated water vapour transport (IVT) greater than              Convergence Zone).
or equal to 500 kg m−1 s−1 . We chose to use an iden-                 We calculated AR frequency using the Reid et al
tification method with an absolute IVT threshold as               (2020) algorithm for NZ (figure 2). We found a strong
recommended, by Rutz et al (2019), for midlatitude                seasonal cycle in AR occurrence and the highest fre-
studies. Additionally, we use a restrictive threshold             quency in Austral summer (December January Feb-
of 500 kg m−1 s−1 because of the risk identified in               ruary; DJF) over New Zealand. This is distinct from
Reid et al (2020) that lower-threshold algorithms with            North American and European west coast analyses
some geometric criteria may miss the most intense                 that have found that ARs are more frequent in the
ARs. IVT was calculated using the three hourly                    cooler months (Rutz et al 2019). However, studies
Modern-Era Retrospective analysis for Research and                in the Northwest Pacific also found that AR fre-
Applications Version 2 reanalysis (MERRA2; Gelaro                 quency peaked in the warm season. This has been
et al 2017) as part of the Atmospheric River Tracking             linked to atmosphere-ocean coupling in the trop-
Method Intercomparison Project (ARTMIP; Shields                   ical Indian and Pacific Oceans, as opposed to the
et al 2018). The Reid et al identification algorithm              more midlatitude driven ARs that dominate east-
identifies spatially continuous regions of IVT above              ern ocean basins (Kamae et al 2017, Pan and Lu
the selected threshold and then calculates geometric              2020). A secondary region of high AR frequency is
parameters including: AR centroid location, major                 apparent in winter (June July August; JJA) although

                                                    3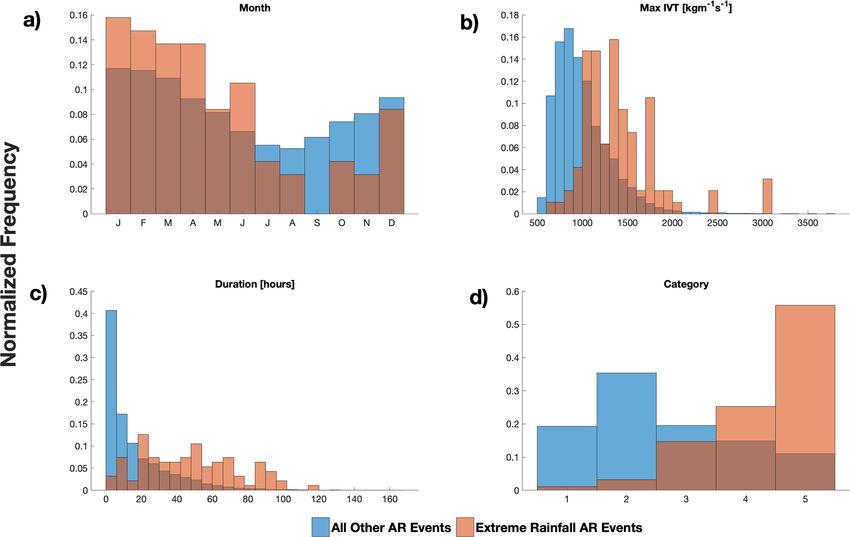
Environ. Res. Lett. 16 (2021) 044012                                                                                     K J Reid et al

            Figure 2. Percentage of times (three hourly intervals) between 1980 and 2018 when an AR is present, by season.

somewhat further from New Zealand land. These                       Table 1. Number of the top ten rainfall events that were associated
                                                                    with an AR for each station.
ARs occur well to the northeast of the country
but are entirely consistent with previous studies                                                  Number of top ten rainfall
(Rosier et al 2015 supplementary material (available                 Station                      events associated with an AR
online at stacks.iop.org/ERL/16/044012/mmedia)),                     Auckland                                     9
which found ARs in the northeast brought onshore by                  Christchurch                                 8
(north)easterly flow to be an important mechanism                    Dunedin                                      9
in winter extreme rainfall events (see also figure 4).               Gisborne                                     8
More work is needed to understand the drivers of the                 Greymouth                                    9
AR annual cycle in the Australasian region. Figure 2                 Hamilton                                     8
shows a distinct AR shadow on the lee side of the                    Milford Sound                                9
                                                                     Nelson                                       9
New Zealand mountain ranges for all seasons with
                                                                     New Plymouth                                 8
a stronger signal over and in the lee side of the                    Tauranga                                     7
South Island where the mountains are taller. This                    Wellington                                  10
phenomenon has also been observed in the Western
USA where ARs typically decay after interacting with
orography and precipitating out moisture and wind                   Research (NIWA) historic weather events catalogue
speeds are reduced (Rutz et al 2015).                               (https://hwe.niwa.co.nz/).
    To test whether an AR was associated with an
extreme rainfall event, we produced an AR mask                      3. Results and discussion
(masking where an AR was identified) every 3 h
between 1980 and 2018, and in the region 130◦ E to                  Our results indicate a strong association between
200◦ E longitude and 15◦ S to 60◦ S latitude. If an                 damaging New Zealand precipitation events and ARs.
AR was identified over the location in question on                  Table 1 lists how many of the top ten precipitation
the day or day before the heavy rainfall or flooding                days at each station coincided with an AR event at that
event, that event was considered to be associated with              location. A more detailed list of each event is available
an AR. Figures 3(a) and (c) demonstrate examples                    in the supplementary material. About 60% of extreme
of masked ARs during the rank-one rainfall events at                rainfall events (regardless of an AR being present)
Milford Sound (West coast of the South Island) and                  occurred between January and April, while August
Auckland (Northwestern part of the North Island).                   and September combined account for 3.5% of events.
We further verified each event using satellite imagery              Six of the events were spatially concurrent at two sta-
(Knapp et al 2011), by looking for narrow, large-                   tions (e.g. Auckland and Tauranga; Christchurch and
scale cloudbands, and official reports by interrogat-               Wellington; Greymouth and Nelson) and one event
ing the National Institute of Water and Atmospheric                 occurred at three stations (Auckland, Hamilton and

                                                      4
Environ. Res. Lett. 16 (2021) 044012 K J Reid et al
Figure 3. (a) Mask showing identified AR during rank-one Milford Sound rainfall event (1800UTC, 21 January 1994),
(b) coloured contours are IVT during rank-one Milford Sound rainfall event and black contours are geopotential height at
850 hPa level, (c) and (d) are the same as (a) and (b) but for the rank-one Auckland rainfall event (0000UTC, 16 February 1985).
Black diamonds indicate locations in question.
Tauranga on the 5th of April, 2017). This is not sur- orographic forcing at Milford Sound led to a record
prising given these stations’ geographical proximity. 537.5 mm of rain falling in 24 h. Figure 3(d) shows
We found that, depending on the station, between the IVT field for the rank-one rainfall day at Auckland
seven and all ten of the top ten New Zealand rain- station (161.8 mm). In contrast to the previous case,
fall events were associated with ARs. All ten heaviest the AR and associated moisture came from the north-
rainfall events were associated with ARs at Welling- east. An extratropical cyclone to the northwest of
ton. Interestingly, most of the top ten extreme rain- the North Island and anticyclone to the east of NZ
fall days at Dunedin and Christchurch (East Coast advected the warm moist air towards Auckland and
South Island, figure 1) were still associated with ARs surrounding regions. This type of blocking pattern
(nine and eight respectively) despite being located in was identified by Kidson (2000) in his study of New
the aforementioned AR shadow. Both rank-one rain Zealand weather regimes and was associated with
events for Dunedin and Christchurch were associated enhanced precipitation in the northeast.
with ARs which had orientation angles between 70◦ We repeated this analysis for the ten costliest
to 80◦ . In comparison the rank-one Milford Sound floods between 2007 and 2017 as described by Frame
event shown in figures 3(a) and (b) had an AR ori- et al (2020). We found that nine of the ten floods
entation angle of approximately 40◦ . In other words, were associated with an AR event. Table 2 shows the
the most extreme rainfall days on the East coast were start and end time and location of each AR, together
associated with more meridional AR events. Despite with an indication of its mean and peak intensity
the AR shadow, east coast cities are still vulnerable to (IVT). In some cases, the AR was concurrent with
strong AR events. another weather event; for example, in the case of
Figure 3 illustrates the AR and IVT field for two flood rank-two, the AR transported enhanced mois-
case studies: the rank-one rainfall days at the Auck- ture from the remnants of TC Debbie towards New
land and Milford Sound stations. Figure 3(b) shows Zealand. The interaction between TCs and ARs have
the IVT field for the heaviest rain day at Milford been observed elsewhere. Cordeira et al (2013) ana-
Sound (1800UTC, 21 January 1994). The AR is linked lysed two ARs that made landfall in Northern Cali-
with tropical moisture from tropical cyclone (TC) fornia that had developed in conjunction with TCs
Rewa, which is situated to the northwest of Vanuatu. in the western North Pacific. Using parcel trajectory
This intense moisture transport combined with the analysis, they showed that the landfalling AR parcels
5Environ. Res. Lett. 16 (2021) 044012
Table 2. Top ten most expensive NZ floods between 2007 and 2017 and associated AR details.
Max daily IVT
Start centroid End centroid Mean daily max during event
Flood rank Year Date Location Cost ($m) AR Start time (lat, lon) End time (lat, lon) IVT (kg m s−1 ) (kg m s−1 )
6
1 2007 10–12 July North North Island 68.65 Yes 12UTC 10 July (−27 179.4) 00UTC 13 July (−22.5192.5) 1155 1434
2 2017 3–7 April North Island 66.4 Yes 12UTC 6 April (−43.0,188.1) 12UTC 7 April (−45.0,198.1) 1073 1116
3 2013 19–22 April Nelson, Bay of Plenty 46.2 No — — — — — —
4 2017 7–12 March Upper North Island 41.7 Yes 00UTC 6 March (−30.0,162.5) 15UTC 12 March (−42.5193.8) 1065 1232
5 2015 18–21 June Lower North Island 41.5 Yes 00UTC 17 June (−36.5156.2) 12UTC 22 June (−39.5194.4) 890 1019
6 2016 23–24 March West Coast—Nelson 30.2 Yes 06UTC 22 March (−38.0,168.8) 15UTC 24 March (−51.0, 189.4) 1424 1596
7 2015 2–4 June Otago 21.5 Yes 03UTC 1 June (−30.0,164.4) 21UTC 4 June (−45.5198.8) 753 930
8 2015 13–15 May Lower North Island 21.9 Yes 12UTC 12 May (−42.5181.9) 15UTC 17 May (−46.0, 198.8) 906 1063
9 2011 29-Jan Northland—BoP 19.8 Yes 21UTC 26 Jan (−24.5177.5) 06UTC 29 Jan (−41.0, 186.9) 1967 2297
10 2014 8–10 July Northland 18.8 Yes 12UTC 7 July (−26.5171.3) 21UTC 8 July (−28.0, 180.0) 1176 1397
K J Reid et alEnviron. Res. Lett. 16 (2021) 044012 K J Reid et al
Figure 4. Normalised histograms of (a) month of occurrence, (b) maximum IVT (kg m−1 s−1 ), (c) duration (h), (d) and
strength category (Ralph et al 2019) for all ARs between 135◦ and 200◦ longitude and −15◦ to −60◦ latitude, and from 1980 to
2018 (blue), and for the ARs associated with the top ten most extreme rainfall events for each station (brown).
originally underwent deep tropical ascent within the noted previously, this is consistent with our previous
TCs before traversing the North Pacific via the jet studies of winter events in which ARs to the north-
stream. The interaction between TCs and ARs in the east, brought onshore by (north)easterly flow, are
Tasman Sea is a potential area for future research in important. We speculate that this could be the domin-
understanding extreme rainfall in New Zealand. The ant mechanism leading to extreme rainfall in winter;
one flooding event that did not have an AR associated however, further investigation is necessary, and a
with it (rank-three) was due to complex extratrop- future study on this would be beneficial. Figure 4(b)
ical cyclones over the Tasman Sea (see supplement- summarises the maximum IVT. There is a statistic-
ary figure 1 for MSLP chart). The occurrence of an ally significant shift in the distribution of maximum
AR does not always lead to extreme rainfall, although IVT for ARs associated with extreme rainfall (p < 0.05
as tables 1 and 2 indicate, the most extreme rainfall using the Kolmogorov–Smirnov test) indicating that
events are unlikely without an AR. the ARs that lead to extreme rainfall are generally
Figure 4 summarises various different character- stronger than other ARs. However, there is also con-
istics of the ARs that were associated with the top siderable overlap between the two distributions sug-
ten rainfall events and puts them in context of ARs gesting that extreme rainfall can occur during a mod-
in the region more generally. Brown bars in the his- erate AR event. One such example is the rank-one
tograms represent the ARs associated with the top Auckland case described earlier where the interac-
ten rainfall events, whilst blue bars represent all AR tion with other synoptic features (extratropical cyc-
events from 1980 to 2018 in the region 135◦ E to lone) and convergence of tropical moisture due to
200◦ E, 15◦ S to 60◦ S. Figure 4(a) shows the nor- the blocking high to the east of NZ were important
malised frequency of AR occurrence in each month. factors for causing extreme rainfall from a moderate
Figure 2 showed ARs to be more frequent in Aus- AR. Figure 4(c) shows the distributions of AR event
tral summer; however, the annual cycle is seen to be duration. It is clearly seen that ARs associated with
more pronounced for ARs that lead to extreme rain- extreme rainfall tend to last longer.
fall. The peak in January to April (figure 4(a)) is likely The results of figures 4(b) and (c) are sum-
due to increased moisture availability in the warmer marised in figure 4(d) using the strength categor-
months and, as discussed previously, the interaction ies developed by Ralph et al (2019) that take into
with TCs. The difference in the seasonality of ARs account maximum IVT and duration: a category 1
associated with the top ten rainfall events (brown), AR would be considered weak and primarily bene-
compared with ARs in general (blue), hints at the ficial, while a category 5 AR would be considered
importance of ARs in extreme rainfall in winter. As strong and primarily hazardous. Category 5 ARs have
7Environ. Res. Lett. 16 (2021) 044012 K J Reid et al
Figure 5. (a) Composite of cubed-root of hourly rainfall (mm) and IVT (kg m−1 s−1 ) for the top ten rainfall events (associated
with an AR) for each station. Timeseries is relative to the maximum rainfall day for each event, and (b)–(e) scatterplot of
composite hourly IVT versus the cube root of composite hourly rainfall for each station and grouped by region. Rainfall is from
station data and IVT is from the ERA5 reanalysis for the 0.25◦ × 0.25◦ grid cell that included the station where the rainfall was
recorded. Numbers in brackets next to station name indicates the Spearman rank correlation coefficient (left) and p-value (right).
a maximum IVT value of 1250 kg m−1 s−1 and These AR categories are starting to be used in exper-
last for at least 24 h, or they may have a max IVT imental forecasts (DeFlorio et al 2019) and, thus, are
value between 1000 and 1250 kg m−1 s−1 but last worth examining here for relative impacts on rain-
for longer than 48 h. Given we use an AR threshold fall extremes. Figure 4(d) shows a strong shift towards
of 500 kg m−1 s−1 in our identification method, the higher category ARs being associated with extreme
range for a category 1 will be smaller than other stud- rainfall; while category 5 is the least common category
ies. In this study, a category 1 AR has a maximum for all AR events between 1980 and 2018, it is the
IVT value between 500 and 750 kg m−1 s−1 and dur- most common category for AR events that are asso-
ation less than 24 h (table 2 of Ralph et al 2019). ciated with extreme rainfall. A similar study of flood
8Environ. Res. Lett. 16 (2021) 044012 K J Reid et al
damage from ARs in the USA found that only a small 4. Conclusion
number of extreme ARs were responsible for a large
proportion of flood damages, and that flood damages Our analyses indicate that ARs are an important
increased exponentially with AR category (Corring- factor in producing damaging rainfall in New Zea-
ham et al 2019). land. Nine out of ten of the most expensive floods
Since the maximum IVT value of the AR asso- between 2007 and 2017 occurred during an AR event,
ciated with rainfall does not necessarily occur at the and seven to all of the ten heaviest precipitation days
same time and location as the rainfall at the station, at eleven stations analysed here were also associated
we also analysed the IVT at the grid cell over each with ARs. These results complement existing inter-
station. We used 5 d of hourly rainfall and IVT from national analyses on AR impacts which have found
the high resolution ERA5 reanalysis centred on the that ARs are vital for extreme hydrological events
highest rainfall day (Hersbach et al 2019). Given the (e.g. Ralph et al 2006, Lavers et al 2011). Despite
times used were relative to the event maximum, we the clear relationship between ARs and extreme rain-
could create a composite timeseries of all of the top- fall events in New Zealand that we have demon-
ten events for each station (figure 5(a)). We found strated here, there has been relatively little previ-
that, on average, the maximum hourly IVT and max- ous published research of the processes, forecast-
imum hourly rainfall at a station occurred simul- ing and projection of these damaging events. Fur-
taneously. There were individual events where the ther work should focus on better understanding the
maximum IVT occurred after the maximum rain- mechanisms that cause only some ARs to produce
fall (see supplementary figure 2) including the rank- heavy rainfall. Enhanced understanding of ARs and
one rainfall event at Auckland. We suspect this is due extreme precipitation, and the variability and trends
to the northerly AR acting as a moisture feeder to in ARs in the New Zealand region, should even-
the extratropical cyclone that was situated over Auck- tually improve the ability to predict high-impact
land and associated with the intense hourly rainfall events.
(figure 3(d); Dacre et al 2019). The centroid of the
AR passed over Auckland station after the cyclone had
moved away, hence the maximum IVT occurred after Data availability statement
the maximum rainfall. The interaction between ARs
and other synoptic systems is a potential avenue for The data that support the findings of this study are
further research. We show plots of rainfall and IVT openly available at the following URL/DOI: www.
for each of the top ten rainfall events at each station earthsystemgrid.org/dataset/ucar.cgd.ccsm4.artmip.
in supplementary figure 2. tier1.reid500.html.
To better understand the relationship between
IVT and rainfall, we also show scatter plots
(figures 5(b)–(e)) of hourly IVT versus the cube root
of hourly rainfall for each station (data are a compos- Acknowledgments
ites of all events as in figure 5(a), and only hourly rain-
fall values above 0.5 mm are included). The purpose The work of K J Reid was funded by an Australian
of taking the cube root of rainfall is to normalise the Government Research Training Program (RTP)
distribution and make it easier to compare stations Scholarship and the Australian Research Council
with different rainfall climatologies (Stidd 1953). We (ARC; DE180100638), the work of A D King was
grouped the stations into four regions: North North funded by the ARC (DE180100638), and the work of
Island, central, West and East coasts of the South T P Lane was funded by the ARC Centre of Excellence
Island. The coastal regions (figures 5(d) and (e)) have for Climate Extremes (CE170100023). S M Rosier
strong rainfall-IVT relationships, although the mag- was supported by funds from the New Zealand
nitude of IVT and rainfall is lowest on the East Coast. government via a NIWA Climate, Atmosphere and
Excluding Hamilton, the North North Island stations Hazards SSIF programme. L J Harrington and S M
have a very strong relationship between IVT and rain- Rosier were supported by the New Zealand MBIE
fall, but Hamilton itself has the weakest relationship Endeavour Fund Whakahura programme. We would
indicating that geographic region does not necessar- like to acknowledge high-performance computing
ily dictate the IVT–rainfall relationship. This suggests support from Cheyenne (doi:10.5065/D6RX99HX)
there may be some local factors that impact the effi- provided by NCAR’s Computational and Informa-
ciency of ARs, which is a potential avenue for future tion Systems Laboratory, sponsored by the National
research. The results in figure 5 increase confidence Science Foundation.
that the extreme rainfall events analysed in this study We are very grateful to Errol Lewthwaite, Linda
are associated with the passage of the AR over their Wang, Seema Singh and Andrew Harper for their help
location; however future studies would be beneficial with the station rainfall data from the NIWA National
for confirming this relationship. Climate Database.
9Environ. Res. Lett. 16 (2021) 044012 K J Reid et al
ORCID iDs Kidson J W 2000 An analysis of New Zealand synoptic types and
their use in defining weather regimes Int. J. Climatol.
20 299–316
Kimberley J Reid https://orcid.org/0000-0001-
Kingston D G, Lavers D A and Hannah D M 2016 Floods in the
5972-6015 Southern Alps of New Zealand: the importance of
Suzanne M Rosier https://orcid.org/0000-0002- atmospheric rivers Hydrol. Process. 30 5063–70
0673-5847 Knapp K R et al 2011 Globally gridded satellite observations for
climate studies Bull. Am. Meteorol. Soc. 92 893–907
Luke J Harrington https://orcid.org/0000-0002-
Lavers D A, Allan R P, Wood E F, Villarini G, Brayshaw D J and
1699-6119 Wade A J 2011 Winter floods in Britain are connected to
Andrew D King https://orcid.org/0000-0001- atmospheric rivers Geophys. Res. Lett. 38 n/a-n/a
9006-5745 Lavers D A, Pappenberger F and Zsoter E 2014 Extending
medium-range predictability of extreme hydrological events
Todd P Lane https://orcid.org/0000-0003-0171-
in Europe Nat. Commun. 5 781–797
6927 Little K, Kingston D G, Cullen N J and Gibson P B 2019 The role
of atmoshperic rivers for extreme ablation and snowfall
events in the Southern Alps of New Zealand Geophys. Res.
References Lett. 46 2761–71
Nayak M A and Villarini G 2017 A long-term perspective of the
Blamey R C, Ramos A M, Trigo R M, Tomé R and Reason C J C hydroclimatological impacts of atmospheric rivers over the
2018 The influence of atmospheric rivers over the South central United States Water Resour. Res. 53 1144–66
Atlantic on winter rainfall in South Africa J. Hydrometeorol. Newell R E, Newell N E, Zhu Y and Scott C 1992 Tropospheric
19 127–42 rivers?—a pilot study Geophys. Res. Lett. 19 2401–4
Cordeira J M, Martin Ralph F and Moore B J 2013 The Paltan H, Waliser D, Lim W H, Guan B, Yamazaki D, Pant R and
development and evolution of two atmospheric rivers in Dadson S 2017 Global floods and water availability driven
proximity to western north Pacific tropical cyclones in by atmospheric Rivers Geophys. Res. Lett. 44 10387–95
October 2010 Mon. Weather Rev. 141 4234–55 Pan M and Lu M 2020 East Asia atmospheric river catalog: annual
Corringham T W, Martin Ralph F, Gershunov A, Cayan D R and cycle, transition mechanism, and precipitation Geophys. Res.
Talbot C A 2019 Atmospheric rivers drive flood damages in Lett. 47 1–10
the western United States Sci. Adv. 5 eaax4631 Porhemmat R, Purdie H, Zawar-Reza P, Zammit C and Kerr T
Cullen N J, Gibson P B, Mölg T, Conway J P, Sirguey P and 2020 Moisture transport during large snowfall events in the
Kingston D G 2019 The influence of weather systems in New Zealand Southern Alps: the role of atmospheric rivers
controlling mass balance in the Southern Alps of New J. Hydrometeorol. 1 425–44
Zealand J. Geophys. Res. 124 4514–29 Ralph F M, Neiman P J, Wick G A, Gutman S I, Dettinger M D,
Dacre H F, Martínez-Alvarado O and Mbengue C O 2019 Linking Cayan D R and White A B 2006 Flooding on California’s
atmospheric rivers and warm conveyor belt airflows Russian River: role of atmospheric rivers Geophys. Res. Lett.
J. Hydrometeorol. 20 1183–96 33 1–5
Dean S, Rosier S, Carey-Smith T and Pa S 2013 The role of climate Ralph F et al 2019 A scale to characterize the strength and impacts
change in the two-day extreme rainfall in golden Bay, New of atmospheric rivers Bull. Am. Meteorol. Soc. 100 269–89
Zealand, December 2011 Bull. Am. Meteorol. Soc. Ramos A M, Trigo R M, Liberato M L R and Tomé R 2015 Daily
94 S61–S63 precipitation extreme events in the Iberian Peninsula and its
DeFlorio M J et al 2019 Experimental subseasonal-to-seasonal association with atmospheric rivers∗ J. Hydrometeorol.
(S2S) forecasting of atmospheric rivers over the Western 16 579–97
United States J. Geophys. Res. 124 11242–65 Reid K J, King A D, Lane T P and Short E 2020 The sensitivity of
Eiras-Barca J, Lorenzo N, Taboada J, Robles A and Miguez-Macho atmospheric river identification to integrated water vapor
G 2018 On the relationship between atmospheric rivers, transport threshold, resolution, and regridding method
weather types and floods in Galicia (NW Spain) Nat. J. Geophys. Res. 125 1–15
Hazards Earth Syst. Sci. 18 1633–45 Rosier S, Dean S, Stuart S, Carey-Smith T, Black M and Massey N
Ericksen N and New Zealand National Water and Soil 2015 Extreme rainfall in early July 2014 in Northland, New
Conservation Authority 1986 Creating flood disasters?: New Zealand—was there and an anthropogenic influence? Bull.
Zealand’s need for a new approach to urban flood hazard Am. Meteorol. Soc. 96 S136–S140
(Wellington, New Zealand: Water and Soil Directorate, Rutz J J et al 2019 The atmospheric river tracking method
Ministry of Works and Development) 77 intercomparison project (ARTMIP): quantifying
Frame D J et al 2020 Climate change attribution and the economic uncertainties in atmospheric river climatology J. Geophys.
costs of extreme weather events: a study on damages from Res. 124 13777–802
extreme rainfall and drought Clim. Change 2020 1–17 Rutz J J, James Steenburgh W and Martin Ralph F 2015 The
Gelaro R et al 2017 The modern-era retrospective analysis for inland penetration of atmospheric rivers over western North
research and applications, version 2 (MERRA-2) J. Clim. America: a Lagrangian analysis Mon. Weather Rev.
30 5419–54 143 1924–44
Guan B and Waliser D E 2015 Detection of atmospheric rivers: Shields C A et al 2018 Atmospheric river tracking method
evaluation and application of an algorithm for global studies intercomparison project (ARTMIP): project goals and
J. Geophys. Res. 120 12514–35 experimental design Geosci. Model Dev. 11 2455–74
Hersbach H et al 2019 Global reanalysis: goodbye ERA-Interim, Stidd C K 1953 Cube-root-normal precipitation distributions
hello ERA5 ECMWF Newsletter 159 17–24 Trans. Am. Geophys. Union 34 31
ICNZ n.d. Cost of natural disasters | insurance council of NZ Tait A B and Fitzharris B B 1998 Relationships between New
(ICNZ) (available at: www.icnz.org.nz/natural-disasters/ Zealand rainfall and south-west Pacific pressure patterns Int.
cost-of-natural-disasters/) (Accessed 8 September 2020) J. Climatol. 18 407–24
Kamae Y, Mei W, Xie S-P, Naoi M and Ueda H 2017 Atmospheric Valenzuela R A and Garreaud R D 2019 Extreme daily rainfall in
rivers over the Northwestern Pacific: climatology and central-Southern chile and its relationship with low-level
interannual variability J. Clim. 30 5605–19 horizontal water vapor fluxes J. Hydrometeorol. 20 1829–50
10You can also read