Neoliberalism and the Environment: Are We Aware of Appropriate Action to Save the Planet and Do We Think We Are Doing Enough? - MDPI
←
→
Page content transcription
If your browser does not render page correctly, please read the page content below
Communication
Neoliberalism and the Environment: Are We Aware of
Appropriate Action to Save the Planet and Do We Think We Are
Doing Enough?
Ellie-Anne Jones and Rick Stafford *

                                          Centre for Ecology, Environment and Sustainability, Department of Life and Environmental Sciences,
                                          Bournemouth University, Poole BH12 5BB, UK; s4907168@bournemouth.ac.uk
                                          * Correspondence: rstafford@bournemouth.ac.uk; Tel.: +44-(0)-1202-966780

                                          Abstract: We currently face several interlinked environmental crises, including climate change,
                                          habitat destruction and biodiversity loss. However, many governments seem unwilling to take
                                          strong and immediate action to address these threats, preferring to promote neoliberal approaches to
                                          allow consumers and the general public to make environmentally friendly choices. This is despite
                                          neoliberal approaches being much less likely to be successful than government leadership, taxation,
                                          subsidies, and legislation in addressing environmental issues. In this study, we examine public
                                          perception of environmental threats and solutions to these threats in a survey mainly completed
                                          in the UK. Climate change is seen as the biggest issue, likely due to recent activist campaigns and
                                          subsequent media attention on the issue. Neoliberal attitudes, such as green consumer choices to
                                          environmental concerns, do still dominate in a series of possible presented solutions, and they score
                                          more highly than lifestyle changes, such as changing diet. However, when questioned specifically

                                   about plastic pollution, government intervention to ban all unnecessary plastic scored very strongly,
Citation: Jones, E.-A.; Stafford, R.      indicating a shift from a consumer-driven response. Furthermore, most participants think they are at
Neoliberalism and the Environment:        best only partly “doing their bit” to protect the environment. The results demonstrate that the public
Are We Aware of Appropriate Action        is aware that not enough is happening to protect the environment and provide evidence that there is
to Save the Planet and Do We Think        willingness for stronger government intervention to address environmental issues; however, there is
We Are Doing Enough? Earth 2021, 2,       potential resistance to major lifestyle changes.
331–339. https://doi.org/10.3390/
earth2020019                              Keywords: neoliberalism; environmental awareness; climate change; plastic pollution; environmen-
                                          tal activism
Academic Editor: Charles Jones

Received: 10 May 2021
Accepted: 19 June 2021                    1. Introduction
Published: 21 June 2021
                                                The neoliberalist theory, which began to dominate the Western economy in the 1980s,
                                          still provides the central economic and political ideology that shapes our world today [1].
Publisher’s Note: MDPI stays neutral
                                          Neoliberalism proposes that free markets ultimately lead to individual liberation [2], as
with regard to jurisdictional claims in
published maps and institutional affil-
                                          well as efficiency and economic benefits in the absence of state intervention [3,4].
iations.
                                                While the 1980s saw the growth of this ideology which still dominates economic and
                                          political thinking, the 1990s and subsequent decades have provided growing evidence for
                                          multiple global environmental problems. The planetary boundaries framework described
                                          by Steffen et al. [5] shows that, environmentally, we are operating well beyond safe global
                                          limits, especially with regard to pollution, such as nitrates and phosphates; climate change;
Copyright: © 2021 by the authors.
                                          habitat loss; and biosphere integrity. Climate and biosphere integrity are also described as
Licensee MDPI, Basel, Switzerland.
                                          core planetary boundaries, which can reach a tipping point, pushing the earth system into
This article is an open access article
distributed under the terms and
                                          a new state, such as a significantly warmer “hot house Earth” if exceeded with sufficient
conditions of the Creative Commons
                                          magnitude and for sufficient time [6].
Attribution (CC BY) license (https://           There is a clear, and well documented, mismatch between economic systems which
creativecommons.org/licenses/by/          focus on economic growth, and the environmental crisis [7–9], yet the neoliberal economic
4.0/).                                    framework also hinders government interventions in addressing environmental issues,

Earth 2021, 2, 331–339. https://doi.org/10.3390/earth2020019                                                   https://www.mdpi.com/journal/earth
Earth 2021, 2 332
by preferring market-based solutions to interventions such as taxation, subsidies and
legislation [10]. Strong environmental governance requires state involvement [11,12],
and relying solely on market forces can result in marginal, if any environmental benefits.
Reliance on market forces can lead to “eco-consumerism” which may ease the guilt of the
consumer but have little tangible environmental effect [10,13].
This lack of government intervention, alongside the escalating magnitude and urgency
of environmental issues, has sparked people such as Greta Thunberg to apply pressure to
national and international bodies, leading to the climate emergency being declared [14]. The
widespread support for these campaigns such as Thunberg’s school strikes and Extinction
Rebellion, which demand “system change” suggests significant proportions of the public
understand the urgency of the environmental problems we face and support greater state-
led intervention in addressing these issues. Nevertheless, there is still a strong underlying
narrative of consumer choice in environmental issues, even from commentators which
normally oppose neoliberal frameworks. For example, the “stop eating seafood” message
from the recent documentary Seaspiricy has had considerable publicity and support from
environmental commentators [15], despite widespread condemnation from the marine
science community [16].
Here we examine public perception of environmental issues and solutions, from a
predominantly UK-based survey conducted in 2019. We specifically examine whether the
public are aware of the biggest environmental issues, rather than less important (although
still highly significant) environmental problems such as plastic pollution, and whether they
are more likely to consider consumer-based (neoliberal-market-based) or activist-based, or
lifestyle change solutions to address these problems as more effective. Finally, we examine
if the public think they have done enough themselves to address environmental issues,
specifically with respect to actions taken to reduce single use plastic. These results can help
inform public supportive environmental policies in the future.
2. Materials and Methods
An online questionnaire was prepared to determine individual attitudes towards the
environment, in particular their views on the most pressing environmental issues, and the
best approaches on how to solve these. The questionnaire was released in the summer of
2019 (July, August and September), around a year after the global school strike movement
and beginning of Extinction Rebellion protests, and before the Covid-19 pandemic. The
study was granted ethical approval under Bournemouth University guidelines prior to
releasing the survey to participants. The duration of the study was determined by the
number of participants, and data collection stopped shortly after 100 participants had
completed the survey.
The online questionnaire allowed the survey to be distributed to a wider demographic
with a global reach [17]; however, a majority of results were from UK participants (see
results). The questionnaire was promoted though social media channels (specifically
Facebook and Twitter) and due to the following of the authors, who initially promoted this,
may have a bias towards participants with higher than average interest in environmental
issues. By conducting the questionnaire online, responses are more honest due to the
anonymity of the survey [18,19], making it easier for people to disclose views which may
be sensitive in nature [20,21] or seen as controversial.
The questions analyzed are shown in Table 1. Open answers (e.g., other) were not
allowed for these questions, as this forced participants to choose from the list provided.
This was especially important for the “most important actions to address” questions
(Table 1). For the most important actions to address environmental issues, participants were
presented choices of consumer-based actions, lifestyle changes and activist or educational
actions in which they would be able to easily partake at an individual level if they chose
to. Potential optimal solutions (e.g., changing the economic system) were specifically not
presented as options, so choice was restricted to identify whether consumer-based, or
equivalent non-consumer-based actions would be considered most appropriate. For theEarth 2021, 2 333
“most appropriate action to address plastic pollution” question (Table 1) we compared
technological solutions, consumer-based solutions and government legislation. The choice
of options again restricted responses to these categories, rather than larger-scale, less
directed solutions such as “system change”.
Table 1. Questions from the survey that were analyzed in this study and the categories or answers that the participants
could select.
Question Responses
1. Please select your age range 18–24, 25–30, 31–40, 41–50, 51–60, 60+
2. Please select your gender Female, male, other
School (GCSE or equivalent), post 16 education (including college or sixth
3. What is your highest education level?
form), undergraduate, postgraduate
4. What do you think is the most important
Climate change, deforestation, biodiversity loss (mass extinction),
environmental issue at the moment? (only one
overpopulation, pollution (air, water, etc.), plastics in the ocean
selection possible)
Purchase power, living a zero-waste lifestyle, protests and strikes, social
5. Please rate the following activities in terms of their
media and blog posts, vegetarian diet, vegan diet, buying products made
importance to protecting the environment
with organic materials (1 (low) to 7 (high) response)
Plastic removal technology (e.g., Ocean Clean-Up), improved recycling
6. Please rate the following activities in terms of their technology, reusable carrier bags, access to plastic free aisles in shops,
importance to reducing plastic pollution greater access to recycling centers, banning single use plastics. (1 (low) to
7 (high) response)
7. Do you think you have “done their bit” to protect
No, partly, maybe, yes
the planet?
The opinion-based questions in the survey were presented alongside a Likert scale re-
sponse from 1 to 7, as such options give greater resolution of answers to which participants
are unsure [22]. A majority of results are summarized graphically; however, to determine
if participants responded differently to possible solutions depending on the environmental
issues they thought to be most important, the interaction term of a two-way ANOVA was
examined and conducted by using the glm function in R [23] with Poisson distribution to
approximate for the distribution from ordinal dependent variables [24]. The score given to
the importance of different pro-environmental activities (Q5 in Table 1) was the dependent
variable, with the category of most important issue (e.g., purchase power, zero-waste
lifestyle and Q5 in Table 1) and the selection of the most important environmental issue
(Q4 in Table 1) as fixed independent factors in the analysis.
3. Results
3.1. Overview of Survey Participants
The questionnaire returned 118 responses, but before these could be analyzed, the
incomplete responses were removed, leaving 100 responses (because of this, numbers of
participants giving certain answers are given in the results, which also equate to percentage
of participants). The demographic data of the participants are given in Table 2. As indicated
in the methods, the promotion of the questionnaire initially through social media contacts
of the authors is likely to lead to some bias in selecting for pro-environmental participants.
However, the questionnaire was open to all and beyond the demographics presented; thus,
it is not possible to further determine the participants of the survey. However, it is most
likely to be representative of a subpopulation of the UK population which is typically
younger and more educated than average and mainly have some interest in environmental
issues. It should be noted, however, that the relatively small sample size is a limitation of
this study.Table 2. Demographic characteristics of survey participants. N = 100.
Earth 2021, 2, FOR PEER REVIEW 4
Demographic Characteristic Responses
Earth 2021, 2 Female—57 334
Table
Gender 2. Demographic characteristics of survey participants.
Male—41N = 100.
Other—2
Demographic Characteristic Responses
Completed School (18+)—26
Education
Table (highest characteristics
2. Demographic qualification ofbeing pursed
survey Female—57
participants. N = 100.
Undergraduate degree—49
Gender
or completed) Male—41
Demographic Characteristic Masters or higher level degree—25
Responses
Other—2
18–25—38
Female—57
Completed School (18+)—26
Education
Gender (highest qualification being pursed 25–30—19 Male—41
Undergraduate degree—49
or completed)
Education Other—2
25–30—15
Masters or higher level degree—25
*Education
several older age categories combined
(highest qualification being pursed
30–40—17
Completed School (18+)—26
18–25—38
Undergraduate degree—49
or completed) 40–50—17
25–30—19
Masters or higher level degree—25
50+—11 *
Education 25–30—15
18–25—38
UK—98
*Location
several older age categories combined 30–40—17
25–30—19
Other location—2
Education 40–50—17
25–30—15
* several older age categories combined 30–40—17
50+—11 *
3.2. Identified Environmental Threats and Solutions 40–50—17
UK—98
50+—11 * survey was that of climate
Location
The environmental threat identified as theOther greatest in the
location—2
change UK—98
Location(Figure 1), with other threats receiving only around 25 to 40% of the number of
responses. Solutions to environmental problems (from Other location—2
the choices presented) showed
3.2. Identified Environmental Threats and Solutions
preference for consumer-based approaches, with purchase power showing the highest
3.2. The environmental
Identified
scoring, andEnvironmental threat
“activist” type identified
Threats as the greatest
and Solutions
approaches scoring in the survey
lower (Figure was that
2). Changes of climate
which would
change (Figure
significantly 1),
alter with other
lifestyles threats
(e.g., diet)receiving
scored only
lowest around
of all 25 to
(Figure 40%
2). of the number of
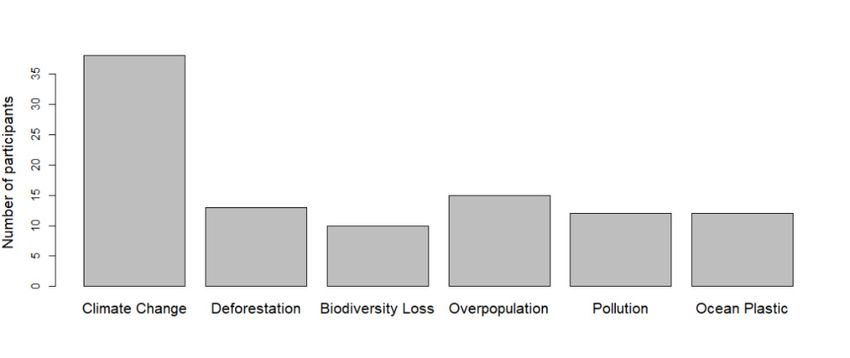
The environmental threat identified as the greatest in the survey was that of climate
responses. Solutions to environmental problems (from the choices presented) showed
change (Figure 1), with other threats receiving only around 25 to 40% of the number of
preference for consumer-based approaches, with purchase power showing the highest
responses. Solutions to environmental problems (from the choices presented) showed
scoring, and “activist” type approaches scoring lower (Figure 2). Changes which would
preference for consumer-based approaches, with purchase power showing the highest
significantly alter lifestyles (e.g., diet) scored lowest of all (Figure 2).
scoring, and “activist” type approaches scoring lower (Figure 2). Changes which would
significantly alter lifestyles (e.g., diet) scored lowest of all (Figure 2).
Figure 1. Number of respondents selecting what they perceive as the biggest environmental
threat.
Figure 1. Number of respondents selecting what they perceive as the biggest environmental threat.
Figure 1. Number of respondents selecting what they perceive as the biggest environmental
threat.
Figure 2. Violin plot of most important actions to take to address environmental issues. White dot indicates the median
score given, with black bar indicating the IQR.
The majority of solutions to address plastic waste scored well, with “reusable carrier
bags” scoring lowest, and “banning single use plastics” receiving the highest score (Figure 3).bags” scoring
score given, with black bar indicating lowest, and “banning single use plastics” receiving the highest score (Figure
the IQR.
3).
The majority of solutions to address plastic waste scored well, with “reusable carrier
bags” scoring lowest, and “banning single use plastics” receiving the highest score (Figure
Earth 2021, 2 3). 335
Figure 3. Violin plot of most important actions to take to address plastic pollution. White dot indicates the median score
given, with black bar indicating the IQR.
Figure 3. Violin plot of most important actions to take to address plastic pollution. White dot indicates the median score
given,
Figurewith black bar
3. Violin plotindicating theThere
IQR. actions
of most important was notosignificant interaction
take to address term in the
plastic pollution. generalized
White linear
dot indicates themodel
medianANOVA
score of
overall
given, with black bar indicating score given to an action against the action type and respondent identification of
the IQR.
There was no significant interaction term in the generalized linear model ANOVA
the most important environmental threat (deviance = 27.8, d.f. = 30, 654, p = 0.579). This
of overall
Therescore given
wasthere to an action
no significant againstterm
interaction the action type and respondent
in thebetween
generalized linear model identification
indicates that are not significant differences the importance ofANOVA of
actions, re-
ofoverall
the most important environmental threat (deviance = 27.8, d.f. = 30, 654, p = 0.579).
gardlessscore given
of what to ansee
people action against
as the most the action type
important and
threat. respondent
However, thoseidentification
identifying ex-of
This
the indicates
most and that there
important are not significant
environmental threat differences
(deviance =between
27.8, d.f.the importance
= median
30, 654, pscore of actions,
= 0.579). This
tinction biodiversity loss as the major threat had a higher across all
regardless of what people see as the most important threat. However, those identifying
indicates
actions (6that there are to
as compared not5 for
significant
all otherdifferences
categories; between
deviancethe importance
= 14.5, of actions,
d.f. = 5, 690, re-
p = 0.0126).
extinction and biodiversity loss as the major threat had a higher median score across all
gardless
Theof what people
majority see as thealso
of participants most important
thought theythreat.
had, atHowever,
best, partlythose identifying
“done their bit”ex-
to
actions (6 as compared to 5 for all other categories; deviance = 14.5, d.f. = 5, 690, p = 0.0126).
tinction and biodiversity loss as the major threat had a higher
reduce environmental issues (Figure 4), with fewer people thinking they had done median score acrosstheir
all
The majority of participants also thought they had, at best, partly “done their bit” to
actions (6 as
bit if they compared
selected to 5pollution
plastic for all other categories;
as the deviance
biggest issue than=other
14.5, d.f. = 5, 690,
threats p = 0.0126).
(Figure 4).
reduce environmental issues (Figure 4), with fewer people thinking they had done their bit
The majority of participants also thought they had, at best, partly “done their bit” to
if they selected plastic pollution as the biggest issue than other threats (Figure 4).
reduce environmental issues (Figure 4), with fewer people thinking they had done their
bit if they selected plastic pollution as the biggest issue than other threats (Figure 4).
Figure 4. Proportion of respondents to the question “Do you think you have ‘done their bit’ to protect the planet?”
categorized by the respondent’s
Figure 4. Proportion classification
of respondents of biggest
to the question environmental
“Do threat.
you think you have ‘done their bit’ to protect the planet?” cate-
gorized by the respondent’s classification of biggest environmental threat.
4. Discussion
Withtoongoing
4. Discussion
Figure 4. Proportion of respondents climate
the question “Dostrikes and you
you think action
havefrom environmental
‘done groups
their bit’ to protect thesuch as extinction
planet?” cate-
gorized by the respondent’srebellion at
classificationthe
of time of
biggest the survey,
environmentalpublic
threat. opinion of UK citizens
With ongoing climate strikes and action from environmental groups such surveyed hereasclearly
extinc-
demonstrated
tion rebellionclimate change
at the time of thewas the major
survey, publicperceived
opinion ofenvironmental threat. When
UK citizens surveyed pre-
here clearly
4. Discussion
sented with consumer-based,
demonstrated climate change lifestyle-based
was the majoror activist-based “solutions” to
perceived environmental environmental
threat. When pre-
problems,
With ongoing climate strikes and action from environmental groups suchalthough,
consumer-based approaches were still thought to be the most effective; as extinc-
when state intervention
tion rebellion at the time(legislation) for plastic
of the survey, publicpollution
opinion ofwas
UKpresented as a solution,
citizens surveyed here itclearly
was
ademonstrated
more popularclimate
choice than technological or consumer-based options. Most participants
change was the major perceived environmental threat. When pre-
also felt that they had not “done their bit” for the environment with actions they had taken.
4.1. Environmental Threats
Climate change was perceived as the major environmental threat by almost half
the survey participants. While this is undoubtedly a major threat, it is only one of the
exceeded planetary boundaries, with biodiversity loss and climate change being “core”
planetary boundaries [5]. This does suggest campaign groups, media reporting and public
engagement may have had a biased focused on climate in 2019 [25]. However, perhaps the
best publicized example of risk of biodiversity loss in 2019, the bleaching of the Great BarrierEarth 2021, 2 336
Reef and other coral reefs, also has climate change as the main driver [26], illustrating the
interlinked nature of these threats.
While there are few datasets surveying public opinion on environmental issues from
the early 2010s, these current findings from our 2019 survey do contrast with some other
earlier work. For example, Marshall et al. [27] show from a survey conducted in 2013/2014
on beaches near the Great Barrier Reef, that plastic was by far the biggest concern of local
residents. The dominant environmental media narrative in western society from the early
to mid-2010s was also that of plastic pollution [10]. Hence, it is likely that the work of
activist groups, such as Extinction Rebellion, have raised the importance of the issue of
climate change in the public mindset in recent years.
4.2. Effective Actions
Despite the possible important role of activist groups highlighted above, respondents
ranked consumer-based actions (from the list provided) as the most effective actions
to address environmental issues, demonstrating that the dominant neoliberal narrative
highlighted in Stafford and Jones [10] is still apparent. While still an individual and
consumer-based action, switching to diets dominated by plant-based products have been
shown to be one of the most effective actions to reduce personal carbon footprints [28,29],
yet these scored lowest of all in the survey. This may illustrate a lack of willingness
to make large-scale changes to lifestyle, despite participating in smaller-scale responses
such as buying more environmentally friendly packaged items. However, there was a
high ranking given to zero-waste lifestyles, which if performed properly, would require
significant changes to lifestyle [30]. It is unclear if people are unwilling, or lack knowledge
about the large environmental effect of diet; however, we can conclude that the effective
action ranking given to all actions did not differ depending on which threat participants
selected as most important. This is somewhat surprising, as threats such as habitat and
biodiversity loss would be more directly associated with land use change, often down to
food-production methods [31,32].
When presented with actions to reduce plastic waste, however, legislative government
action on all single-use plastics was ranked highest; however, consumer- and technological-
based solutions still scored well. Reusable carrier bags scored lowest, perhaps because
this action has already been implemented, and plastic waste is still prevalent. The strong
support for banning single use plastics, however, does pave the way for public support for
stronger government action on the issue. For example, the UK government has committed
to banning “avoidable” plastic waste by 2043 [33]. These results would indicate that there
is there is public support to bring this deadline forward considerably.
Theories such as the Environmental Kuznets Curve do suggest that, over time, and
over increasing levels of economic growth, environmental threats begin to decline [34],
ultimately supporting the economic growth and lack of legislation approach favored
by neoliberalism. However, such approaches have been developed based on localized
pollution metrics, rather than global issues, such as climate change [34]. While better waste
management systems have reduced the effects of plastic pollution in the Global North,
compared to the Global South [35], per capita carbon footprints are much higher in the
Global North, despite much higher levels of GDP, and evidence suggest “decoupling”
carbon emissions from GDP is at best, partial [36]. As such, much academic research does
point towards the need for effective legislation and economic reform to effectively tackle
major environmental issues (e.g., see References [7–10]).
4.3. Have Participants “Done Their Bit”?
The vast majority of participants did not feel that they have “done their bit” for the
environment, and a greater proportion of participants selecting ocean plastic thought that
they had not done their bit. These results indicate the “complacency” angle of plastic
waste hypothesized in Stafford and Jones [10,37] may not be as greater concern as hypothe-Earth 2021, 2 337
sized. However, the results on effective actions, discussed above, do illustrate the lack of
“spillover” from consumerist to other types of action [38].
Ultimately, while there is knowledge that more needs to be done, for actions such as
climate change, the likely cause of action from the public is still that of consumer pres-
sure [39]. Trying to persuade a nation to alter their behavior, without explicit environmental
incentives (i.e., high carbon or pollutant taxes, or subsidies on lower carbon food products),
is a complex and challenging task. Legislative forcing of companies to alter their production
methods, or the products that they offer, may be quicker and more effective, and ultimately
easier, although likely to be politically challenging [40]. However, unless collaborative
efforts are directed to global mitigation of all environmental issues, goals will become
unachievable [41].
5. Conclusions
This study shows that there appears to have been a shift in emphasis in public percep-
tion from plastic to climate as the main environmental threat, albeit from the current survey
from a subpopulation of participants with interest in environmental problems. This is likely
to be a result of international campaigns, illustrating the importance of environmental
activism. Nevertheless, the survey participants did not rank activism highly, and they
focused on consumer-driven responses to address most environmental issues. However,
support for government legislation, in relation to plastic, was apparent, and participants
did not feel that simply reducing plastic use meant they had done enough to benefit the
environment. Collectively, these results support two actions:
1. Since activist campaigns appear to work in promoting awareness, but currently less
well in promoting effective actions, activists, charities, NGOs and political parties
interested in promoting environmental solutions should now campaign strongly for
effective actions, such as legislative and economic processes, as per comprehensive
Green New Deal or Green Recovery plans, which have been predicted to be highly
effective against all environmental threats [9].
2. To alert government and policymakers that there is public support for more urgent
legislative environmental action, such as a more immediate ban on unnecessary plastic.
Author Contributions: Conceptualization, E.-A.J.; methodology, E.-A.J.; formal analysis, E.-A.J. and
R.S.; investigation, E.-A.J. and R.S.; data curation, E.-A.J. and R.S.; writing—original draft preparation,
E.-A.J. and R.S.; writing—review and editing, E.-A.J. and R.S.; visualization, R.S.; supervision, R.S.
Both authors have read and agreed to the published version of the manuscript.
Funding: This research received no external funding.
Institutional Review Board Statement: The study was conducted according to the guidelines of the
Declaration of Helsinki, and approved by the Ethics Review Process of Bournemouth University
(protocol code 27665 14/7/2019).
Informed Consent Statement: Informed consent was obtained from all subjects involved in the study.
Data Availability Statement: Data and analysis code were deposited on the Bournemouth Univer-
sity Online Research Data Depository available at https://doi.org/10.18746/bmth.data.00000158.
(accessed on 10 April 2021).
Acknowledgments: We would like to thank the three reviewers of the manuscript for their valuable
comments that helped improve this work.
Conflicts of Interest: The authors declare no conflict of interest.
References
1. Saad-Filho, A.; Johnston, D. Neoliberalism: A Critical Reader, 1st ed.; Pluto Press: London, UK, 2005.
2. Hayek, F. Law, Legislation and Liberty: A New Statement of the Liberal Principles of Justice and Political Economy. Rule and Order, 1;
Routledge: London, UK, 1973.
3. Harvey, D. Brief History of Neoliberalism; Oxford University Press: Oxford, UK, 2005.
4. Thorsen, D.; Lie, A. What is Neoliberalism? Department of Political Science University of Oslo: Oslo, Norway, 2019.Earth 2021, 2 338
5. Steffen, W.; Richardson, K.; Rockstrom, J.; Cornell, S.; Fetzer, I.; Bennett, E.; Biggs, R.; Carpenter, S.; de Vries, W.; de Wit, C.; et al.
Planetary boundaries: Guiding human development on a changing planet. Science 2015, 347, 1259855. [CrossRef]
6. Steffen, W.; Rockström, J.; Richardson, K.; Lenton, T.M.; Folke, C.; Liverman, D.; Summerhayes, C.P.; Barnosky, A.D.; Cornell, S.E.;
Crucifix, M.; et al. Trajectories of the Earth System in the Anthropocene. Proc. Natl. Acad. Sci. USA 2018, 115, 8252–8259.
[CrossRef] [PubMed]
7. Raworth, K. Doughnut Economics: Seven Ways to Think Like a 21st Century Economist; Random House: London, UK, 2017.
8. Hickel, J. Less is More: How Degrowth will Save the World; William Heinemann: London, UK, 2020.
9. Stafford, R.; Croker, A.R.; Rivers, E.M.; Cantarello, E.; Costelloe, B.; Ginige, T.; Sokolnicki, J.; Kang, K.; Jones, P.J.S.; McKinley, E.;
et al. Evaluating optimal solutions to environmental breakdown. Environ. Sci. Policy 2020, 112, 340–347. [CrossRef]
10. Stafford, R.; Jones, P. Viewpoint–Ocean plastic pollution: A convenient but distracting truth? Mar. Policy 2019, 103, 187–191.
[CrossRef]
11. Jones, P.J.; Long, S.D. Analysis and discussion of 28 recent marine protected area governance (MPAG) case studies: Challenges of
decentralisation in the shadow of hierarchy. Mar. Policy 2020, 127, 104362, in press. [CrossRef]
12. Jones, P.J.S.; Stafford, R.; Maslin, M. What Covid-19 can teach us about governance. The Ecologist. Available online: https:
//theecologist.org/2020/apr/08/what-covid-19-can-teach-us-about-governance (accessed on 10 April 2021).
13. Dauvergne, P.; Lister, J. The Prospects and Limits of Eco- Consumerism: Shopping Our Way to Less Deforestation? Organ. Environ.
2010, 23, 132–154. [CrossRef]
14. Soldati, C. The UK Becomes the First Country in the World to Declare a Climate Emergence. LifeGate. 2019. Available online:
https://www.lifegate.com/people/news/uk-climate-emergency (accessed on 10 April 2021).
15. Monbiot, G. Seaspiracy Shows Why We Must Treat Fish not as Seafood, but as Wildlife. The Guardian. 2021. Available online:
https://www.theguardian.com/commentisfree/2021/apr/07/seaspiracy-earth-oceans-destruction-industrial-fishing (accessed
on 10 April 2021).
16. Pauly, D. What Netflix’s Seaspiracy Gets Wrong about Fishing, Explained by a Marine Biologist. Vox. 2021. Available online: https:
//www.vox.com/2021/4/13/22380637/seaspiracy-netflix-fact-check-fishing-ocean-plastic-veganism-vegetarianism (accessed
on 10 April 2021).
17. Evans, J.; Mathur, A. The value of online surveys. Internet Res. 2005, 15, 195–219. [CrossRef]
18. Denscombe, M. The Good Research Guide for Small-Scale Research Projects, 5th ed.; Open University Press: Maidenhead, UK, 2014.
19. Newing, H. Conducting Research in Conservation: Social Science Methods and Practice [Online]; Routledge: London, UK, 2011.
20. Fricker, R.D.; Schonlau, M. Advantages and Disadvantages of Internet Research Surveys: Evidence from the Literature. Field
Methods 2002, 14, 347–367. [CrossRef]
21. Whelan, T. Anonymity and confidentiality: Do survey respondents know the difference? In Proceedings of the 30th Annual
Meeting of the Society of Southeastern Social Psychologists, Durham, NC, USA, 31 October 2007.
22. Kragh, G. A Holistic Approach to Environmental Volunteering: Connections between Motivation, Well-Being and Conservation
Achievement. Ph.D. Thesis, Bournemouth University, Bournemouth, UK, 2017.
23. R Core Team (2020). R: A language and environment for statistical computing. Vienna: R Foundation for Statistical Computing.
Available online: https://www.R-project.org/ (accessed on 10 April 2021).
24. Faraway, J.J. Extending the Linear Model with R. Generalized Linear, Mixed Effects and Nonparametric Regression Models, 2nd ed.;
Routledge: London, UK, 2016.
25. Ginanjar, W.R.; Mubarrok, A.Z. Civil Society and Global Governance: The Indirect Participation of Extinction Rebellion in Global
Governance on Climate Change. J. Contemp. Gov. Public Policy 2020, 1, 41–52. [CrossRef]
26. Hughes, T.P.; Anderson, K.D.; Connolly, S.R.; Heron, S.F.; Kerry, J.T.; Lough, J.M.; Baird, A.H.; Baum, J.K.; Berumen, M.L.;
Bridge, T.C.; et al. Spatial and temporal patterns of mass bleaching of corals in the Anthropocene. Science 2018, 359, 80–83.
[CrossRef]
27. Marshall, N.A.; Dunstan, P.; Pert, P.; Thiault, L. How people value different ecosystems within the Great Barrier Reef. J. Environ.
Manag. 2019, 43, 39–44. [CrossRef]
28. Wynes, S.; Nicholas, K.A. The climate mitigation gap: Education and government recommendations miss the most effective
individual actions. Environ. Res. Lett. 2017, 12, 074024. [CrossRef]
29. Poore, J.; Nemecek, T. Reducing food’s environmental impacts through producers and consumers. Science 2018, 360, 987–992.
[CrossRef]
30. Zaman, A.; Lehmann, S. Urban growth and waste management optimization towards ‘zero waste city’. City Cult. Soc. 2011, 2,
177–187. [CrossRef]
31. Alexander, P.; Rounsevell, M.D.; Dislich, C.; Dodson, J.R.; Engström, K.; Moran, D. Drivers for global agricultural land use change:
The nexus of diet, population, yield and bioenergy. Glob. Environ. Chang. 2015, 35, 138–147. [CrossRef]
32. Mora, O.; Le Mouël, C.; de Lattre-Gasquet, M.; Donnars, C.; Dumas, P.; Réchauchère, O.; Brunelle, T.; Manceron, S.; Marajo-
Petitzon, E.; Moreau, C.; et al. Exploring the future of land use and food security: A new set of global scenarios. PLoS ONE 2020,
15, e0235597. [CrossRef] [PubMed]
33. DEFRA, A Green Future: Our 25 Year Plan to Improve the Environment. London: Department for Environment, Fisheries and Rural
Affairs. Available online: https://www.gov.uk/government/publications/25-year-environment-plan. (accessed on 8 April 2021).Earth 2021, 2 339
34. Dasgupta, S.; Laplante, B.; Wang, H.; Wheeler, D. Confronting the environmental Kuznets curve. J. Econ. Perspect. 2002, 16,
147–168. [CrossRef]
35. Knoblauch, D.; Mederake, L.; Stein, U. Developing countries in the lead—what drives the diffusion of plastic bag policies?
Sustainability 2018, 10, 1994. [CrossRef]
36. Parrique, T.; Barth, J.; Briens, F.; Kerschner, C.; Kraus-Polk, A.; Kuokkanen, A.; Spangenberg, J.H. Decoupling Debunked:
Evidence and Arguments Against Green Growth as a Sole Strategy for Sustainability. European. Environmental Bureau, Brussels.
2019. Available online: Eeb.org/library/decoupling-debunked (accessed on 4 April 2021).
37. Stafford, R.; Jones, P.J.S. We should not separate out environmental issues, but the current approach to plastic pollution can be a
distraction from meaningful action. A response to Avery-Gomm et al. Mar. Policy 2019, 107, 103585. [CrossRef]
38. Maki, A.; Carrico, A.R.; Raimi, K.T.; Truelove, H.B.; Araujo, B.; Yeung, K.L. Meta-analysis of pro-environmental behaviour
spillover. Nat. Sustain. 2019, 2, 307–315. [CrossRef]
39. Cooper, T. Slower Consumption Reflections on Product Life Spans and the “Throwaway Society”. J. Ind. Ecol. 2008, 9, 51–67.
[CrossRef]
40. Nickerson, R.; Moray, N. Emerging Needs and Opportunities for Human Factors Research; The National Academies Press: Cambridge,
MA, USA, 1995.
41. Peters, G.; Andrew, R.; Boden, T.; Canadell, J.; Ciais, P.; Le Quéré, C.; Marland, G.; Raupach, M.; Wilson, C. The challenge to keep
global warming below 2 ◦ C. Nat. Clim. Chang. 2012, 3, 4–6. [CrossRef]You can also read