A Study of Local Climate Zones in Abu Dhabi with Urban Weather Stations and Numerical Simulations - MDPI
←
→
Page content transcription
If your browser does not render page correctly, please read the page content below
sustainability

Article
A Study of Local Climate Zones in Abu Dhabi with
Urban Weather Stations and Numerical Simulations
Prajowal Manandhar 1, * , Lindita Bande 2 , Alexandros Tsoupos 1 and Prashanth Reddy Marpu 3
and Peter Armstrong 4
 1    National Space Science and Technology Center, UAE University, Al Ain 15551, UAE; aletsoup@uaeu.ac.ae
 2    Department of Architectural Engineering, College of Engineering, UAE University, Al Ain 15551, UAE;
      lindita.bande@uaeu.ac.ae
 3    Department of Electrical Engineering and Computer Science, Khalifa University, Masdar Campus,
      P.O. Box 54224, Abu Dhabi, UAE; prashanth.marpu@ku.ac.ae
 4    Department of Mechanical Engineering, Khalifa University, Masdar Campus, P.O. Box 54224, Abu Dhabi,
      UAE; peter.armstrong@ku.ac.ae
 *    Correspondence: pmanandhar@uaeu.ac.ae

 Received: 17 November 2019; Accepted: 15 December 2019; Published: 24 December 2019

 Abstract: In many cities that have experienced rapid growth like Abu Dhabi, urban microclimate
 scenarios evolve rapidly as well and it is important to study the urban thermal dynamics continuously.
 The Local Climate Zone (LCZ) classification considers factors related to the physical properties like
 surface cover and surface structure of the city which allow to analyze urban heat flows. Abu Dhabi
 city is rapidly expanding and is characterized by highly heterogeneous types of built forms that
 comprise mainly of old mid-rise and modern high-rise buildings with varied degrees of vegetation
 cover in different parts of the city. The fact that it is a coastal city in a desert environment makes it
 quite unique. This paper presents an approach of studying urban heat flows in such heterogeneous
 setup. First, the city is classified into local climate zones using images acquired by Landsat Satellite.
 Numerical simulations are performed in the designated LCZs using a computational fluid dynamics
 software, Envi-met. The results of Envi-met are calibrated and validated using in-situ measurements
 across all four seasons. The calibrated models are then applied to study entire Abu Dhabi island
 across different seasons. The results indicate a clear presence of urban heat island (UHI) effect when
 averaged over the full day which is varying in different zones. The zones with high vegetation do
 not show large average UHI effect whereas the effect is significant in densely built zones. The study
 also validates previous observations on the inversion of UHI effect during the day and in terms of
 diurnal response.

 Keywords: LCZ; UHI; LST

1. Introduction
     Mapping the cities is becoming a challenge due to the rapid urban growth. However, there are
several studies done in European cities through the WUDAPT methodology. An open data source
that can be used from researches around the world to map cities according to the climate zones [1–3].
Microclimate variations in urban environments have been studied for 50 years. With the rapid increase
in urbanization and development of highly heterogeneous landscapes, combined with the global
temperature rise, these studies have become more popular and are becoming important sources of
information for urban planners. Also, the energy usage of an urban areas has been a subject of great
interest ever since a significant expansion in cities is observed from the movement of inhabitants [4].
With this, the demand for energy use is increasing while at the same time many energy resources are

Sustainability 2020, 12, 156; doi:10.3390/su12010156                     www.mdpi.com/journal/sustainability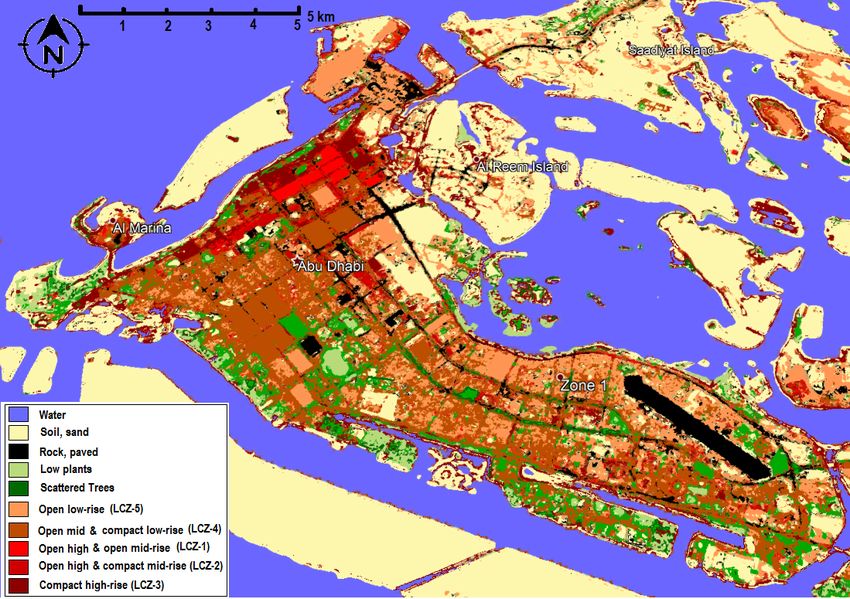
Sustainability 2020, 12, 156 2 of 15
steadily diminishing. The urban forms including building structures, street patterns as well as building
distances and their interaction affect the climates of urban areas. With extensive urban expansion and
population growth, a number of environmental problems such as resource crisis, local climate change,
air pollution, traffic congestion have been observed [5]. Hence, responsible urban forms should take
into consideration energy efficiency along with reducing resource waste and carbon footprints.
Currently, more than half of the world’s population live in urban areas, a fraction that will
continue to rise in the coming years leading to an increased population densities and spatial cover.
This extended urbanization contributes to global climate changes [6]. Furthermore, transformations to
the urban form significantly impacts the overlying atmosphere [7]. The Urban Heat Island (UHI) [8] is
a phenomenon defined as the temperature difference between urban environment and its surrounding
rural areas, as a result of such transformations (as shown Figure 1).
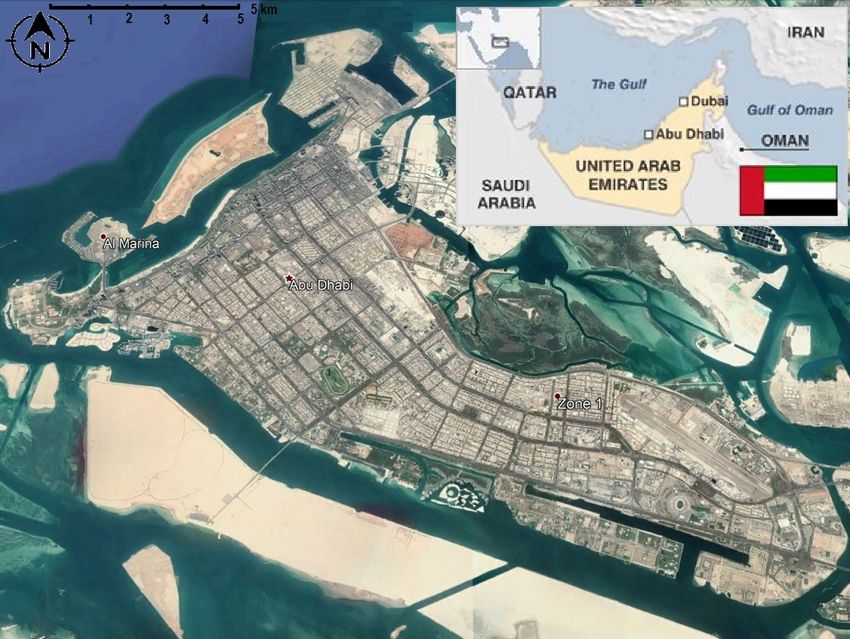
Figure 1. The study location in Abu Dhabi, UAE and the regional context.
Traditionally, the study of UHI has relied on simple classifications such as ‘urban’ and ‘rural’. While
these classes may well describe the surfacial landscape, they fail in providing detailed information
about the landscape properties and usage that directly impact the urban micro-climate characteristics.
Two classes can only describe gross distinctions between the extremes of average or median properties
of rural and urban. In temperate regions, UHI has been extensively investigated [9–11]. Despite
the growing socioeconomic relevance of arid lands and their increasing urbanization rate, how
urbanization affects the local climate in these hot and hyper-arid environments has still not been
explored extensively [12,13]. Lazzarini et al. [13] investigated the climatology of cities located in
hot desert areas including Abu Dhabi using MODIS satellite data and reported the temporal trends
using averaged weekly values of land surface temperature (LST). LST is one of the key parameters
in the physics of land surface processes, combining surface-atmosphere interactions and the energy
fluxes between the atmosphere and the ground. However, the conventional way of classifying regions
into urban and rural is not sufficient to understand the micro-climate dynamics within the city and
assess the UHI, since in many cases landscapes can combine characteristics of both classes. In some
studies [12], the authors introduced multiple classes extending to impervious surface areas, vegetation
density, etc. However, the concept that was found to have a better relevance in studying urban
micro-climate is that of Local Climate Zones (LCZ). LCZ was introduced in [14] and incorporates both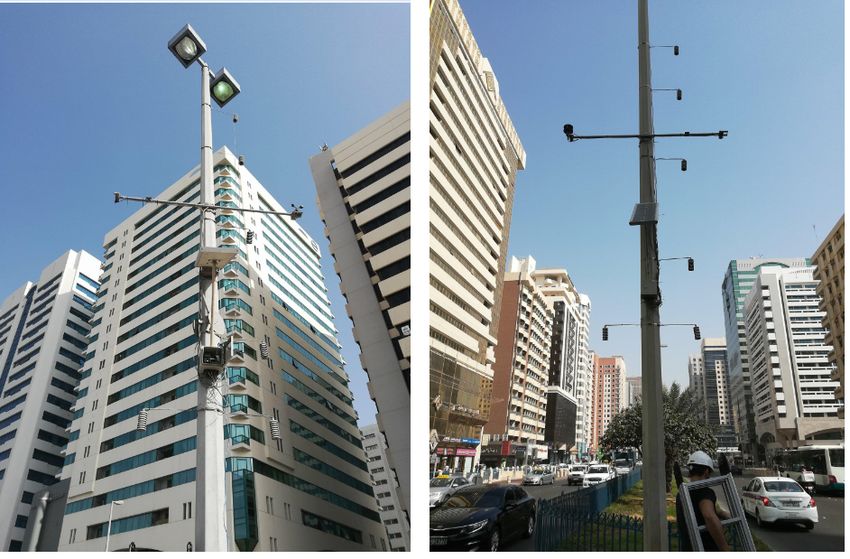
Sustainability 2020, 12, 156                                                                      3 of 15

the physical and geometrical elements of an urban area in an attempt to introduce a comprehensive
approach in studying UHI effects. Therefore, in order to study the thermal behavior of different land
cover types on a local scale, the LCZ approach is a more effective scheme of land classification.
     The LCZ classification approach is an important concept for climate related classification of urban
areas and has originally been designed for communication of meta-data produced by observational
UHI studies. While the approach has found various applications [7,14], one of the most important
ones is to use LCZ information as the input for different climate or weather models to better represent
urban areas. LCZs are defined as “regions of uniform surface cover, structure, material and human
activity that spans from hundred of meters to several kilometres in horizontal scale” and are classified
primarily into 17 classes with 10 classes belonging to built type and 7 pertaining to natural types of
land cover category. Stewart and Oke [14] also paved a way for new subclasses that originate from
the standard set of LCZ classes and are the resultant of any combinations of built covers, natural land
covers and other land cover properties. In the past, various studies have been reported related to the
LCZ concept and its application in understanding UHI at a local level across the globe [9–11,14–20].
The LCZ characterization scheme has been applied to cities with well-planned and uniform urban
structure such as Uppsala (Sweden), Nagano (Japan), Vancouver (Canada), Toulouse (France) [21],
Singapore [22], as well as to heterogeneous cities with non-uniform structures like Nagpur (India) [23]
with the aim of providing an in-depth evaluation of the approach regarding the assessment of the UHI
effect around the world.
     The main objective of this study is to characterize a unique urban environment like Abu Dhabi city
in order to investigate the temporal variations in the UHI intensity by applying the LCZ concept that
environment within each class is suppose to be similar. This allows mapping LCZs of heterogeneous
building typology across entire Abu Dhabi island. In-situ temperature sensors allow to keep track of
thermal variations across known LCZs in different seasons, which are found to be comparable to LST
measurements acquired from MODIS. Furthermore, each climatic zone is modeled using Envi-met,
which is an urban micro-climate modeling and simulation platform. The simulation results of the
Envi-met models are then calibrated with in-situ urban measurements and the refined models can be
applied to entire Abu Dhabi island using LCZ classification concept.

2. Methodology
     Figure 2 provides the outline of the methodology followed in this work. The Landsat data
are used for the LCZ classification, MODIS data for obtaining the LSTs and the in-situ temperature
measurements for the statistical correction of the developed Envi-met simulation models for specific
LCZs in Abu Dhabi island. From the definition of LCZ, regions belonging to one LCZ tend to have
similar urban forms and urban effects which can be seen even in temperatures of that zones. We then
use the concept of LCZ to estimate the temperatures in district 2 pertaining to ‘LCZ-1’ using Envi-met
results of district 1, which also belongs to ‘LCZ-1’ typology.

                                 Figure 2. Methodology of the analysis.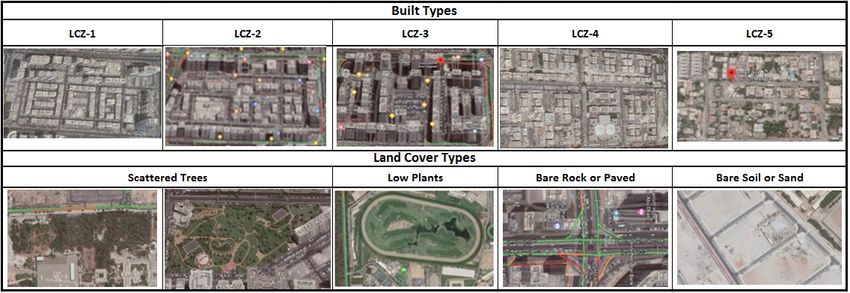
Sustainability 2020, 12, 156                                                                         4 of 15

2.1. City Selection
     Abu Dhabi, the capital of United Arab Emirates, is located 24◦ 280 North latitude and 54◦ 220 East
longitude (shown in Figure 1). It is situated on the west coast of the UAE in the Arabian Peninsula and
over the last few decades Abu Dhabi has witnessed a fast and continuous urban expansion([24,25]).
The initial city layout was planned in the early 1970s, with a population of around 100,000 and an
estimated maximum population of 600,000. The population reached 283,000 in 1985, with large desert
areas being transformed into residential and industrial use sectors [12]. The creation of new man-made
islands started for residential and recreational activities in the surroundings of the main city area. From
2009 to 2015, the population figure has doubled and is now estimated close to 1.6 million. Abu Dhabi
island is characterized by the heterogeneous type of building forms, which slightly varies from the
standard LCZ classes and comprises mainly of old mid-rise and modern high-rise buildings which can
be defined as a combination of the standard built classes.
     Abu Dhabi has a unique urban form influenced by different masterplans proposals which evolved
in the last 5 decades. The earliest plan was proposed by Katsuhiko Takahashi with linear roads in
1967 [26]. The main spine is the Airport Road, that leads towards the historical area where the souk
was located. The proposed plan from Mr. Takahashi was modified and implemented by Abdulrahman
Makhlouf starting in 1968. The main characteristics of each district in the 1968 masterplan were:

•     a mosque where people gather to pray,
•     a main lane where there are shops and restaurants,
•     the ‘gossip lane’ where women would gather in the evenings and talk about their day [26,27].

      Each district is surrounded by high-rise commercial/residential buildings, and in the middle
there are villas or low-rise buildings (as shown in Figure 3). This district division relates with the
distribution of the houses in the old neighborhoods where they are close to each other but far enough
to have their privacy. Since the city was built in the years when cars was starting to be used in emirates,
the streets between the blocks have six lanes which brings isolation of each block from each-other. This
division has a parallelism with the seven-house blocks divided from each other in the old Emirati
neighborhoods. Since then, the city has rapidly expanded towards the mainland . Recently, significant
renovation and reconstruction activity has also been reported in the old part of the city with small
deviations to the original master plan.
      Abu Dhabi is known for its hot and arid climate. From June to September, it is generally hot
and humid with maximum temperatures averaging around 40 ◦ C. While from November to February,
it becomes relatively cooler, with average temperatures of around 25 ◦ C. Precipitation is very rare and
will occur only during cooler months.

                               Figure 3. Building height levels in Abu Dhabi.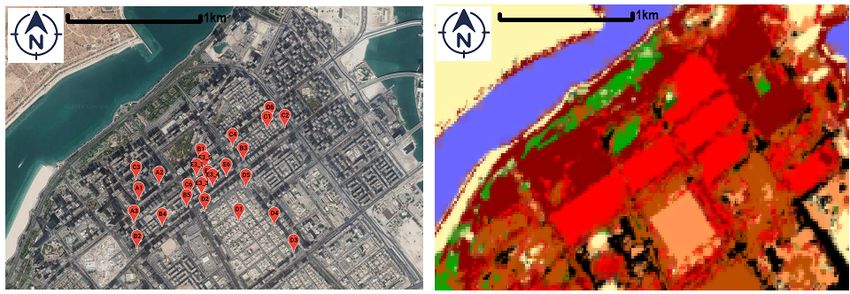
Sustainability 2020, 12, 156                                                                      5 of 15

2.2. Data
    The approach presented in this study uses data from in-situ weather sensors installed in different
climate zones along with combined remote sensing information retrieved from two categories of
sensors to calibrate the Envi-met simulation models:

•     Landsat-8 images are used to perform classification of LCZ.
•     Low spatial resolution MODIS/Terra data indicate the temporal trend of LST and as a means for
      validation of the in-situ temperature measurements.
•     High temporal and temperature resolution, accuracy in-situ measurements from an extensive
      urban climate monitoring campaign.

     The final aim is to produce Envi models, statistically corrected, to study urban thermal flows
across the entire city.

2.2.1. Landsat-8 Data
     Landsat 8’s Operational Land Imager (OLI) features as the on-board main instrument an Enhanced
Thematic Mapper Plus (ETM+), which provides data in 8 bands with a spatial resolution of 30 m,
a panchromatic band with a resolution of 15 m along with Thermal Infrared Sensor with a spatial
resolution of 100 m. These 8 bands data are used for the LCZ classification process.

2.2.2. MODIS Data
     MODIS (or Moderate Resolution Imaging Spectroradiometer) is an instrument aboard the Terra
(EOS AM) satellite, launched in December 1999, and Aqua (EOS PM) satellite, launched in May
2002. The data is acquired in 36 spectral bands and the acquisition time (Local Time of Ascending
Node—LTAN) in Abu Dhabi is around 7 a.m. and 7 p.m. UTC time for Terra and around 10 a.m. and
10 p.m. for Aqua.
     The specific MODIS product used in this study is MOD11_L2, MODIS/Terra Land Surface
Temperature and Emissivity (LST/E). It provides per-pixel temperature and emissivity values in a
sequence of swath-based to grid-based global products which are produced daily for both daytime
and night-time acquisitions.

2.2.3. In-Situ Weather Data
     In-situ measurements of weather data are collected by a dense grid of high accuracy and
temporal resolution urban weather stations installed at different climate zones of Abu Dhabi [28,29].
The deployment of the weather station network and the exact positions of the nodes have been selected
after CFD simulations of the urban canyons. The measured weather data include air temperature
at multiple heights (3 m, 4 m, 5.5 m, 7 m and 8.5 m), relative humidity and horizontal wind vector,
land and building facade surface temperature, as well as global horizontal irradiation (GHI) [28].
The in-situ data were used for calibrating the output of the developed Envi-met thermal models.
Deployments of two typical weather stations are pictured in Figure 4. The weather data was collected
from these sensors daily using cellular network. Temperature data with one minute resolution over
two weeks across four different time periods of the year were used in this study. The first week of data
during a time period is used for the statistical calibration of the Envi-met models and the second week
of data in each time period is used for validation of the calibrated model.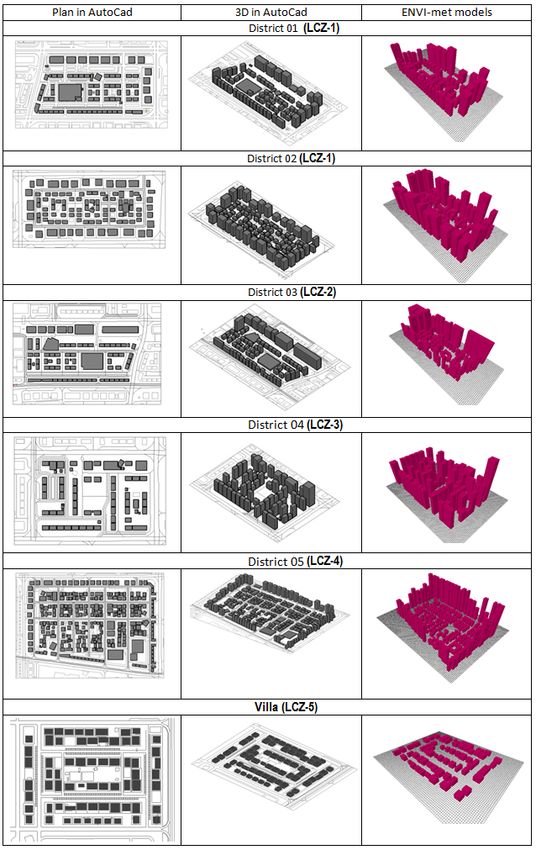
Sustainability 2020, 12, 156                                                                              6 of 15

           Figure 4. Two in-situ urban weather stations typical of the 26 deployed on Abu Dhabi island.

2.3. Local Climate Zone Classification
     After a detailed study of the building heights (Figure 3) and the land use/land cover areas, Abu
Dhabi island can be associated with five built-types and four land cover classes, adding up to nine
LCZ classes which are shown in Figures 5 and 6. The LCZ classification task is performed using
SAGA software [30] after careful selection of a minimum of five samples for each class. SAGA is GIS
software that allows to perform classification of satellite imagery based on the samples of the classes.
The samples of each class is obtained with the help of urban experts who has in-dept knowledge and
understanding about urban forms in Abu Dhabi.
     It has to be noted that this study is a first attempt to contribute in mapping the main island of
Abu Dhabi into LCZ and understand the development of the city. This attempt extends into being part
of the WUDAPT Initiative (World Urban Database and Access Portal Tools) [2]. WUDAPT is an open
framework initiated to acquire and disseminate climate relevant data across geographical regions for
analyzing current and future conditions of the climate. The WUDAPT portal allows the analysis of
different climate scenarios with the data being available from several cities around the world.

2.4. Modeling Using Envi-Met
      Envi-met is a CFD software used mainly by urban planners and architects [31,32]. It performs an
analysis of the outdoor conditions (temperature, wind speed, relative humidity etc.) based on different
neighborhood typologies [33]. Basically, there is a recalculation of several parameters based on rural
boundary conditions, in order to have realistic urban microclimate [34].
      Using Envi, it is possible to rebuild a full district based on a bitmap image taken from an AutoCAD
file [35,36]. The image stays as a base that helps the 3D model to be built and following the contour
lines facilitates the modeling of the district. The scale is adapted according to the pixels of the program.
In our case, each pixel represented 3 m in the plan. In the map area, the streets, their materials,
the pavement and asphalt, the building typology and height, and the shading characteristics can be
defined. The model development in 3-D is carried out in in parallel with the 2-D as shown in Figure 5.
Since the height of the building varies, there is a scale factor applied to the 3-D model in order to
produce a less computational intensive version of the model. The size of the developed models are
100 × 100 nodes, which is the lowest of two resolutions supported in Envi-Met. The higher supported
resolution is 250 × 250.
Sustainability 2020, 12, 156 7 of 15
Figure 5. Different types of districts in Abu Dhabi used for thermal modeling in Envi-met.
Figure 6. Different LCZ examples in Abu Dhabi.Sustainability 2020, 12, 156 8 of 15
The models developed in this study (using Envi-met 4.0) use material properties obtained from
site surveys. The new materials (of the pavement and the walls) are modified from the standard blocks
available in the software to properly model radiant and convective heat fluxes. The information about
district characterization can be found in Table 1. Setting up the boundary conditions is one of the most
important steps in such numerical simulations. The input data for the simulations are obtained from
a weather station located at Masdar Institute Field Station (Lat: 24.4361, Long: 54.6122) for the four
analysis periods in 2017–2018 which are considered in this study as the sub-urban/rural station. The
simulation days (include the equinox and the solstice) are 23 March, 23 September and 21 December.
However, one week of rural data was averaged into 24 h slots in order to create the boundary file as
an average value. The base dates taken for the modeling are: 13–19 June 2017, 13–19 September 2017,
13–19 December 2017 and 13–19 March 2018. The dates for validation are the following week: 20–26
June 2017, 20–26 September 2017, 20–26 December 2017 and 20–26 March 2018. The output of the
Envi-met simulation tends to underestimate the actual temperature measured on site. This difference
can be attributed to the absence of a model that would capture the anthropogenic heat. To enhance
the accuracy of the Envi-met models a statistical model is developed using first week data across all
four seasons. In this case, a quadratic equation obtained based on dual criteria of least root mean
square root error (RMSE) and maximum R-squared value is selected. Since, the temperature across
day and night time varies significantly across all the four seasons, the statistical model (1) is developed
considering both day and night periods and is applied to all the eight resulting scenarios of the second
week validation data.
f ( x ) = p1 ∗ x2 + p2 ∗ x + p3 (1)
Table 1. District Characterization.
Description District (1 & 2) District 3 District 4 District 5 Villa
LCZ-Type LCZ-1 LCZ-2 LCZ-3 LCZ-4 LCZ-5
Area of district (m2 ) 219.00 118.00 332.00 719.00 219.00
Total build area (m2 ) 48.00 45.00 27.00 112.00 28.00
No. of Buildings 70 67 48 150 68
Avg. building H (m) 44 44 70 40 9
Avg. street Width (m) 27 26 32 25 22
3. Results
Figure 7 shows the classification results of nine LCZs in Abu Dhabi main island obtained from
analysis of remotely spectral images obtained from analysis of remotely spectral images. In the
classification result, Abu Dhabi island is mostly covered with mixed typology of ‘Open Mid & Compact
Low-Rise’ (LCZ-4) buildings followed by ‘Open Low-Rise’ (LCZ-5) buildings. In the downtown region
(between north-west and central region) of Abu Dhabi island, we see ‘Compact High Rise’ (LCZ-3)
and ‘Open high & Compact Mid-Rise’ (LCZ-2) building and towards the east we see ‘Open high &
Open Mid-Rise’ (LCZ-1) along with LCZ-3 buildings. We can also see ‘Low Plants’ spread across the
island and few regions of ‘Scattered Trees’ which account for irrigated greenery along side road and
park areas. Figure 8 shows the LCZ regions in the area where in-situ weather sensors are installed.
Figure 9 shows the comparison of measured LST against modelled with in-situ temperature measured
in Abu Dhabi downtown. The temporal day and night variation of measured temperature against LST
infers that measured temperatures do tend to follow the trend of the simulated LST, which can be seen
more prominently in the month of December.Sustainability 2020, 12, 156 9 of 15
Figure 7. The classification of Local Climate Zones in Abu Dhabi.
Figure 8. The location of in-situ weather sensors in Google Maps (Left) and its corresponding LCZ
mapping (Right), extracted and zoomed from Figure 7.
Table 2 demonstrates a non-significant UHI effect for the September time period based on the
urban and rural data. However, a higher air temperature is noted at the district-5 (LCZ-4). The Envi-met
models produce values consistently lower, since they do not include a mechanism to capture the heat
generated by human activity. Furthermore, in this case district-5 shows the highest air temperature
increase. Similar to September month, a month of June reading also shows a higher temperature noted
for district-5. We can observe UHI effect in all districts for the months of June and March. In the case
of December, the data for district-3 shows a higher UHI than expected. During this season the models
in Envi-met show a low UHI effect. However among these temperatures ,the higher one is in district-1
(open high & mid-rise buildings) in the month of March. The villa district or the open low rise shows a
predictable UHI phenomena. The values of UHI in Envi-met are higher by an average of 0.88 degrees.Sustainability 2020, 12, 156 10 of 15
Figure 9. Comparison of simulated LST and in-situ temperature; (top) temperature recorded at 7 a.m.,
(bottom) temperature recorded at 7PM (UTC time).
Since, we observed a difference between the hourly output of Envi-met simulation and the actual
temperature measured for the first week data as shown in Figure A1. The statistical correction using
Equation (1) is performed to calibrate the result of Envi-met simulation by breaking down 24 hours
into day and night periods; day: (7 a.m. to 6 p.m.) and night: (6 p.m. onwards until 7 a.m.), and
modeling them separately. From the Table 3, we can see that in the case of cooler months such as
December and March seasons especially night times are much accurately modeled with smaller RMSE
as compared to hotter periods such as June and September months especially day times. In Figure A2,
the calibrated Envi-met model tend to predict the in-situ measurements for the second week precisely
as shown in Table 4.
Table 2. Average Temperature Difference across Rural, Urban (Districts (D)) and Envi-met results.
Rural (R) Urban (U) Envi-met (E)
S.No. Scenario D-1 D-2 D-3 D-4 D-5 D-1 D-2 D-3 D-4 D-5 Villa
1 Sept. 33.18 33.40 33.28 32.95 33.14 33.47 32.72 32.61 32.64 32.68 32.79 32.8
U-R/E-R 0.22 0.10 −0.23 −0.04 0.29 −0.46 −0.57 −0.54 −0.5 −0.39 −0.38
E-U −0.68 −0.67 −0.31 −0.46 −0.68 N/A
2. June 35.41 35.93 35.71 35.63 35.47 36.09 35.61 35.46 35.50 35.67 35.69 35.81
U-R/E-R 0.52 0.30 0.22 0.06 0.68 0.20 0.05 0.09 0.26 0.28 0.40
E-U −0.32 −0.25 −0.13 0.20 −0.40 N/A
3. Dec. 19.74 22.54 22.31 22.95 22.18 22.30 19.8 19.71 19.73 19.76 19.79 19.8
U-R/E-R 2.8 2.57 3.21 2.44 2.56 0.06 −0.03 −0.01 0.02 0.05 0.06
E-U −2.74 −2.60 −3.22 −2.42 −2.51 N/A
4. Mar. 24.01 25.43 25.26 25.47 25.6 25.86 25.92 25.8 25.86 25.92 26.01 25.97
U-R/E-R 1.42 1.25 1.46 1.59 1.85 1.91 1.79 1.85 1.91 2 1.96
E-U 0.49 0.54 0.39 0.32 0.15 N/ASustainability 2020, 12, 156 11 of 15
Table 3. Calibration parameters(p1,p2,p2) for day and night across different seasons along with their
modeled RMSE (M) and predicted RMSE (P) for a week data in respective seasons.
Season Period p1 p2 p3 M P
June Day −0.159 1.83 −9.71 0.70 1.14
September Day 0.023 −0.74 33.6 0.65 1.04
December Day 0.061 −1.82 33.03 0.65 0.84
March Day 0.004 −1.15 29.02 0.52 0.61
June Night 0.023 −1.13 45.95 0.28 0.75
September Night −0.002 0.70 14.58 0.44 0.74
December Night −0.004 0.68 10.3 0.22 0.25
March Night −0.017 1.09 7.92 0.45 0.54
The corrected Envi-met simulations show the differences in air temperatures between one LCZ
and another. The district with mixed used buildings corresponding to the District-5 in the LCZ division
shows higher temperatures in the hottest times of the year. The majority of the island has this district
typology (based on the traditional Emirati neighborhood). These result show that the city needs
attention towards the increase of the UHI in the most urbanized part of the island.
Furthermore, we also estimated the temperature across two weeks of District-2 using Envi-met
results of District-1 (as shown in Figure 10), both of which belong to LCZ-1. The RMSE of the obtained
result using LCZ concept modeling (Table 5) w.r.t District-2 is observed to be better (except in the
month of June by a small value) than previously calibrated results for all districts together as shown
in Table 4. Hence, with one such example, we believe that this can be further applied to other LCZs
covering entire Abu Dhabi island.
Table 4. RMSE comparison for uncorrected and corrected Envi-met results.
Uncorrected Envi Results Corrected Envi Results (CER) CER LCZ-1
Seasons D-1 D-2 D-3 D-4 D-5 D-1 D-2 D-3 D-4 D-5 D-2
June 2.62 2.31 2.22 2.43 2.29 0.74 0.27 0.81 0.55 0.85 0.35
September 2.61 2.71 2.49 2.34 2.34 0.50 0.50 0.49 0.27 0.56 0.41
December 2.16 2.24 2.18 1.95 2.02 0.65 0.35 0.77 0.41 0.55 0.24
March 1.71 1.85 2.00 2.08 1.33 0.84 0.78 1.47 1.62 0.83 0.68
Table 5. Calibration parameters(p1,p2,p2) for day and night across different seasons of LCZ-1
(Prediction of district-2 using District-1 data) along with its RMSE for a two week data.
Season Period p1 p2 p3 RMSE
June Day −0.020 2.217 −17.89 0.60
September Day 0.064 −3.461 76.6 0.83
December Day 0.013 0.010 16.7 0.26
March Day 0.033 −1.164 31.61 0.58
June Night 0.001 0.432 20.21 0.14
September Night −0.012 1.156 8.395 0.17
December Night −0.075 3.196 −10.9 0.16
March Night −0.001 0.491 13.93 0.12Sustainability 2020, 12, 156 12 of 15
Figure 10. Prediction for District-2 (LCZ-1) using concept of LCZ with Envi-met result of District 1.
4. Conclusions and Future Work
The main aim of this study was to create a validated map of the Local Climate Zones in Abu Dhabi
City. Due to rapid development in the region, having this data and this analysis helps understanding
the most problematic zones (where the UHI phenomena is higher). Based on these records, local
authorities can make necessary interventions to ‘’cool” the city of Abu Dhabi. This is an innovative
approach which relies on studying the UHI effect across different LCZs.
Furthemore, Envi-met models are developed for the studied LCZs and are calibrated using
a statistical model based on high-resolution and accuracy in-situ air temperature measurements.
The calibration is performed across various scenarios so that thermal modeling across Abu Dhabi
island can be performed with Envi-met to better understand temperature variation in different LCZ of
Abu Dhabi. The result of statistical correction shows the applied quadratic model can be applied for
calibration of the Envi-met results. A better accuracy is found for cooler periods compared to hotter
periods across all the mapped LCZs in Abu Dhabi. We believe that the concept of LCZ can be used
to estimate the temperature across other districts classified as the same LCZ and as a result it can be
further applied to other remaining parts of the Abu Dhabi island.
Future work is needed by the same process with more LCZ classes to better understand the
difference in temperature between zones. Also, 3D urban morphological data of the main island would
improve model fidelity of the city. The above results bring the attention towards reducing heat sources
and increasing shaded/green areas. Further strategies can be proposed to reduce UHI intensities as
part of future analysis. The LCZ map of Abu Dhabi main island will help analyzing different climate
scenarios in the city.
Author Contributions: All authors have read and agree to the published version of the manuscript. The author
contribution is as following: Conceptualization, P.M., L.B. and P.R.M.; methodology, P.M., L.B. and P.R.M.;
software, P.M. and L.B.; validation, P.M.; formal analysis, P.M. and L.B.; investigation, P.R.M. P.A. and A.T.;
resources, P.R.M.; data curation, P.R.M. P.A. and A.T.; writing—original draft preparation, P.M.; writing—review
and editing, P.M. and L.B.; visualization, P.M. and L.B.; supervision, P.M., L.B. and P.R.M.; project administration,
P.R.M.; funding acquisition, L.B.
Funding: This research received no external funding.
Acknowledgments: The authors of this study acknowledge the great support of the UAEU and Khalifa University.
The authors thank the below team for their valuable contribution: Afshin Afshari secured initial ADM approval
for deployment of lamp-post mounted stations; Mukesh Jha coded meteo-station measurement and SDC-recording
firmware with WiFi and 3G communications; MT Ali procured mounting hardware and supported sensor calibration.
Conflicts of Interest: The authors declare no conflict of interest.Sustainability 2020, 12, 156 13 of 15
Appendix A
Figure A1. Envi-met simulation output w.r.t temperature measured in different seasons (1st week) for
different districts.
Figure A2. Corrected Envi-met results output w.r.t in-situ temperature measured in different seasons
(2nd Week) for different districts.Sustainability 2020, 12, 156 14 of 15
References
1. Demuzere, M.; Bechtel, B.; Middel, A.; Mills, G. Mapping Europe into local climate zones. PLoS ONE 2019,
14, e0214474. [CrossRef] [PubMed]
2. Ching, J.; Mills, G.; Bechtel, B.; See, L.; Feddema, J.; Wang, X.; Ren, C.; Brousse, O.; Martilli, A.; Neophytou, M.;
et al. WUDAPT: An urban weather, climate, and environmental modeling infrastructure for the anthropocene.
Bull. Am. Meteorol. Soc. 2018, 99, 1907–1924. [CrossRef]
3. Bechtel, B.; Alexander, P.J.; Beck, C.; Böhner, J.; Brousse, O.; Ching, J.; Demuzere, M.; Fonte, C.; Gál,
T.; Hidalgo, J.; et al. Generating WUDAPT Level 0 data–Current status of production and evaluation.
Urban Clim. 2019, 27, 24–45. [CrossRef]
4. Martin, M.; Bande, L.; Marpu, P.; Afshari, A.; Al, M.; Mustafa, A.; Reddy, G. Data Extraction as Input for
the Energy analysis of an urban district with UMI. In Proceedings of the CIB MENA, Abu Dhabi, UAE,
14–16 December 2014; pp. 1–11.
5. Yin, C.; Yuan, M.; Lu, Y.; Huang, Y.; Liu, Y. Effects of urban form on the urban heat island effect based on
spatial regression model. Sci. Total Environ. 2018, 634, 696–704. [CrossRef]
6. Mills, G. Cities as agents of global change. Int. J. Climatol. 2007, 27, 1849–1857. [CrossRef]
7. Mills, G. Urban climatology: History, status and prospects. Urban Clim. 2014, 10, 479–489. [CrossRef]
8. Oke, T.R. City size and the urban heat island. Atmos. Environ. (1967) 1973, 7, 769–779. [CrossRef]
9. Bokwa, A.; Hajto, M.J.; Walawender, J.P.; Szymanowski, M. Influence of diversified relief on the urban heat
island in the city of Kraków, Poland. Theor. Appl. Climatol. 2015, 122, 365–382. [CrossRef]
10. Alexander, P.J.; Mills, G. Local climate classification and Dublin’s urban heat island. Atmosphere 2014,
5, 755–774. [CrossRef]
11. Emmanuel, R.; Krüger, E. Urban heat island and its impact on climate change resilience in a shrinking city:
The case of Glasgow, UK. Build. Environ. 2012, 53, 137–149. [CrossRef]
12. Lazzarini, M.; Marpu, P.R.; Ghedira, H. Temperature-land cover interactions: The inversion of urban heat
island phenomenon in desert city areas. Remote Sens. Environ. 2013, 130, 136–152. [CrossRef]
13. Lazzarini, M.; Molini, A.; Marpu, P.R.; Ouarda, T.B.; Ghedira, H. Urban climate modifications in hot desert
cities: The role of land cover, local climate, and seasonality. Geophys. Res. Lett. 2015, 42, 9980–9989. [CrossRef]
14. Stewart, I.D.; Oke, T.R. Local climate zones for urban temperature studies. Bull. Am. Meteorol. Soc. 2012,
93, 1879–1900. [CrossRef]
15. Stewart, I.; Oke, T. Classifying urban climate field sites by “local climate zones”: The case of Nagano, Japan.
In Proceedings of the IN: Seventh International Conference on Urban Climate, Yokohama, Japan, 29 June–3
July 2009; Volume 29.
16. Meier, F.; Scherer, D. Spatial and temporal variability of urban tree canopy temperature during summer 2010
in Berlin, Germany. Theor. Appl. Climatol. 2012, 110, 373–384. [CrossRef]
17. Lelovics, E.; Unger, J.; Gál, T.; Gál, C.V. Design of an urban monitoring network based on Local Climate
Zone mapping and temperature pattern modelling. Clim. Res. 2014, 60, 51–62. [CrossRef]
18. Lehnert, M.; Geletič, J.; Husák, J.; Vysoudil, M. Urban field classification by “local climate zones” in a
medium-sized Central European city: The case of Olomouc (Czech Republic). Theor. Appl. Climatol. 2015,
122, 531–541. [CrossRef]
19. Skarbit, N.; Gal, T.; Unger, J. Airborne surface temperature differences of the different Local Climate Zones
in the urban area of a medium sized city. In Proceedings of the 2015 Joint IEEE Urban Remote Sensing Event
(JURSE), Lausanne, Switzerland, 30 March–1 April 2015; pp. 1–4.
20. Alexander, P.J.; Mills, G.; Fealy, R. Using LCZ data to run an urban energy balance model. Urban Clim. 2015,
13, 14–37. [CrossRef]
21. Stewart, I.D.; Oke, T.R. Thermal differentiation of local climate zones using temperature observations from
urban and rural field sites. In Proceedings of the Ninth Symposium on Urban Environment, Keystone, CO,
USA, 2–6 August 2010; pp. 2–6.
22. Ng, Y.X. A study of urban heat island using “Local Climate Zones”—The case of Singapore. Br. J. Environ.
Clim. Chang. 2015, 116–133. [CrossRef]
23. Kotharkar, R.; Bagade, A. Local Climate Zone classification for Indian cities: A case study of Nagpur.
Urban Clim. 2018, 24, 369–392. [CrossRef]Sustainability 2020, 12, 156 15 of 15
24. Essa, S.M.; Loughland, R.; Khogali, M.E. Change detection analysis of multi-temporal imagery to assess
environmental development on AL Sammalyah Island, Abu-Dhabi. In Remote Sensing for Environmental
Monitoring, GIS Applications, and Geology V; International Society for Optics and Photonics: San Diego, CA,
USA, 2005; Volume 5983, p. 59830C.
25. Yagoub, M.; Kolan, G.R. Monitoring coastal zone land use and land cover changes of Abu Dhabi using
remote sensing. J. Indian Soc. Remote Sens. 2006, 34, 57–68. [CrossRef]
26. Website. Online Portal. Available online: http://www.f-in-d.com/stories/abu-dhabi-guide-2014-
introduction (accessed on 15 January 2019).
27. Website. Online Portal. Available online: https://www.politesi.polimi.it/handle/10589/132660?mode=full
(accessed on 18 December 2019).
28. Jha, M.; Marpu, P.R.; Chau, C.K.; Armstrong, P. Design of sensor network for urban micro-climate monitoring.
In Proceedings of the 2015 IEEE First International Smart Cities Conference (ISC2), Guadalajara, Mexico,
25–28 October 2015; pp. 1–4.
29. Jha, M.; Tsoupos, A.; Marpu, P.R.; Chau, C.K.; Armstrong, P. In-situ Sensor Network for Microclimate and
Urban Energy Modeling and Validation. In Proceedings of the Seventh International Conference on Future
Energy Systems Poster Sessions (e-Energy ’16), Waterloo, ON, Canada, 21–24 June 2016; ACM: New York,
NY, USA, 2016; pp. 1:1–1:2. [CrossRef]
30. Conrad, O.; Bechtel, B.; Bock, M.; Dietrich, H.; Fischer, E.; Gerlitz, L.; Wehberg, J.; Wichmann, V.; Böhner,
J. System for automated geoscientific analyses (SAGA) v. 2.1. 4. Geosci. Model Dev. 2015, 8, 1991–2007.
[CrossRef]
31. Aida, M. Urban albedo as a function of the urban structure—A model experiment. Bound.-Layer Meteorol.
1982, 23, 405–413. [CrossRef]
32. Bruse, M. Modelling and strategies for improved urban climates. In Proceedings of the International
Conference on Urban Climatology & International Congress of Biometeorology, Sydney, Australia,
8 November 1999; pp. 8–12.
33. Bruse, M. Simulating microscale climate interactions in complex terrain with a high-resolution numerical
model: A case study for the Sydney CBD area. In Proceedings of the International Conference on Urban
Climatology & International Congress of Biometeorology, Sydney, Australia, 8 November 1999.
34. Leconte, F.; Bouyer, J.; Claverie, R.; Pétrissans, M. Estimation of spatial air temperature distribution
at sub-mesoclimatic scale using the LCZ scheme and mobile measurements. In Proceedings of the 9th
International Conference on Urban Climate (ICUC9) Jointly with 12th Symposium on the Urban Environment,
Toulouse, France, 20–24 July 2015.
35. Bruse, M. ENVI-met 3.0: Updated Model Overview; University of Bochum: Bochum, Germany, 2004. Available
online: www.envi-met.com (accessed on 18 December 2019).
36. Huttner, S.; Bruse, M. Numerical modeling of the urban climate—A preview on ENVI-met 4.0. In Proceedings
of the 7th International Conference on Urban Climate ICUC-7, Yokohama, Japan, 29 June–3 July 2009;
Volume 29.
c 2019 by the authors. Licensee MDPI, Basel, Switzerland. This article is an open access
article distributed under the terms and conditions of the Creative Commons Attribution
(CC BY) license (http://creativecommons.org/licenses/by/4.0/).You can also read