SPR Biosensor Based on Polymer Multi-Mode Optical Waveguide and Nanoparticle Signal Enhancement - MDPI
←
→
Page content transcription
If your browser does not render page correctly, please read the page content below
sensors
Article
SPR Biosensor Based on Polymer Multi-Mode Optical
Waveguide and Nanoparticle Signal Enhancement
Johanna-Gabriela Walter 1 , Alina Eilers 1 , Lourdes Shanika Malindi Alwis 2 ,
Bernhard Wilhelm Roth 3,4 and Kort Bremer 4, *
 1    Institute of Technical Chemistry, Leibniz University of Hannover, 30167 Hannover, Germany;
      walter@iftc.uni-hannover.de (J.-G.W.); eilers@iftc.uni-hannover.de (A.E.)
 2    School of Engineering and the Built Environment, Edinburgh Napier University, Edinburgh EH10 5DT, UK;
      L.Alwis@napier.ac.uk
 3    Cluster of Excellence PhoenixD (Photonics, Optics, and Engineering—Innovation Across Disciplines),
      30167 Hannover, Germany; bernhard.roth@hot.uni-hannover.de
 4    Hannover Centre for Optical Technologies, Leibniz University of Hannover, 30167 Hannover, Germany
 *    Correspondence: Kort.Bremer@hot.uni-hannover.de

 Received: 20 April 2020; Accepted: 18 May 2020; Published: 20 May 2020

 Abstract: We present a surface plasmon resonance (SPR) biosensor that is based on a planar-optical
 multi-mode (MM) polymer waveguide structure applied for the detection of biomolecules in the
 lower nano-molar (nM) range. The basic sensor shows a sensitivity of 608.6 nm/RIU when exposed to
 refractive index changes with a measurement resolution of 4.3 × 10⁻³ RIU. By combining the SPR
 sensor with an aptamer-functionalized, gold-nanoparticle (AuNP)-enhanced sandwich assay, the
 detection of C-reactive protein (CRP) in a buffer solution was achieved with a response of 0.118 nm/nM.
 Due to the multi-mode polymer waveguide structure and the simple concept, the reported biosensor
 is well suited for low-cost disposable lab-on-a-chip applications and can be used with rather simple
 and economic devices. In particular, the sensor offers the potential for fast and multiplexed detection
 of several biomarkers on a single integrated platform.

 Keywords: surface plasmon resonance (SPR); sensor; planar-optical; multi-mode; waveguide;
 biosensor; aptamer; gold-nanoparticle; lab-on-a-chip

1. Introduction
      The detection of biomarkers in body fluids plays a vital role in early diagnosis and treatment of
diseases. However, the potential of biomarkers for the said purpose is not explored to its full capacity
due to limitations in the current sensing technologies [1]. This results from the fact that biomarkers are
often present at very low concentrations in combination with other proteins, making their identification
a strenuous task. In addition, the detection of a particular biomarker at very low concentrations is not
only challenging, but also time-consuming [2]. Current methods of detection include enzyme-linked
immunosorbent assays (ELISA), surface plasmon resonance (SPR) spectroscopy, surface enhanced
Raman spectroscopy and fluorescence-based detection [2–8]. Amongst these, SPR presents the most
advanced label-free and real-time biomarker detection capability [9–13]. The ability of SPR to monitor
the interaction between a molecule immobilized on the surface of the sensor and the molecular partner
in a solution has rendered it a powerful tool for biomolecular interaction analysis [14].
      The classic Kretschmann configuration, a high refractive index prism whose one surface is coated
with a thin metallic layer, is commonly applied for exciting SPR, where the incident light intensity
that satisfies the plasmonic condition (resulting in the excitation of surface plasmons of the metal),
changes in response to variations in the surrounding refractive index. However, in this configuration

Sensors 2020, 20, 2889; doi:10.3390/s20102889                                  www.mdpi.com/journal/sensors
Sensors 2020, 20, 2889                                                                              2 of 11

the required SPR spectrometer is relatively bulky, costly and, thus, restricted to applications in
laboratory environments [15]. Since the miniaturization of the detection scheme, in the interest of
portability, would be complex, its use in remote sensing or lab-on-a-chip applications would be limited.
In comparison, optical fiber-based SPR sensors [16] have the advantages of being small size, offering
flexibility in integration and requiring much lower amounts of the analyte sample. A comprehensive
amount of work and analysis on optical fiber-based sensors utilizing SPR for applications from chemical-
to bio-sensing and its progress within the last decade can be found in the literature [17–19]. With the
biomedical sector drawing more and more towards lab-on-a-chip schemes, the optical fiber-based
biosensor technology is currently seeing a trend towards integration into “micro-chips” that has the
capability of multi-parameter sensing in the future [18,20].
       Such integrated planar optical waveguide-based biosensors entail label-free and non-destructive
detection, higher sensitivity and a lower detection limit, cost efficiency and simple production,
as well as multiplexing and miniaturization capabilities which lead to low reagent consumption, short
analysis time and open prospects for point-of-care applications [20]. In particular, SPR sensors based
on integrated optical polymer waveguides [21] offer all the aforementioned advantages, the most
prominent feature being the multiplexed detection capability of several analytes [22,23]. For example,
immobilization of biorecognition elements, i.e., on the gold surface of the SPR sensor, can be performed
using microfluidic channels where the whole functionalization process or its final steps involving
delivery of biorecognition elements to a specific sensing channel is performed with the on-chip
microfluidics [14]. Moreover, several SPR sensors can be operated in parallel on a relatively small
spatial area and potentially several biomarkers can be detected per sample simultaneously. For instance,
single-mode (SM) waveguide based SPR sensors have been reported that are fabricated using a polymer
imprinting process [22,24] or by using the spin coating and photolithography process [23].
       On the other hand, multi-mode (MM) waveguide structures have the advantage that, due to
the relatively large cross-section of the waveguide core, light coupling in and out of the structure
is less critical compared to the single-mode case. Thus, this kind of photonic device is especially
suited for mass-market products such as disposable lab-on-a-chip devices that can be interrogated by
using a low-cost light source and spectrometer, such as the flash light and camera electronics that are
readily available in smartphones [25]. Indeed, this forms the basis of the novelty presented herein,
i.e., the utilization of the already in-built electronics of a commonly available device that is used by
almost the entire world and the evaluation of its potential for biosensing. This approach cuts down
the potential cost of interrogation, i.e., as the source/detector is already in-built and equipped with
appropriate software, making it a viable option for cost efficient mass production. In addition, the
proposed design could transfer conventional SPR sensing, which is currently restricted to laboratory
settings, into the global consumer world, through the careful combination of an integrated polymer
waveguide, SPR sensors and the in-built electronics of a smartphone.
       However, when optical MM waveguides are utilized for SPR sensor applications each mode
of the waveguide structure couples at a slightly different wavelength with the surface plasmons
(the corresponding propagation constants match at different wavelengths), and thus, the resulting SPR
spectrum becomes relatively broad. This, in turn, limits the resolution to refractive index changes of the
surrounding media since the exact minimum position of the resonance is more difficult to track due to
the relatively broad resonance and modal noise. Therefore, biomarker detection in the nanomolar (nM)
concentration range is usually difficult to achieve with this kind of technology, particularly bearing
in mind that the main performance indicators for plasmonic biochemical sensors are not only their
sensitivity, but also their accuracy, repeatability and limits of detection (LOD) [3,26,27].
       The proposed design addresses these important issues through the novel combination of
planar-optical MM polymer waveguide SPR sensors and aptamer-assisted gold nanoparticle
(AuNPs)-enhanced sandwich assays, which ultimately enables the detection of biomolecules down
to nM concentrations. The combination of SPR spectroscopy and AuNP enhanced sandwich assays
was proven to be a very powerful tool to achieve high sensitivities [28–30], even down to femtomolar
Sensors 2020, 20, 2889
x FOR PEER REVIEW 3 of 11
concentrations [31]. However, to the best of our knowledge, the combination of planar-optical MM
(fM) concentrations
polymer waveguide[31]. SPR However,
sensors toand the best of our knowledge,
aptamer-assisted gold the combination
nanoparticle of planar-optical
(AuNPs)-enhanced
MM polymer waveguide SPR sensors and aptamer-assisted gold nanoparticle
sandwich assays has not been investigated to date, thus providing an opportunity for the novel (AuNPs)-enhanced
sandwich assays has We
approach suggested. not been investigated
demonstrate to date, thus
the capability providing
of this an opportunity
combination for the novel
as a new technique for
approach suggested.
biomarker detection. We demonstrate the capability of this combination as a new technique for
biomarker detection. the functionality of the sensor, C-reactive protein (CRP) was chosen as a model
To demonstrate
To demonstrate
analyte, which was the functionality
detected in buffer of the sensor,using
solutions C-reactive protein (CRP) and
an aptamer-based was chosen as a model
gold nanoparticle
analyte, which was detected in buffer solutions using an aptamer-based
(AuNP)-enhanced sandwich assay. CRP is an acute phase response protein that represents an and gold nanoparticle
(AuNP)-enhanced
inflammation marker sandwich
and canassay.
be used CRP forismonitoring
an acute phase response protein
of exacerbations that represents
in chronic inflammatory an
inflammation marker and can be used for monitoring of exacerbations in
conditions [32]. Clinically, CRP detection is used to differentiate the infection caused by bacteria from chronic inflammatory
conditions
virus [33]. [32].
High Clinically,
levels of CRP CRPare detection
observed is used
after to differentiate
trauma, tissue the infection
necrosis, causedsurgery
infection, by bacteria
and
from virus [33]. High levels of CRP are observed after trauma, tissue necrosis,
myocardial infarction and are associated with an increased risk of cardiovascular diseases, especially infection, surgery and
myocardial
coronary heart infarction
diseaseand risk,are associated
which withcause
is a leading an increased
of deathrisk of cardiovascular
in adults [34]. Due to its diseases,
importanceespecially
in the
coronary
diagnosis of diseases, the detection of CRP in a lab-on-a-chip scheme would be highly attractive in
heart disease risk, which is a leading cause of death in adults [34]. Due to its importance to
the diagnosis
medical sectors. of diseases,
Even though the detection of CRPmethods
to date, several in a lab-on-a-chip
have beenscheme developed would be highly
for CRP attractive
detection to
[35,36],
medical
including sectors.
SPR-based Even sensing
though to date,
[37], theseveral
opticalmethods have been detection
waveguide-based developedschemes
for CRPdesigned
detection for
[35,36],
this
including SPR-based sensing [37], the optical waveguide-based detection
purpose are mostly focused on the sensor (or indeed the sensing region) being an optical fiber as schemes designed for this
purpose
opposed are mostly
to being focused oninthe
incorporated sensor (or indeed
a waveguide structure the sensing region) being an optical fiber as
[33,34].
opposed to being incorporated in a waveguide structure [33,34].
In light of the discussion presented above, the goal of this study is to demonstrate a planar SPR
In light of
sensor using the discussion
integrated polymer presented above, thethat
MM waveguides goalcan
of be
thisinterrogated
study is to demonstrate
using a smartphone a planarinSPR
the
sensor using integrated polymer MM waveguides that can be interrogated
future. Consequently, the strengths of the herewith proposed scheme are its adaptability and thus its using a smartphone in
the
highfuture.
potential Consequently,
in utilizing athe strengths
single “chip”offor the herewith proposed
multi-biomarker scheme
sensing and theare higher
its adaptability
tuning ofand the
thus its high potential in utilizing a single “chip” for multi-biomarker
detection scheme, as well as potentially low-cost interrogation by using the source/detection sensing and the higher tuning
of the detection
electronics that arescheme,
readilyas available
well as potentially
in a portable low-cost interrogation
device, i.e., even inby theusing the source/detection
simplest of smartphones
electronics that are readily available in a portable device, i.e., even in
currently available [25]. Together with initial laboratory results and analysis, the communicationthe simplest of smartphones
currently available [25]. Together with initial laboratory results and analysis,
herein presents the design incorporating the MM waveguide SPR sensor in tandem with an aptamer- the communication herein
presents the design incorporating the MM waveguide
assisted AuNP-enhanced assay with CRP as a model biomarker. SPR sensor in tandem with an aptamer-assisted
AuNP-enhanced assay with CRP as a model biomarker.
2. Sensor Design and Fabrication
2. Sensor Design and Fabrication
For the specific detection of the biomarker, aptamers were employed for sensor
For the specific detection of the biomarker, aptamers were employed for sensor functionalization.
functionalization. Suitable capture aptamers were immobilized on the sensor surface and detection
Suitable capture aptamers were immobilized on the sensor surface and detection aptamers were
aptamers were conjugated to AuNPs resulting in an AuNP-enhanced sandwich system. Since CRP is
conjugated to AuNPs resulting in an AuNP-enhanced sandwich system. Since CRP is a pentameric
a pentameric protein consisting of five identical subunits, the same aptamer could be exploited for
protein consisting of five identical subunits, the same aptamer could be exploited for capture and
capture and detection in our approach. A schematic of the proposed sensor configuration is shown
detection in our approach. A schematic of the proposed sensor configuration is shown in Figure 1.
in Figure 1.
Figure
Figure 1. Schematic of
1. Schematic of the
the developed
developed polymer
polymer based
based multi-mode
multi-mode (MM)
(MM) planar-optical
planar-optical waveguide
waveguide
surface plasmon resonance (SPR) sensor. By using a gold-nanoparticle (AuNP)-enhanced
surface plasmon resonance (SPR) sensor. By using a gold-nanoparticle (AuNP)-enhanced aptamer-based
aptamer-
sandwich assay, the
based sandwich shiftthe
assay, of shift
the SPR wavelength
of the due to the
SPR wavelength binding
due of the target
to the binding molecule
of the (in this case
target molecule (in
C-reactive protein (CRP))
this case C-reactive protein is (CRP))
increased.
is increased.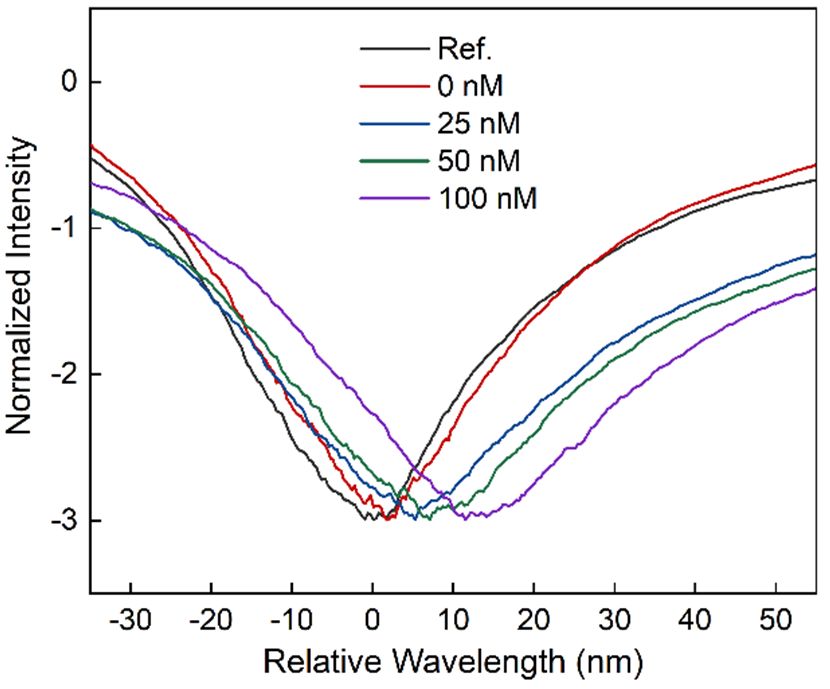
Sensors 2020, 20, 2889                                                                              4 of 11

     The planar-optical MM polymer waveguide structure is fabricated using a combination of hot
embossing and doctor blading (see Section 3.1; details can also be found in [38,39]). For detection of
CRP, a specific surface functionalization is applied (explained in Section 3.2). Due to the binding of the
AuNPs on the target molecule, the shift of the SPR wavelength is significantly enhanced and hence
detection of the molecule at low concentrations is ultimately feasible despite the modal noise exhibited
by the MM waveguide structure. This would not be possible with the setup otherwise.

3. Materials and Methods

3.1. Fabrication of Planar-Optical SPR Waveguide Sensors
     The fabrication of the planar-optical SPR waveguide sensor consists of two steps. In the first
step, the planar-optical waveguide structure is manufactured. This step is followed by the coating
of the waveguide surface with a thin gold film. The fabrication of the waveguide is based on the
technique developed by Rezem et al. and is described in detail elsewhere [38,39]. Here, we briefly
summarize the main points. First, a silicon wafer stamp containing a negative copy of the structure to
be realized is employed to replicate the waveguide cladding structure into a 375 µm thick PMMA sheet
(Plexiglas XT 99524, Röhm GmbH, Darmstadt, Germany) using hot embossing. After the embossing
process, the so-called doctor blading method is applied to fill the optical waveguide cladding structure
with liquid optical epoxy material, which has a higher refractive index compared to PMMA, in order
to form the optical waveguide structure. The waveguide core is solidified through illumination
with a UV light source (UV Transilluminator MUV21, Major Science, Saratoga, NY, USA). In our
case, we employed the UV curable epoxy NOA 63 with a refractive index of 1.56 as waveguide core
material. Optical waveguide structures fabricated with this technique and the above materials exhibit
an optical attenuation as low as 0.037 dB/mm which is obtained by characterization through the
cut-back method [38].
     In the second stage of the fabrication process, the surface of the planar-optical waveguide structure
was coated with a 40 nm thick gold layer. In order to achieve a strong bonding between the applied
polymers and the thin gold layer, a thin layer of titanium (2 nm) was applied as an adhesive layer.
The total length of the planar-optical waveguide structure was 40 mm and the dimension (cross-section)
of the waveguide itself was 25 × 25 µm2 . As shown in Figure 1, a bending region was introduced to
the waveguide (with a bending radius of 5 mm) in order to enhance mode coupling and consequently
obtain a more uniform mode energy distribution. After the fabrication process of the planar-optical
SPR waveguide sensor structure was complete, a microfluidic chip (Ibidi sticky-Slide VI 0.4, Ibidi,
Munich, Germany) containing four microfluidic channels was attached and glued on top of the
gold surface. Each microfluidic channel has a length of 17 mm, a width of 3.8 mm and a height of
400 µm. The microfluidic channels were aligned on the gold surface so that the direction of the fluid
flow containing the target molecules to be detected is perpendicular to the planar-optical waveguide
direction. Thus, the resulting length of each SPR sensor per channel is 3.8 mm. The fluid inlet and
outlet of the microfluidic chip are standardized female Luer adapters.

3.2. Surface Functionalization for the Detection of CRP
     The gold surface was coated with streptavidin in the first step of the developed functionalization
procedure. For this purpose, streptavidin (Roth GmbH, Germany) was diluted in phosphate buffered
saline, pH 7.4 (PBS) at a concentration of 2.5 mg/mL, and the solution was incubated on the sensor
surface for 1 h at room temperature and additionally for 16 h at 4 ◦ C. Consequently, the sensor was
washed thoroughly with PBS and rinsed 2 times with ddH2 O before it was dried with compressed
nitrogen. Streptavidin modified sensors were stored at 4 ◦ C in a dry environment prior to use.
     Then, Anti-CRP aptamer Apt1 with the sequence GGCAGGAAGACAAACACGATGGGGGGGT
ATGATTTGATGTGGTTGTTGCATGA-TCGTGGTTGTGGTGCTGT [40] and 50 termial biotin
modification (IDT) was used for further modification of the sensor. In order to do so, the biotinylated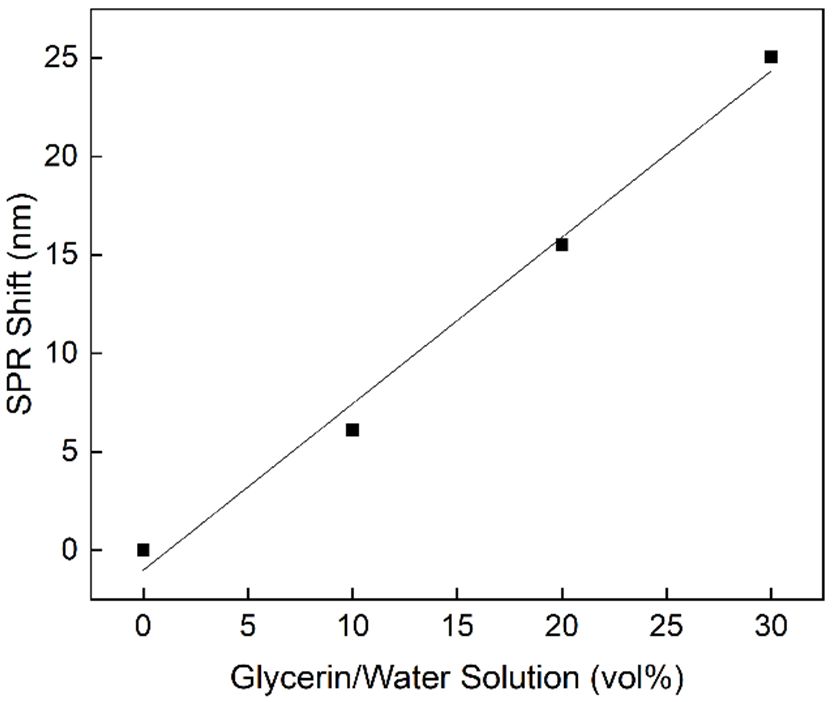
Sensors 2020, 20, 2889 5 of 11
Sensors 2020, 20, x FOR PEER REVIEW 5 of 11
biotin interaction. Afterwards, unbound aptamers were removed by rinsing the sensor with PBS two
Apt1 was diluted to 1 µM in PBS and incubated on the sensor surface for 1 h at room temperature to
times and one additional washing step using binding buffer (BB) composed of 10 mM Tris, 50 mM
bind to the sensor via streptavidin-biotin interaction. Afterwards, unbound aptamers were removed
NaCl, 2 mM CaCl2, 10 mM MgCl2, 5 mM KCl, pH 7.5.
by rinsing the sensor with PBS two times and one additional washing step using binding buffer (BB)
composed of 10 mM Tris, 50 mM NaCl, 2 mM CaCl2 , 10 mM MgCl2 , 5 mM KCl, pH 7.5.
3.3. Synthesis and Modification of AuNPs
3.3. Synthesis
AuNPs were and Modification
prepared via of kinetically
AuNPs controlled seeded growth synthesis as described by Bastús
et al.AuNPs
[41] with ten consecutive
were prepared via rounds of additions
kinetically of HAuCl
controlled seeded4 and sodium citrate. This resulted in a
growth synthesis as described by
colloidal gold solution with a light absorption maximum
Bastús et al. [41] with ten consecutive rounds of additions of HAuCl at 522 nm. The size of the produced AuNPs
4 and sodium citrate. This resulted
was
in determined
a colloidal goldtosolution
be 17 nmwith via transmission
a light absorptionelectron
maximummicroscopy (TEM)
at 522 nm. Theusing
size ofa field-emission
the produced
instrument of the type JEOL JEM-2100F-UHR. The AuNPs were diluted to obtain
AuNPs was determined to be 17 nm via transmission electron microscopy (TEM) using a field-emission a light absorption at
the absorption maximum (Amax) of 0.7, and streptavidin was added to a
instrument of the type JEOL JEM-2100F-UHR. The AuNPs were diluted to obtain a light absorption final concentration of 50
µg/mL
at in 10 mM sodiumphosphate
the absorption maximum (Amax)pH of 7.4.
0.7,To
andavoid agglomeration
streptavidin of the to
was added AuNPs
a finalduring adsorption
concentration of
of streptavidin, the AuNPs were stirred during the addition of streptavidin
50 µg/mL in 10 mM sodiumphosphate pH 7.4. To avoid agglomeration of the AuNPs during adsorption and for an additional
hour
of at room temperature.
streptavidin, the AuNPs were The stirred
resulting mixture
during was stored
the addition at 4 °C for 16
of streptavidin h. for
and Consequently,
an additionalresidual
hour at
streptavidin was removed via centrifugation and the
◦ conjugates were washed
room temperature. The resulting mixture was stored at 4 C for 16 h. Consequently, residual streptavidin with ddH 2O.
Biotinylated
was removed via Apt1 was addedand
centrifugation to the
theconjugates
streptavidin-modified
were washed with AuNPsddH(Amax = 3.5) at a final
2 O. Biotinylated Apt1 was
added to the streptavidin-modified AuNPs (Amax = 3.5) at a final concentration of 10 µM tofree
concentration of 10 µM to be bound at the NP surface. After overnight incubation, residual
be bound at
aptamer was removed using centrifugation and washing in ddH O, and a
the NP surface. After overnight incubation, free residual aptamer was removed using centrifugation
2 stock solution of and
the
aptamer-modified
washing in ddH2 O,AuNPs (Amax
and a stock = 2) was
solution prepared.
of the aptamer-modified AuNPs (Amax = 2) was prepared.
3.4. Experimental Setup
The SPR sensor spectrum was captured in transmission mode using a cost-effective white light
LED (Thorlabs MCWHF2) and an an optical
optical spectrometer
spectrometer(Avantes
(Avantes AvaSpec-3648,
AvaSpec-3648, Avantes,
Avantes, Apeldoorn,
Netherlands). The
Netherlands). Thelight
lightcoupling
coupling intointo
andand
out ofout
theofplanar-optical
the planar-optical SPR waveguide
SPR waveguide sensor wassensor was
achieved
achieved
using using
optical optical
glass fibers.glass fibers.
For the lightFor the light
coupling intocoupling into thestructure,
the waveguide waveguide structure,
tapered tapered
graded-index
graded-index
MM MMfibers
optical glass optical glass
(OM4) withfibers (OM4)
a spot with of
diameter a 25
spotµmdiameter
(ThorlabsofLFM100.
25 µm (Thorlabs
Thorlabs, LFM100.
Newton,
Thorlabs,
NJ, Newton,
USA) were NJ, In
applied. USA)
orderwere applied.
to collect In order
the light that to collect the
is coupled outlight
of thethat is coupledwaveguide
planar-optical out of the
planar-optical
structure, waveguide
a step-index MM structure,
fiber with a numerical
step-indexaperture
MM fiber with=a0.5
of NA numerical
was usedaperture
(ThorlabsofFP200URT.
NA = 0.5
was used Newton,
Thorlabs, (ThorlabsNJ, FP200URT.
USA). TheThorlabs,
alignment Newton, NJ, USA).
of the optical The
fibers alignment
relative to theofplanar-optical
the optical fibers
SPR
relative to sensor
waveguide the planar-optical
was realized SPRusingwaveguide
a linear stagesensor was realized
(Thorlabs RBL13D/M.using a linear
Thorlabs, stage (Thorlabs
Newton, NJ, USA)
RBL13D/M.
for Thorlabs,
each fiber. Newton, NJ,
The experimental USA)
setup usedforiseach fiber. The
presented experimental
in Figure 2, whichsetup
showsused
theisplanar-optical
presented in
Figure 2, which
waveguide SPR shows
sensor the
withplanar-optical waveguide
microfluidic chip as wellSPR sensor
as the light with microfluidic
coupling in and outchip
of as
thewell as the
structure
light
by thecoupling in and
optical glass out of the structure by the optical glass fibers.
fibers.
Figure 2.2.Picture
Pictureof of
thethe
experimental setupsetup
experimental showing the planar-optical
showing waveguide
the planar-optical SPR sensor
waveguide SPRincluding
sensor
the microfluidic
including chip (middle)
the microfluidic chipas(middle)
well as the two optical
as well glass
as the two fibersglass
optical for light coupling
fibers into
for light (right) into
coupling and
out (left)
(right) andof out
the (left)
structure.
of the structure.
For
For each
eachmeasurement,
measurement, thethe
sensor spectra
sensor werewere
spectra recorded using the
recorded usingspectrometer softwaresoftware
the spectrometer Avantes
avasoft8, and the captured spectra was analyzed using Matlab. Following this, the signal
Avantes avasoft8, and the captured spectra was analyzed using Matlab. Following this, the signalnoise of the
sensor
noise ofspectra was reduced
the sensor usingreduced
spectra was a smooth-average
using a smooth-average (N =operation
filter operationfilter 30), and the(N position of the
= 30), and the
position of the SPR wavelength was calculated using the “center of mass” method [42], i.e., the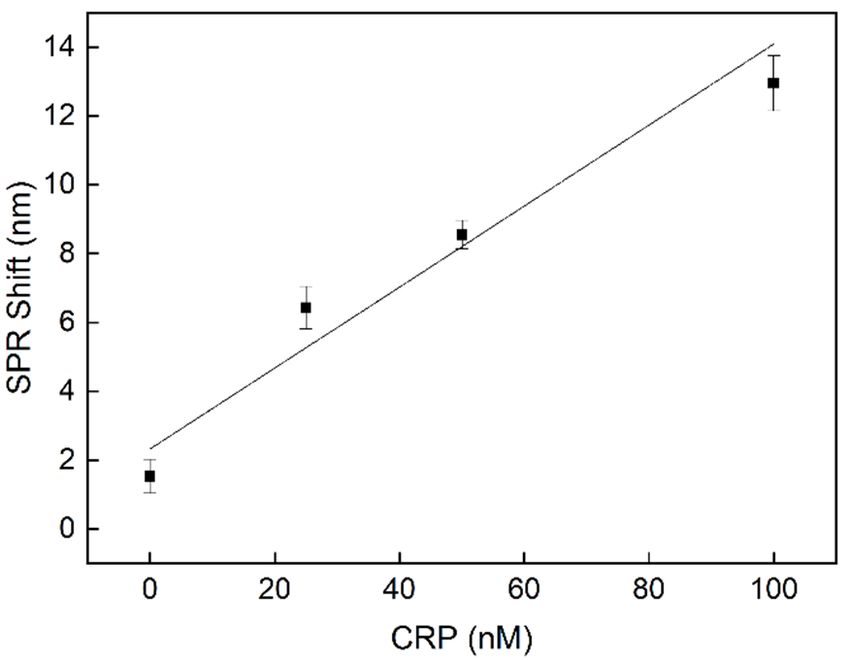
Sensors 2020, 20, 2889 6 of 11
Sensors 2020, 20, x FOR PEER REVIEW 6 of 11
SPR wavelength
wavelength of thewas calculated
measured using minimum
intensity the “center(maximum
of mass” method [42], i.e.,
light coupling the wavelength
between waveguideof and
the
measured intensity minimum (maximum light coupling between
surface plasmon) in the transmission spectrum was tracked. waveguide and surface plasmon) in
the transmission spectrum was tracked.
3.5. CRP Sensing
3.5. CRP Sensing
The aptamer-modified sensor was exposed to different concentrations of CRP purified from
The aptamer-modified sensor was exposed to different concentrations of CRP purified from
human plasma (BioRad) in the BB. For each measurement, 50 µL of the solution was incubated on
human plasma (BioRad) in the BB. For each measurement, 50 µL of the solution was incubated on the
the sensor for 30 min. Non-bound CRP was removed by rinsing the sensor with 600 µL of BB and
sensor for 30 min. Non-bound CRP was removed by rinsing the sensor with 600 µL of BB and 50% BB
50% BB respectively. Afterwards, aptamer-conjugated AuNPs were diluted to A525 = 1 in BB, and the
respectively. Afterwards, aptamer-conjugated AuNPs were diluted to A525 = 1 in BB, and the sensor
sensor was exposed to 50 µL of this solution for 10 min. Finally, the sensor was washed with 600 µL
was exposed to 50 µL of this solution for 10 min. Finally, the sensor was washed with 600 µL of 50%
of 50% BB and H2O before the readout was performed in H2O. To investigate unspecific binding, the
BB and H2 O before the readout was performed in H2 O. To investigate unspecific binding, the sensor
sensor was exposed to 10% CRP-free human serum (HyTest Ltd., Turku, Finland) in BB for 30 min
was exposed to 10% CRP-free human serum (HyTest Ltd., Turku, Finland) in BB for 30 min before
before AuNP-based signal enhancement was performed as described above.
AuNP-based signal enhancement was performed as described above.
4. Results
4. Results
4.1. Response
4.1. of the
Response of the Polymer
Polymer Based
Based Planar
Planar MM
MM Optical
Optical SPR
SPR Sensor
Sensor to
to RI
RI Changes
Changes
For the
For the initial
initial characterization
characterization of of the
the sensitivity
sensitivity of the planar-optical
of the planar-optical waveguide
waveguide SPR SPR sensor,
sensor,
different refractive index (RI) solutions of glycerin and water with volume percent
different refractive index (RI) solutions of glycerin and water with volume percent (vol%) of (vol%) of glycerin
glycerin
(0%, 10%,
(0%, 10%, 20%
20% and
and 30%)
30%) were
were applied
applied asas described
described in
in [25].
[25]. The
The fabricated
fabricated planar-optical
planar-optical SPR SPR sensor
sensor
was tested
was tested with
with different
different glycerin/water
glycerin/water solutions
solutions and
and the
the obtained
obtained SPRSPR spectra
spectra as
as well
well asas the
the shift
shift
of the SPR wavelength to the different glycerin/water solutions were determined.
of the SPR wavelength to the different glycerin/water solutions were determined. This is depicted This is depicted in
Figure 3. The measured spectra and the center of the SPR wavelength were
in Figure 3. The measured spectra and the center of the SPR wavelength were obtained using the obtained using the
algorithm explained
algorithm explained in in Section
Section 3.4.
3.4.
From Figure 3 it follows
From Figure 3 it follows that that the
the SPR
SPR wavelength
wavelength shifts
shifts towards
towards higher
higher wavelengths
wavelengths with with
increasing glycerin
increasing glycerin concentrations.
concentrations. This behavior agrees
This behavior agrees well
well with
with other
other optical
optical waveguide-based
waveguide-based SPR SPR
sensors reported in the literature. Furthermore, a linear behavior of 0.845 nm/vol% (R 2 = 0.99) could be
sensors reported in the literature. Furthermore, a linear behavior of 0.845 nm/vol% (R = 0.99) could be
2
measured, which
measured, which isis equal
equal to to 608.6
608.6 nm/RIU
nm/RIU whenwhenexpressed
expressedin inrefractive
refractiveindex
indexunits
units(RIU)
(RIU)[25].
[25].
(a) (b)
Figure 3.
Figure 3. Response
Response ofof the
the planar-optical
planar-optical MM SPR waveguide sensor to different glycerin/water
glycerin/water
solutions. (a) The resulting transmission spectrum for different glycerin/water solutions and (b) the
the
corresponding
corresponding SPR
SPR wavelength
wavelength shift
shift for
for each
each transmission
transmission spectrum.
spectrum.
4.2. Signal Noise
4.2. Signal Noise of
of Polymer
Polymer Based
Based MM
MM Planar
Planar Optical
Optical SPR
SPR Sensor
Sensor
The
The signal
signal noise
noise of
of the
the polymer-based
polymer-based MMMM optical
optical waveguide
waveguide SPR
SPR sensor
sensor was
was evaluated
evaluated with
with
the
the experimental setup described in Section 3.4 and by applying water as a refractive index
experimental setup described in Section 3.4 and by applying water as a refractive index medium
medium
(n = 1.33) as well as taking nine measurements. When conducting the signal noise tests, a standard
deviation of 0.87 nm was obtained for the measured SPR wavelength (calculation of the minimumSensors 2020, 20, 2889 7 of 11
Sensors
(n 2020,as
= 1.33) 20,well
x FORasPEER REVIEW
taking 7 of 11
nine measurements. When conducting the signal noise tests, a standard
deviation of 0.87 nm was obtained for the measured SPR wavelength (calculation of the minimum
position in the measured SPR transmission spectrum was performed using the algorithm described
position in the measured SPR transmission spectrum was performed using the algorithm described in
in Section 3.4). When applying the equation for determining the LOD according to Hastings [26], a
Section 3.4). When applying the equation for determining the LOD according to Hastings [26], a LOD
LOD of 4.3 × 10⁻³ RIU for the detection of RI was obtained. The relatively high LOD, i.e., compared to
of 4.3 × 10⁻³ RIU for the detection of RI was obtained. The relatively high LOD, i.e., compared to
Suzuki et al. [43] who reported a LOD of 2.3 × 10⁻⁵ RIU, can be explained by modal noise of the MM
Suzuki et al. [43] who reported a LOD of 2.3 × 10⁻⁵ RIU, can be explained by modal noise of the MM
waveguide structure. As described in Section 3.4, optical glass fibers were applied for the purpose of
waveguide structure. As described in Section 3.4, optical glass fibers were applied for the purpose of
light coupling, i.e., light into and out of, to the planar-optical waveguide. Since the position of the
light coupling, i.e., light into and out of, to the planar-optical waveguide. Since the position of the
fibers relative to the core of the planar-optical waveguide is sensitive to external perturbations such
fibers relative to the core of the planar-optical waveguide is sensitive to external perturbations such
as slight temperature variations or vibrations, minor spatial fiber-to-waveguide position variations
as slight temperature variations or vibrations, minor spatial fiber-to-waveguide position variations
cause different modal excitations in the waveguide and thus variations in the detected SPR
cause different modal excitations in the waveguide and thus variations in the detected SPR wavelength
wavelength (minimum position of the measured intensity transmission spectrum).
(minimum position of the measured intensity transmission spectrum).
4.3. Detection
4.3. Detection of
of CRP
CRP Concentration
Concentration
In order
In order to
to demonstrate
demonstrate the the capability
capability ofof the
the developed
developed sensor
sensor concept
concept toto detect
detect biomarkers
biomarkers withwith
high sensitivity, the aptamer-assisted AuNP-enhanced sandwich assay was
high sensitivity, the aptamer-assisted AuNP-enhanced sandwich assay was applied and evaluated applied and evaluated
using the
using theacute
acutephase
phaseprotein
proteinCRP CRP and
and a DNA
a DNA aptamer
aptamer directed
directed against
against CRP.CRP. For purpose,
For this this purpose, the
the gold
gold surface of the planar-optical SPR sensor was modified according to the protocols
surface of the planar-optical SPR sensor was modified according to the protocols described in Section 3.2 described in
Section 3.2 (steps II and III in Figure 1). The sensor response was determined
(steps II and III in Figure 1). The sensor response was determined again using the experimental setup again using the
experimental
and setup
the algorithm and the algorithm
explained in Section explained
3.4. The SPR in Section
wavelength3.4. The
was SPR wavelength
measured was measured
with water (n = 1.33)
with water (n = 1.33) as a surrounding buffer medium before and
as a surrounding buffer medium before and after the addition of CRP and aptamer-modifiedafter the addition of CRP and
AuNPs
aptamer-modified AuNPs for signal enhancement, see Section 3.5 (steps IV
for signal enhancement, see Section 3.5 (steps IV and V in Figure 1). When only CRP has bonded and V in Figure 1). When
only
to theCRP hassurface,
sensor bondedno to shift
the sensor
of the surface, no shift of
SPR wavelength the SPR
could wavelength
be detected and could be detected
consequently and
the SPR
consequently the SPR sensor structure itself was not capable of detecting biomarkers
sensor structure itself was not capable of detecting biomarkers in the nM range. However, by applying in the nM range.
However,
AuNPs by applying
additionally, AuNPs
a clear shiftadditionally, a clear shiftwas
in the SPR wavelength in the SPR wavelength
observed. The obtained wasSPR
observed.
spectraThefor
obtained SPR spectra for different CRP concentrations and for water (without
different CRP concentrations and for water (without incubation with CRP and AuNPs as reference) incubation with CRP are
and AuNPs
illustrated inas reference)
Figure 4a. are illustrated in Figure 4a.
(a) (b)
Figure 4.
Figure 4. Transmission
Transmission spectra
spectra (a)
(a) and
and SPR
SPR wavelength
wavelength shift
shift (b)
(b) for
for different
different CRP
CRP concentrations
concentrations in
in
combination
combination with
with the
the applied
applied AuNP
AuNP sandwich
sandwich assay.
assay.
According
Accordingtotothethe results shown
results in Figure
shown 4a, the SPR
in Figure wavelength
4a, the shifts towards
SPR wavelength higher
shifts wavelengths
towards higher
with increasing
wavelengths CRP
with concentration
increasing and, thus, forand,
CRP concentration higher amounts
thus, of bound
for higher amountsAuNPs.
of boundTheAuNPs.
shift of The
the
SPR wavelength towards higher wavelengths with increasing amounts of AuNPs
shift of the SPR wavelength towards higher wavelengths with increasing amounts of AuNPs above above the sensor
surface is consistent
the sensor surface iswith other SPR
consistent withsensor
othersystems basedsystems
SPR sensor on AuNP sandwich
based assays
on AuNP reported assays
sandwich in the
literature
reported in [44]
thedue to electromagnetic
literature field coupling between
[44] due to electromagnetic SPR and
field coupling localized
between SPRSPR
and (LSPR)
localizedof SPR
the
(LSPR) of the AuNPs [45]. With the enhanced sensor configuration, a sensitivity of 0.118 nm/nM
(linear approximation with R2 = 0.95) for the detection of CRP in buffer solution could be obtained
(Figure 4b). As depicted in Figure 4b, for each CRP concentration, a new sensor channel was applied,
and for the determination of the SPR wavelength shift, a mean value was calculated over nineSensors 2020, 20, 2889 8 of 11
AuNPs [45]. With the enhanced sensor configuration, a sensitivity of 0.118 nm/nM (linear approximation
with R2 = 0.95) for the detection of CRP in buffer solution could be obtained (Figure 4b). As depicted in
Figure 4b, for each CRP concentration, a new sensor channel was applied, and for the determination of
the SPR wavelength shift, a mean value was calculated over nine measurements. In addition, in order to
determine the LOD of the CRP detection, the standard deviations were calculated for all measurements
and values of 0.49 nm (0 nM), 0.62 nm (25 nM), 0.42 nm (50 nM) as well as 0.81 nm (100 nM) were
obtained. By taking the standard deviation for 0 nM CRP and the obtained sensitivity, a LOD for
the detection of CRP of 12.46 nM was calculated. For samples with 0 nM CRP and spiked with 10%
CRP-free human serum, a non-specific binding induced SPR wavelength shift of 6.13 nm was measured.
5. Discussion
Our evaluation verifies that the proposed planar-optical SPR sensor design has a linear sensitivity
of 608.6 nm/RIU to applied RI changes of the surrounding and a LOD of 4.3 × 10⁻³ RIU in its basic
configuration. The relatively moderate measurement resolution to applied RI changes achieved can
mainly be explained by the modal noise of the MM optical waveguide structure. Since optical glass
fibers were applied for the purpose of coupling light in and out of the waveguide, their positions relative
to the planar-optical waveguide structure are sensitive to external perturbations, i.e., temperature
variations or vibrations. Therefore, spatial variations of the fiber-to-waveguide position cause different
mode excitations of the planar-optical waveguide structure, which results in variations in the detected
SPR wavelength (minimum position of the measured intensity transmission spectrum). However,
despite this fact, the detection capability of the target biomarker CRP in the lower nM range could be
demonstrated by extending the sensor configuration with a AuNP-enhanced aptamer-based sandwich
assay, and thus, CRP concentrations lower than 25 nM (the lowest concentration used in this study)
can be reliably detected with a LOD of 12.46 nM. The normal CRP concentration in human serum is
40 nM, and CRP concentration increases above 666 nM (840 mg/L) in the case of inflammation and
infection [46]. The sensitivity of the developed sensor is thus well-suited for the detection of CRP
within the physiologically relevant concentration range and, in particular, to distinguish between
normal and increased CRP levels.
6. Conclusions
A SPR biosensor based on a planar-optical MM polymer waveguide for the detection of
biomolecules in the lower nM range was successfully developed. Through the novel combination of
the planar-optical SPR sensor with an aptamer-based and AuNP-enhanced sandwich assay, detection
of a model biomarker, i.e., C-reactive protein (CRP), was demonstrated. While CRP was only used as
a model analyte and neither the surface functionalization nor the assay procedure were optimized,
a sensitivity of 0.118 nm/nM and a limit of detection of 12.46 nM were achieved, which would not have
been possible with the basic sensor concept, i.e., without the NP-assisted signal enhancement concept
developed in this work. Furthermore, depending on the functionalization of the gold surface of the
SPR sensor, the detection of various other biomarkers appears feasible in the next step. Therefore,
by multiplexing several SPR sensors in parallel with different surface functionalization, multiple
biomarker detection is possible within a relatively small spatial area and requiring only a small sample
volume. Furthermore, the MM optical waveguide structure was fabricated using hot embossing
and doctor blading, and thus, the fabrication of a whole planar-optical SPR biosensor system can be
transferred to a cost-efficient and potentially reel-to-reel fabrication process with high throughput.
Moreover, the design demonstrated the potential for implementing cost-efficient coupling of light with
the all-optical sensor chip, which is important for the reduction of the overall interrogation cost of
the sensing scheme. In the present study, we have used a white light LED and a spectrometer for
interrogation and readout to demonstrate the functionality of the developed sensor system. Since no
sophisticated optical instruments are needed, the sensor can also be used in combination with a mobile
device, where the LED and the camera of a smartphone, for instance, can be employed for interrogation,Sensors 2020, 20, 2889 9 of 11
as had been demonstrated before for a fiber optic SPR sensor [25]. This will reduce costs of the needed
devices dramatically in comparison to conventional SPR spectrometers and will allow the application
of SPR outside laboratory environment and within low-resource settings.
In summary, the novel biosensor incorporating MM polymer waveguides demonstrates strengths
in its adaptability for multi-biomarker sensing on a single microfluidic chip, cost effectiveness, i.e., not
only in the fabrication but also in its requirement of minimal sample volumes, and its higher tuning of
the detection scheme. It can be concluded that it is well-suited and, most importantly, has the potential
for low-cost disposable lab-on-a-chip applications which might be of particular interest in low-resource
settings. Current research focuses on the sensor system to be incorporated into a smartphone and the
optimization of the assay for the detection of biomarkers in complex samples as well as optimization
of the sensitivity by tailoring the interaction between the SPR and LSPR of the AuNPs.
Author Contributions: Conceptualization, K.B. and J.-G.W.; software, K.B.; investigation, K.B., J.-G.W., L.S.M.A.
and A.E.; writing—original draft preparation, K.B. and L.S.M.A.; writing—review and editing, J.-G.W., L.S.M.A.
and B.W.R.; visualization, K.B.; supervision, B.W.R.; project administration, K.B.; funding acquisition, K.B. and
J.-G.W. All authors have read and agreed to the published version of the manuscript.
Funding: B.W.R. acknowledges funding from the Deutsche Forschungsgemeinschaft (DFG, German Research
Foundation) under Germany’s Excellence Strategy within the Cluster of Excellence PhoenixD (EXC 2122, Project
ID 390833453). J.-G.W. and K.B. acknowledge support from the Bundesministerium für Wirtschaft und Energie
(BMWi) as well as the European Social Fund (ESF) within Grant Number 03EFHNI059. The publication of this
article was funded by the Open Access Fund of Leibniz Universität Hannover.
Conflicts of Interest: The authors declare no conflicts of interest.
References
1. Sawyers, C. The cancer biomarker problem. Nature 2008, 452, 548–552. [CrossRef] [PubMed]
2. Nimse, S.; Sonawane, M.; Song, K.; Kim, T. Biomarker detection technologies and future directions. Analyst
2016, 141, 740–755. [CrossRef] [PubMed]
3. Pirzada, M.; Altintas, Z. Recent Progress in Optical Sensors for Biomedical Diagnostics. Micromachines 2020,
11, 356. [CrossRef] [PubMed]
4. Liu, J.; Jalali, M.; Mahshid, S.; Wachsmann-Hogiu, S. Are plasmonic optical biosensors ready for use in
point-of-need applications? Analyst 2020, 145, 364–384. [CrossRef] [PubMed]
5. Narayan, T.; Kumar, S.; Kumar, S.; Augustine, S.; Yadav, B.K.; Malhotra, B.D. Protein functionalised
self-assembled monolayer based biosensor for colon cancer detection. Talanta 2019, 201, 465–473. [CrossRef]
6. Liu, X.; Lin, W.; Xiao, P.; Yang, M.; Sun, L.-P.; Zhang, Y.; Xue, W.; Guan, B.-O. Polydopamine-based
molecular imprinted optic microfiber sensor enhanced by template-mediated molecular rearrangement for
ultra-sensitive C-reactive protein detection. Chem. Eng. J. 2020, 387, 124074. [CrossRef]
7. Nguyen, H.H.; Park, J.; Kang, S.; Kim, M. Surface plasmon resonance: A versatile technique for biosensor
applications. Sensors 2015, 15, 10481–10510. [CrossRef]
8. Bhardwaj, H.; Sumana, G.; Marquette, C.A. A label-free ultrasensitive microfluidic surface Plasmon resonance
biosensor for Aflatoxin B1 detection using nanoparticles integrated gold chip. Food Chem. 2020, 307, 125530.
[CrossRef]
9. Schasfoort, R.B.M. Future Trends in SPR Technology. In Handbook of Surface Plasmon Resonance, 2nd ed.;
The Royal Society of Chemistry: London, UK, 2017.
10. Homola, J. Present and future of surface plasmon resonance biosensors. Anal. Bioanal. Chem. 2003, 377,
528–539. [CrossRef]
11. Homola, J.; Vaisocherová, H.; Dostálek, J.; Piliarik, M. Multi-analyte surface plasmon resonance biosensing.
Methods 2005, 37, 26–36. [CrossRef]
12. Boozer, C.; Kim, G.; Cong, S.X.; Guan, H.W.; Londergan, T. Looking towards label-free biomolecular
interaction analysis in a high-throughput format: A review of new surface plasmon resonance technologies.
Curr. Opin. Biotechnol. 2006, 17, 400–405. [CrossRef] [PubMed]
13. Estevez, M.; Otte, M.A.; Sepulveda, B.; Lechuga, L.M. Trends and challenges of refractometric nanoplasmonic
biosensors: A review. Anal. Chim. Acta 2014, 806, 55–73. [CrossRef] [PubMed]Sensors 2020, 20, 2889 10 of 11
14. Piliarik, M.; Vaisocherová, H.; Homola, J. Surface Plasmon Resonance Biosensing. In Biosensors and Biodetection;
Rasooly, A., Herold, K.E., Eds.; Methods in Molecular Biology™; Humana Press: Totowa, NJ, USA, 2009;
Volume 503.
15. Srivastava, T.; Jha, R.; Das, R. High-Performance Bimetallic SPR Sensor Based on
Periodic-Multilayer-Waveguides. IEEE Photon. Technol. Lett. 2011, 23, 1448–1450. [CrossRef]
16. Wang, Q.; Wang, B. Sensitivity enhanced SPR immunosensor based on graphene oxide and SPA co-modified
photonic crystal fiber. Opt. Laser Technol. 2018, 107, 210–215. [CrossRef]
17. Wang, X.; Wolfbeis, O.S. Fiber-Optic Chemical Sensors and Biosensors (2013–2015). Anal. Chem. 2016, 88,
203–227. [CrossRef]
18. Wang, X.; Wolfbeis, O.S. Fiber-Optic Chemical Sensors and Biosensors (2015–2019). Anal. Chem. 2020, 92,
397–430. [CrossRef]
19. Wei, Y.; Liu, C.; Zhang, Y.; Luo, Y.; Nie, X.; Liu, Z.; Zhang, Y.; Peng, F.; Zhou, Z. Multi-channel SPR sensor
based on the cascade application of the Single-mode and multimode optical fiber. Opt. Commun. 2017, 390,
82–87. [CrossRef]
20. Kozma, P.; Kehl, F.; Ehrentreich-Förster, E.; Stamm, C.; Bier, F.F. Integrated planar optical waveguide
interferometer biosensors: A comparative review. Biosens. Bioelectron. 2014, 58, 287–307. [CrossRef]
21. Cennamo, N.; Zeni, L. Polymer Optical Fibers for Sensing. Macromol. Symp. 2020, 389, 1900074. [CrossRef]
22. Matsushita, T.; Nishikawa, T.; Yamashita, H.; Kishimoto, J.; Okuno, Y. Development of new single-mode
waveguide surface plasmon resonance sensor using a polymer imprint process for high-throughput
fabrication and improved design flexibility. Sens. Actuators B Chem. 2008, 129, 881–887. [CrossRef]
23. Mishra, K.S.; Zou, B.; Chiang, K.S. Surface-Plasmon-Resonance Refractive-Index Sensor with Cu-Coated
Polymer Waveguide. IEEE Photon. Technol. Lett. 2016, 28, 1835–1838. [CrossRef]
24. Zeni, L.; Pesavento, M.; Marchetti, S.; Cennamo, N. [INVITED] Slab plasmonic platforms combined with
Plastic Optical Fibers and Molecularly Imprinted Polymers for chemical sensing. Opt. Laser Technol. 2018,
107, 484–490. [CrossRef]
25. Bremer, K.; Roth, B. Fibre optic surface plasmon resonance sensor system designed for smartphones.
Opt. Express. 2015, 23, 17179–17184. [CrossRef]
26. Hastings, J.T. Optimizing surface-plasmon resonance sensors for limit of detection based on a Cramer-Rao
bound. IEEE Sens. J. 2008, 8, 170–175. [CrossRef]
27. Caucheteur, C.; Guo, T.; Albert, J. Review of plasmonic fiber optic biochemical sensors: Improving the limit
of detection. Anal. Bioanal. Chem. 2015, 407, 3883–3897. [CrossRef] [PubMed]
28. Zhan, S.; Lou, X.; Zhou, P.; Xia, F. Sandwich Assays Based on SPR, SERS, GMR, QCM, Microcantilever, SAW,
and RRS Techniques for Protein Detection. In Biosensors Based on Sandwich Assays; Xia, F., Zhang, X., Lou, X.,
Yuan, Q., Eds.; Springer: Singapore, 2018.
29. Liu, C.; Xue, N.; Cai, H.; Sun, J.; Qi, Z.; Zhao, P.; Xiong, F.; Geng, Z.; Jiang, L.; Li, L. Nanoparticles Enhanced
Self-driven Microfludic Biosensor. Micromachines 2020, 11, 350. [CrossRef] [PubMed]
30. Li, R.; Feng, F.; Chen, Z.Z.; Bai, Y.F.; Guo, F.F.; Wu, F.Y.; Zhou, G. Sensitive detection of carcinoembryonic
antigen using surface plasmon resonance biosensor with gold nanoparticles signal amplification. Talanta
2015, 140, 143–149. [CrossRef]
31. Kim, S.; Lee, J.; Lee, S.J.; Lee, H.J. Ultra-sensitive detection of IgE using biofunctionalized
nanoparticle-enhanced SPR. Talanta 2010, 81, 1755–1759. [CrossRef]
32. Clyne, B.; Olshaker, J.S. The C-reactive protein. J. Emerg. Med. 1999, 17, 1019–1025. [CrossRef]
33. Wang, W.; Mai, Z.; Chen, Y.; Wang, J.; Li, L.; Su, Q.; Li, X.; Hong, X. A label-free fiber optic SPR biosensor for
specific detection of C-reactive protein. Sci. Rep. 2017, 7, 16904. [CrossRef]
34. Aray, A.; Chiavaioli, F.; Arjmand, M.; Trono, C.; Tombelli, S.; Giannetti, A.; Cennamo, N.; Soltanolkotabi, M.;
Zeni, L.; Baldini, F. SPR-based plastic optical fibre biosensor for the detection of C-reactive protein in serum.
J. Biophoton. 2016, 9, 1077–1084. [CrossRef] [PubMed]
35. Kaiser, L.; Weisser, J.; Kohl, M.; Deigner, H. Small molecule detection with aptamer based lateral flow assays:
Applying aptamer-C-reactive protein cross-recognition for ampicillin detection. Sci. Rep. 2018, 8, 5628.
[CrossRef] [PubMed]
36. Bini, A.; Centi, S.; Tombelli, S.; Mascini, M. Development of an optical RNA-based aptasensor for C-reactive
protein. Anal. Bioanal. Chem. 2008, 390, 1077–1086. [CrossRef] [PubMed]Sensors 2020, 20, 2889 11 of 11
37. Johnson, A.; Song, O.; Ferrigno, P.K.; Bueno, P.R.; Davis, J.J. Sensitive Affimer and Antibody Based
Impedimetric Label-Free Assays for C-Reactive Protein. Anal. Chem. 2012, 84, 6553–6560. [CrossRef]
38. Rezem, M.; Günther, A.; Roth, B.; Reithmeier, E.; Rahlves, M. Low-Cost Fabrication of All-Polymer
Components for Integrated Photonics. J. Lightwave Technol. 2017, 35, 299–308. [CrossRef]
39. Rahlves, M.; Günther, A.; Rezem, M.; Roth, B. Polymer-based transmission path for communication and
sensing applications. J. Lightwave Technol. 2018, 37, 729–735. [CrossRef]
40. Huang, C.-J.; Lin, H.I.; Shiesh, S.C.; Lee, G.B. Integrated microfluidic system for rapid screening of CRP
aptamers utilizingsystematic evolution of ligands by exponential enrichment (SELEX). Biosens. Bioelectron.
2010, 25, 1761–1766. [CrossRef]
41. Bastus, N.G.; Comenge, J.; Puntes, V. Kinetically Controlled Seeded Growth Synthesis of Citrate-Stabilized
Gold Nanoparticles of up to 200 nm: Size Focusing versus Ostwald Ripening. Langmuir 2011, 27, 11098–11105.
[CrossRef]
42. Bremer, K.; Alwis, L.S.M.; Zheng, Y.; Roth, B. Towards mode-multiplexed fiber sensors: An investigation on
the spectral response of etched graded index OM4 multi-mode fiber with Bragg grating for refractive index
and temperature measurement. Appl. Sci. 2020, 10, 337. [CrossRef]
43. Suzuki, A.; Kondoh, J.; Matsui, Y.; Shiokawa, S.; Suzuki, K. Development of novel optical waveguide surface
plasmon resonance (SPR) sensor with dual light emitting diodes. Sens. Actuators B Chem. 2005, 106, 383–398.
[CrossRef]
44. Špringer, T.; Homola, J. Biofunctionalized gold nanoparticles for SPR-biosensor-based detection of CEA in
blood plasma. Anal. Bioanal. Chem. 2012, 404, 2869–2875. [CrossRef] [PubMed]
45. Hong, Y.; Hall, E.A.H. Contribution of gold nanoparticles to the signal amplification in surface plasmon
resonance. Analyst 2012, 137, 4712. [CrossRef] [PubMed]
46. Haran, J.P.; Beaudoin, F.L.; Suner, S.; Lu, S. C-reactive protein as predictor of bacterial infection among
patients with an influenza-like illness. Am. J. Emerg. Med. 2013, 31, 137–144. [CrossRef] [PubMed]
© 2020 by the authors. Licensee MDPI, Basel, Switzerland. This article is an open access
article distributed under the terms and conditions of the Creative Commons Attribution
(CC BY) license (http://creativecommons.org/licenses/by/4.0/).You can also read