Financial implications of mobile phone-based personal carbon trading: a case study of Safaricom
←
→
Page content transcription
If your browser does not render page correctly, please read the page content below
PAPER • OPEN ACCESS

Financial implications of mobile phone-based personal carbon trading: a
case study of Safaricom
To cite this article: Fahd Mohamed Omar Al-Guthmy and Wanglin Yan 2021 Environ. Res.: Infrastruct. Sustain. 1 015002

View the article online for updates and enhancements.

                              This content was downloaded from IP address 46.4.80.155 on 10/10/2021 at 22:16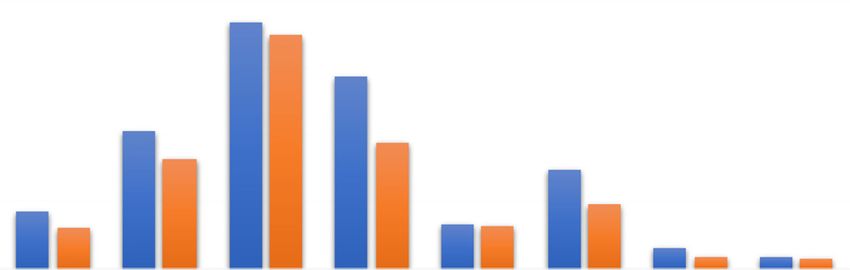
Environ. Res.: Infrastruct. Sustain. 1 (2021) 015002                                     https://doi.org/10.1088/2634-4505/ac0350

                                 PAPER

                                 Financial implications of mobile phone-based personal carbon
O P E N AC C E S S
                                 trading: a case study of Safaricom
R E C E IVE D
20 November 2020
                                 Fahd Mohamed Omar Al-Guthmy1 , ∗                   and Wanglin Yan2
R E VISE D
19 April 2021
                                 1
                                     Graduate School of Media and Governance, Keio University (SFC), ⫧252-0882, Endo 5322, Fujisawa-shi, Kanagawa, Japan
                                 2
                                     Department of Environment and Information Studies, Keio University (SFC), ⫧252-0882, Endo 5322, Fujisawa-shi, Kanagawa, Japan
AC C E PTE D FOR PUBL IC ATION   ∗
                                     Author to whom any correspondence should be addressed.
20 May 2021
                                 E-mail: falguthmy@keio.jp
PUBL ISHE D
1 July 2021
                                 Keywords: personal carbon trading, energy policy, emissions, road transport

Original content from
this work may be used
under the terms of the           Abstract
Creative Commons
Attribution 4.0 licence.         Personal carbon trading (PCT) has garnered significant interest in the literature as an alternative
Any further distribution         policy instrument to the largely unpopular carbon tax. However, it has been hindered by the cost
of this work must                and administrative complexity concerns as a result of covering potentially millions of emitters. This
maintain attribution to
the author(s) and the            work expands on a prior study which presented a mobile phone-based PCT scheme for personal
title of the work, journal
citation and DOI.                road transport in Kenya. In that study, the system design and operation was extensively developed,
                                 and distributional impact was assessed using sample data of motorists to identify equity issues. In
                                 this extension, I justify the scheme further by assessing the cost concerns using a case study
                                 approach of the mobile service provider, Safaricom. Data from the sample survey is revisited and
                                 combined with Safaricom’s financial reports to simulate the potential cost of the scheme. Results
                                 revealed running costs of less than £80 000 annually, several times lower than estimates that relied
                                 on the chip card system. Policymakers and researchers are encouraged to build on this scheme’s
                                 viability as a globally-inclusive variant of PCT.

                                 1. Introduction

                                 Climate change as a result of anthropogenic causes has resulted in the development of several policy instru-
                                 ments in order to mitigate rapidly increasing emissions. The most common are market mechanisms such as
                                 carbon taxes (pricing instruments) and emission trading systems (quantity instruments). Personal carbon
                                 trading (PCT) is a broad type of a downstream emissions trading system, first developed in the UK, whereby
                                 either household or both household and transport-related emissions are capped and distributed as emissions
                                 allowances (Fawcett and Parag 2010). There are various types of PCT schemes that have been developed exten-
                                 sively to justify the importance of downstream participation of emissions trading (see Ayres 1997, Hillman and
                                 Fawcett 2004, Raux and Marlot 2005, Starkey and Anderson 2005, Raux 2010, Starkey 2011, Raux et al 2015).
                                     While emissions trading systems currently in operation involve the participation of a few stationary emitters
                                 in the form of industries, PCT involves potentially millions of individuals. Hence, its implementation and
                                 operation would benefit from minimizing cost and administrative complexities. Prior works have suggested
                                 that as a result of today’s technological possibilities, operationalizing PCT can be cost-efficient if a smart design
                                 leveraging existing technologies is used to manage the large number of participants (Raux 2010).
                                     However, PCT is yet to benefit from a practical, evidence-based argument to support both its adminis-
                                 trative complexities and high running costs which has made its implementation elusive. Previous proposals
                                 have perceived certain designs to be feasible such as using chip card technology, but these studies lack realistic,
                                 evidence-based cost estimations in order to be considered by policymakers for actual implementation. For the
                                 works that have loosely estimated running costs, they also suffer from the myopia of only developed country
                                 consideration, leaving behind the possibility of a globally implementable policy option. Therefore, a simple,
                                 cost-efficient system needs to be empirically justified.
                                     This work expands on a prior study by Al-Guthmy and Yan (2020) which presented a popular mobile money
                                 transfer platform called M-Pesa as a potential solution for PCT implementation in Kenya. In this extension,

                                 © 2021 The Author(s). Published by IOP Publishing Ltd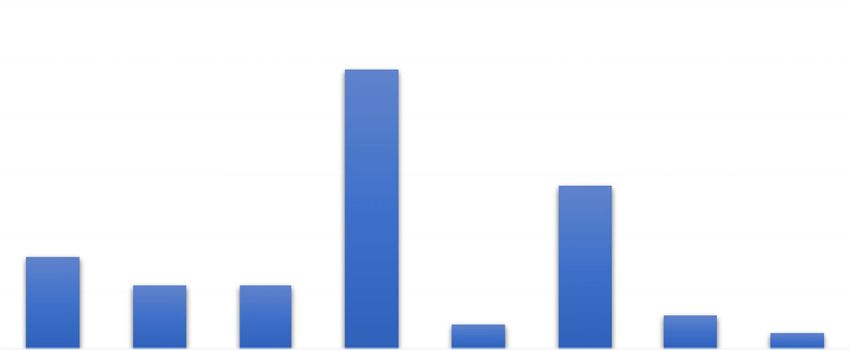
Environ. Res.: Infrastruct. Sustain. 1 (2021) 015002                                      F M O Al-Guthmy and W Yan

the argument for that scheme is further developed by establishing the financial implications using a case study
approach of the mobile service provider, Safaricom.

2. Literature review

2.1. Conventional approach and limitations: chip card technology
Since the mid 90s when Fleming (Fleming 1997) introduced tradable domestic quotas (DTQs), there has been
a culmination of academic and political research into designs motivated by the proponents of urgent climate
change mitigation. In the literature, the enabling infrastructure of PCT has traditionally focused on using the
chip card system for whole economies (Starkey and Anderson 2005, DEFRA 2008, Burgess 2016), household
energy (Niemeier et al 2008) and road transport (Fleming 1997, Raux and Marlot 2005, Harwatt 2008, Raux
2010, Harwatt et al 2011, Rothengatter et al 2011). From the various proposals, two key works attempted to
estimate the cost of PCT implementation: DEFRA’s domestic tradable quota (DTQ)-inspired PCT (Lane et al
2008) and tradable carbon permits (TCPs) by Harwatt et al (2011).
    For DTQ, the UK government commissioned several prefeasibility studies, one of which was the technical
feasibility and potential cost (Lane et al 2008) based on the chip card system and concluded that it was not
the right time for implementation. The costs and administrative complexities were deemed too high to be
acceptable at the time (DEFRA 2008). The report used simple inhouse estimates of the setup and running
costs by the consultants and lacks financial implications for participating individuals. As a result, it strongly
recommended more research into alternative ways to implement PCT to address the issues raised. The high
costs and system complexities of a card-based system are evident from two main flaws:

2.1.1. Additional hardware
For road transport proposals, the motorist must obtain and carry a chip card to use at a fuel retail station in
order to purchase fuel and update their quota balance. This requires every retailer to either have either a card
terminal or modify existing chip card systems at the premises (if any) to accommodate the scheme. The system
would connect to a dedicated server and run specialized software to manage the quota accounts. The findings
from the DEFRA report concluded this not be feasible.

2.1.2. Unnecessary involvement of intermediaries
The trading of quotas by participants using the chip card system would need to be done through intermediaries.
Harwatt et al (2011) state that the information technology available during that period was adequately sophis-
ticated to establish and manage a national chip card system that could be used at post offices, fuel stations and
even online. Other works suggest that even though there are cheaper alternative instruments, the costs of the
chip card-based PCT scheme are justified by the benefits of equity, acceptability and overall efficiency (Starkey
and Anderson 2005). However, they add an unnecessary layer of involvement and by default, administrative
complexities and overheads. Furthermore, the private sector involvement would require significantly more
compliance and regulatory checks to ensure the system is not compromised by fraudulent activities, placing a
significant burden on the regulator.

2.2. Research approach: cost-estimation of a mobile phone-based PCT
This research uses the Safaricom-based PCT system proposed by Al-Guthmy and Yan (2020) to provide evi-
dence of cost feasibility for implementation in personal road transport. In that paper, the system design and
operation was extensively developed, and distributional impact was assessed using sample data of 500 motorists
across different regions to identify equity issues. The platform operates using the unstructured supplementary
service data feature of basic mobile phones, hence even those without smart phones are able to participate.
    Motorists would be allocated carbon credits through their mobile phones by the regulator and would be
required to surrender the appropriate number of credits to the pump attendant when refuelling. Users would be
able to access the trading platform on their phones to buy or sell carbon credits by placing bids or offers, similar
to stock trading in a centralized marketplace. All motorists are able to participate due to the interoperability
of mobile networks and those without their phones may be able to access their account securely at a retail
fuel station using their login credentials. The distributional impact assessment of the motorists revealed the
PCT system to be significantly progressive under different scenarios. The integration into an existing mobile
platform and elimination of unnecessary intermediaries would reduce the potential costs although the authors
did not provide evidence of the cost-savings.
    In this expansion, Safaricom’s annual financial reports and performance statistics are analyzed and com-
bined with sample survey data to provide potential running costs of operating PCT using the same infrastruc-
ture. The analysis is conducted using Monte Carlo simulation which approximates the number of transactions

                                                       2
Environ. Res.: Infrastruct. Sustain. 1 (2021) 015002 F M O Al-Guthmy and W Yan
Figure 1. Flow chart of revenue and cost estimation method of an M-Pesa-based PCT system.
Table 1. Financial data extracted from Safaricom’s annual financial reports.a
Line item Description
No. of active M-Pesa The reports provide 30 days active customers, so this is scaled to annual level
customers to match the rest of the data
M-Pesa revenues These are provided in the annual reports
Direct cost Commissions paid to agents who exchange efloat and cash
Operating cost (including capital expenditure) Only overall values are provided, so
it was
necessary to derive an estimate for
M-Pesa alone as shown: MOC = MRG TRG
× TOC (1)
Where:
MOC is the estimated M-Pesa operating cost;
MRG is the average M-Pesa revenue growth (2014–19);
TRG is the average total revenue growth (2014–19) and;
TOC is the average total operating cost (2014–19)
a
Safaricom Limited (2014, 2015, 2016, 2017, 2018, 2019).
that could be made which are then combined with the estimated running costs and projected to a national
scale.
3. Method
Using publicly available financial statements from Safaricom, and sector statistics of mobile service providers
from the Communications Authority of Kenya (CAK), the per-transaction costs and revenues of operating
M-Pesa are derived.
The sample data used by Al-Guthmy and Yan (2020) contains the list of motorists with fuel quota deficits
under 3 allocation methods: the equal per-vehicle allocation (EpVA), equal per-capita allocation (EpCA) and
3Environ. Res.: Infrastruct. Sustain. 1 (2021) 015002 F M O Al-Guthmy and W Yan
Table 2. Frequencies of sample and population of motorists in deficit.a
EpVA EpCA NbA
No. of motorists (sample) 236 263 274
No. of motorists (population) 474 124 528 367 550 466
Proportion of total 47.20% 52.60% 54.80%
a
Adapted from Al-Guthmy and Yan (2020) whereby the sample consisted of 500 motorists
taken from a population of 1 004 500 motor vehicles.
Table 3. Total M-Pesa transactions.a
Quarter 2015/16 2016/17 2017/18 2018/19
4 299 711 802b 476 504 481 653 297 160 1000 253 350
1 295 622 200b 509 843 840 724 065 480 1005 850 634
2 369 630 964 578 879 284 865 125 963 1093 717 759
3 435 294 630 609 202 425 925 531 923 1095 723 093
Total 1400 259 596 2174 430 030 3168 020 526 4195 544 836
a
Aggregated from: Communications Authority of Kenya (, , , ).
b
Unavailable and estimated by extrapolating backwards the quarter’s values
from subsequent years.
Figure 2. Active M-Pesa customers in millions.
needs-based allocation (NbA) methods. Assuming each purchase of quotas has a fixed fee, we must predict
how often each motorist purchases quotas to clear their deficit. 95% of the quota deficits under all alloca-
tion methods range between 208 and 345 L of fuel quotas. Using the Monte Carlo method, random trials are
performed using a discrete uniform distribution of 5 outcomes of quota purchases of each motorist’s deficit
until the deficit is depleted. These are 20%, 40%, 60%, 80% and 100% of quota deficits. Figure 1 contains a
flow chart which illustrates the procedures undertaken and performed using Microsoft Excel. The method was
performed in 11 steps which are divided into three outputs defined below.
3.1. Estimating the per-transaction cost and revenue of M-Pesa
(Step 1) From Safaricom’s annual financial reports, extract the line items of interest as shown in table 1 below.
Then calculate the average growth of each line item by subtracting the previous year’s value in order
to identify the effect.
(Step 2) Next we to divide revenues and cost by M-Pesa customers to obtain the per-customer statistics for
4Environ. Res.: Infrastruct. Sustain. 1 (2021) 015002 F M O Al-Guthmy and W Yan
Figure 3. Safaricom’s financial performance adapted from Safaricom Limited (Multiple: 2014, 2015, 2016, 2017, 2018, 2019).
Currency converted from Kenya shillings (Ksh) to pound sterling at the 2019 average exchange rate of Ksh. 130.18 per pound
sterling (Kenya National Bureau of Statistics 2020).
Figure 4. Average growth of revenues and costs. M-Pesa has the highest growth rate. Note the effect of revenue growth on
operating cost growth. Adapted from Safaricom Limited (2014, 2015, 2016, 2017, 2018, 2019).
each period. Note that the M-Pesa cost is the sum of the direct and operating costs.
MR
RC = (2)
NC
MC
CC = (3)
NC
where: RC is the M-Pesa revenue per customer; CC is the M-Pesa cost per customer; MR is the M-Pesa
revenue; and MC is the M-Pesa cost; and NC is the number of M-Pesa customers.
(Step 3) From the CAK sector statistics reports (Communications Authority of Kenya 2015-2019a,
2015-2019b, 2016-2019a, 2016-2019b), obtain the total number of M-Pesa transactions for each year
by adding the number of person-to-person (P2P) and withdrawal transactions to the number of
e-commerce transactions, given by:
TT = (P2P + W) + EC (4)
where: TT is the total number of transactions; P2P is the number of person-to-person transactions;
W is the number of withdrawal transactions; and EC is the number of ecommerce transactions.
5Environ. Res.: Infrastruct. Sustain. 1 (2021) 015002 F M O Al-Guthmy and W Yan
Figure 5. Financial indicators of M-Pesa on a per-customer basis (average of 2015–19).
Figure 6. Average number of M-Pesa transactions per customer per year. Note the year-on-year increase attributed to more
payment options using M-Pesa such as fuel purchase, shopping and paying utility bills in addition to P2P and withdrawal
transactions.
(Step 4) To obtain the revenue and cost per transaction, the per-customer M-Pesa revenue and cost (obtained
in step 2) are divided by the number of transactions per customer (obtained in step 3) for each year.
The average of the period 2015 to 2019 is used as the estimated revenue and cost per transaction.
RC
RT = (5)
TT
CC
CT = (6)
TT
where: RT is the M-Pesa revenue per transaction; and CT is the cost per transaction.
(Step 5) The above revenue includes taxes. For PCT, we expect taxes to be excluded. Hence excise tax of 12%
payable on sales and corporate tax of 30% payable on earnings before tax are deducted from the
revenue to give discounted price (revenue) for PCT.
Tax = Etax + Ctax (7)
PRT = RT − Tax (8)
6Environ. Res.: Infrastruct. Sustain. 1 (2021) 015002 F M O Al-Guthmy and W Yan
Figure 7. Financial indicators of M-Pesa on a per-transaction basis (average of 2015–19).
where: Tax is the total tax per transaction; Etax is the excise tax component per transaction; Ctax is
the corporate tax component per transaction; and PRT is the revenue per transaction expected under
a PCT scheme.
3.2. Simulating the number of transactions using Monte Carlo method
(Step 6) Extract the number of motorists with quota deficits under each allocation method from the sample
survey data. The number of motorists in deficits and their proportions to the sample are provided in
table 2.
(Step 7) Choose random numbers against the discrete uniform distribution to select the percentage of each
motorist’s deficit balance reduced for each transaction until depletion of the deficit. The discrete
choices are 20%, 40%, 60%, 80% and 100% reduced. This means motorists reduce their quota deficits
by these percentages which results in between one to five possible transactions depending on each
random outcome.
(Step 8) Sum up each motorists’ transactions and repeat this process for 1000 trials per allocation method.
(Step 9) The mean value of all trials results in the approximate number of transactions under each allocation
method for a given year of running the PCT scheme.
3.3. Applying M-Pesa revenue and cost estimates to the simulated transactions
(Step 10) The number of transactions under each allocation method are multiplied by the PCT revenue per
transaction and the M-Pesa cost per transaction. The difference between the two values provides
the tax-free earnings for each of the 3 allocation methods.
(Step 11) The sample results are translated into population estimates by the multiplication factor of the
population.
MP
MF = (9)
MS
PR = SR × MF (10)
PC = SC × MF (11)
where: MF is the multiplication factor; MP is the number of motorists in the population; MS is the
number of motorists from the sample; PR is the population revenue; SR is the sample revenue; PC
is the population cost; and SC is the sample cost.
7Environ. Res.: Infrastruct. Sustain. 1 (2021) 015002 F M O Al-Guthmy and W Yan
Table 4. Monte Carlo simulation summary statistics for each allocation method.
Population results EpVA EpCA NbA
Minimum no. of transactions 466 944 525 312 538 624
Transactions: 5th percentile 481 280 538 624 561 152
Average no. of transactions 501 034 559 134 581 729
Transactions: 95th percentile 520 192 579 584 603 136
Maximum no. of transactions 536 576 591 872 636 928
Figure 8. Estimated annual revenues, costs and earnings for M-Pesa-based PCT scheme for personal road transport in Kenya.
Running costs do not exceed £80 000.
4. Presentation of results
4.1. Data summary
The Communications Authority of Kenya (CAK) publishes quarterly sector statistics of the mobile carriers
which includes Safaricom. Its financial year runs from April to March each year, and its performance is reported
in the CAK’s reports in the order quarter 4, 1, 2 and 3. Table 3 shows the total M-Pesa-related transactions
which is the sum of the P2P, withdrawal and e-commerce transactions for each financial year.
M-Pesa has seen consistent year-on-year growth in active number of customers as shown in figure 2. The
2019 financial performance shown in figure 3 depicts higher values than the 6 years average between 2014 to
2019 reflecting the consistent growth of the service.
According to the firm’s financial statements, the direct costs associated with M-Pesa are commissions which
are paid to the agents across the country. Customers must visit them to deposit efloat (with cash) or withdraw
cash (with efloat). The other cost shown in figure 3 is the operating cost which is not only for M-Pesa, but for
all Safaricom’s services. Of all the revenue streams, voice is the largest and is followed by M-Pesa.
Figure 4 depicts how M-Pesa has had the highest average revenue growth at 48.33% compared to other
revenue streams. Operating costs increased only by 10.98%. Even though voice revenues dominate all other
services, M-Pesa revenue growth rate is higher. At the current growth rate, M-Pesa revenues may surpass voice
revenues in less than half a decade.
The proportion of M-Pesa’s revenue growth rate (48.33%) to the overall revenue growth rate was taken
from the operating costs growth rate (10.98%) to estimate the M-Pesa operating costs. In other words, the
operating cost of M-Pesa is taken as 48.33% of the increase in operating costs. With the estimated M-Pesa oper-
ating cost, it was possible to assess the financial indicators of M-Pesa on a per-customer and per-transaction
basis.
For the average per-customer financials (figure 5), the total cost (direct and operating cost) accounts for
45% of the revenue while the net earnings after tax account for 30%. These are for the average transactions per-
formed by each customer annually. The number of transactions are shown in figure 6. The average transactions
(for ecommerce, P2P and withdrawals) per customer per year totaled 113 for the period 2014–19.
8Environ. Res.: Infrastruct. Sustain. 1 (2021) 015002 F M O Al-Guthmy and W Yan
Table 5. Comparison of DEFRA and M-Pesa PCT set-up costs.a
Country Participants Set-up cost Set-up cost
(M-Pesa PCT) (DEFRAb )
UK 50 000 000 — £941 000 000
a
Adapted from Lane et al (2008).
b
Adjusted for inflation to 2019 prices using the inflation calculator provided by
the Bank of England (2020).
4.2. PCT revenue per transaction
The per-transaction financial indicators in figure 7 show the average revenue of each M-Pesa transaction of
£0.30 including tax. The M-Pesa cost (which is also taken as the PCT cost) is £0.14 (approximately 18 US cents).
The M-Pesa revenue is lowered by excise and corporate tax to give a final per-transaction PCT price of £0.23.
4.3. Simulated number of transactions
The simulations for each of the three allocation methods resulted in several summary statistics shown in table 4.
The mean was chosen as the representative value across all allocation methods using the multiplication factor
of 512 0363 /500.
4.4. Financial implications of PCT in Kenya
Figure 8 presents the simulated national scenarios for each allocation method in terms of annual total rev-
enues generated, running costs incurred and net earnings. These figures represent the estimates for the 512 036
personally-owned motor vehicles in Kenya. Since NbA has the highest number of motorists in deficit, it has
the highest values. The opposite is true for EpVA while EpCA remains in between the two.
The results of the financial implications of PCT in Kenya have been presented by combining M-Pesa’s finan-
cial indicators and simulating the number of possible transactions by motorists. These findings are discussed
in the next section.
5. Discussion and conclusion
5.1. Discussion
5.1.1. Alleviating cost concerns
The annual running costs for the population of motor vehicles would average no more than £80 000 based on
the simulation findings which would cover the cost of running the scheme. Safaricom’s return on investment
(ROI) was found to be 65% and when added to the total transaction cost, the PCT revenue (transaction fee)
amounted to a 25% reduction in the transaction price, further making the system more affordable than the
normal M-Pesa fees as a result of PCT being tax-free. Furthermore, it ensures adoption by Safaricom as it
maintains profitability for its shareholders.
5.1.2. Comparison with DEFRA prefeasibility report
One of the DEFRA reports was a prefeasibility report on the technical feasibility and potential cost of PCT
using the chip card system in the UK (Lane et al 2008). The report suggested the set-up costs incurred by
the government and intermediaries for a PCT scheme covering the whole economy of 50 million participants
would be approximately £700 million to £2 billion4 . This excludes fixed or running costs incurred by partici-
pating individuals. After adjusting for inflation at an average of 2.7% per year to 2019 prices (Bank of England
2020), this range increases to £941 million to £2.7 billion. Table 5 shows the set-up cost from the DEFRA esti-
mate for implementing the chip-card system for intermediaries which was subsequently rejected by the UK
government.
The M-Pesa PCT set-up costs are nil as the government would simply provide Safaricom a lucrative business
opportunity with the same ROI. In return, Safaricom would bear the setup costs in order to win the tender for
this project. There would certainly be other setup costs borne by the government in designing and overseeing
the project; this is treated as a constant for any alternative policy that would be introduced. These unaccounted
costs may be minimal and could be absorbed as part of a profit-sharing agreement between the government
(which a 35% shareholder of Safaricom) and Safaricom.
3 The estimated population of personally-owned motor vehicles in Kenya (Al-Guthmy and Yan 2020).
4 The authors give a caveat that the estimates are based purely on their experience and are merely indicative.
9Environ. Res.: Infrastruct. Sustain. 1 (2021) 015002 F M O Al-Guthmy and W Yan
Table 6. Estimated financial costs of TCP.a
2006 (£ million)b 2007 (£ million)b
Lost fuel tax revenue 310.8 621.7
Operating costs 235.4 235.4
Scanning equipment 54.4 —
Information campaign 11.2 —
Public transport investment 186.9 186.9
Total costs 798.7 1044.0
a
Adapted from Harwatt et al (2011).
b
Adjusted for inflation to 2019 prices using the inflation calculator by the Bank of England
(2020).
Table 7. Comparison of TCP and M-Pesa PCT running cost implications.
Country Participants Operating cost Operating cost
(road transport) (M-Pesa PCT) (Harwatt et al TCPa )
UK 46 161 981 £7 212 302 £235 400 000
Kenya 512 036 £80 000 £2 611 094
a
Adjusted for inflation to 2019 prices using the inflation calculator provided by
the Bank of England (2020).
DEFRA’s estimate suffers from the flaws discussed in the beginning of this study. The report makes 3 key
suggestions for further investigation which have been addressed in this study, namely addressing the key cost
drivers, consultations for and better alternatives.
5.1.3. Comparison with tradable carbon permits (TCP) scheme
Harwatt et al (2011) proposed TCP for road transport in the UK and estimated the costs involved to set up
and run the scheme whereby each adult is allocated allowances. Table 6 shows the line items that were focused
on, adjusted for inflation (Bank of England 2020).
The operating costs of £2.6 million are significantly higher than this study’s estimate of £80 000 (see table 7).
This could be explained by Harwatt et al’s use of the UK vehicle licensing agency’s operating costs as the closest
estimate to running the TCP scheme and the fact that allocation is made to all adults even though the scheme
is limited to road transport.
The scanning equipment required by all fuel retailers is also an unnecessary cost that a mobile phone-based
PCT system would render unnecessary.
5.1.4. Limitations
This study also does not take into account indirect costs outside the scope of Safaricom such as the lost fuel
tax revenue. These would not be as much of a concern to policymakers as the running costs. This was left out
intentionally as it is assumed to be at least partially offset by the large import bills the country incurs annually
in relying on fuel imports and also a price the government must be willing to pay to meet its climate change
ambitions. Another limitation is that even though the comparison with the works of DEFRA and Harwatt
account for inflation, the costs of setting up a chip card system may have reduced considerably. Nonetheless,
the costs realized through M-Pesa are many times lower than these estimates and the mere fact that additional
hardware and intermediaries are required for the chip card system diminishes this concern.
5.2. Conclusion
This study furthers the case for a potential PCT system inspired by the M-Pesa mobile money transfer plat-
form. This is achieved by assessing the financial implications of the scheme for personal road transport. The
simulation exercise provided evidence of the low running costs and tax-free transactional fee for motorists
making it more affordable than the prevailing M-Pesa fees. Intermediaries are eliminated and no additional
hardware is required to operate the scheme. The cost and complexity barriers which previous proposals failed
to solve by using the chip card system have been addressed. The added advantage of using a developing coun-
try as a case study makes the argument for PCT even more appealing to policymakers for consideration as a
globally-inclusive and feasible policy option. This research is the first to empirically show the feasibility of PCT
in a developing country context and which leverages basic mobile phones. It is hoped that this will trigger more
interest in developing country participation and also consideration of this scheme in developed countries.
10Environ. Res.: Infrastruct. Sustain. 1 (2021) 015002 F M O Al-Guthmy and W Yan
Acknowledgments
The author would like to thank Mohamed Khalil Timamy for his research guidance, Akiyoshi Hatayama for
sharing his wisdom whenever it was sought and Tomoyuki Furutani for his suggestions which helped improve
this work.
Funding
This research did not receive any specific grant from funding agencies in the public, commercial, or not-for-
profit sectors.
Data availability
The author confirms that the data supporting the findings of this study are available within the article and also
from Al-Guthmy and Yan (2020) which served as the groundwork for this expansion.
Disclosure statement
No potential conflict of interest was reported by the authors.
ORCID iDs
Fahd Mohamed Omar Al-Guthmy https://orcid.org/0000-0002-4308-1651
Wanglin Yan https://orcid.org/0000-0001-9520-779X
References
Al-Guthmy F M O and Yan W 2020 Mind the gap: personal carbon trading for road transport in Kenya Climate Policy (London: Taylor &
Francis)
Ayres R U 1997 Environmental market failures: are there any local market-based corrective mechanisms for global problems? Mitig. Adapt.
Strategies Glob. Change 1 289–309
Bank of England 2020 Inflation calculator available at: https://bankofengland.co.uk/monetary-policy/inflation/inflation-calculator
(accessed: May 30, 2020)
Burgess M 2016 Personal carbon allowances: a revised model to alleviate distributional issues Ecol. Econ. 130 316–27
Communications Authority of Kenya 2015-2019a https://ca.go.ke/consumers/industry-research-statistics/statistics/First quarter sector
statistics report (July–September) available at: https://ca.go.ke/consumers/industry-research-statistics/statistics/
Communications Authority of Kenya 2015-2019b https://ca.go.ke/consumers/industry-research-statistics/statistics/Secondquarter sector
statistics report (October–December) available at: https://ca.go.ke/consumers/industry-research-statistics/statistics/
Communications Authority of Kenya 2016-2019a https://ca.go.ke/consumers/industry-research-statistics/statistics/Fourth quarter sector
statistics report (April–June) available at: https://ca.go.ke/consumers/industry-research-statistics/statistics/
Communications Authority of Kenya 2016-2019b https://ca.go.ke/consumers/industry-research-statistics/statistics/Third quarter sector
statistics report (January–March) available at: https://ca.go.ke/consumers/industry-research-statistics/statistics/
DEFRA 2008 Synthesis Report on the Findings from Defra’s Pre-Feasibility Study into Personal Carbon Trading (London: DEFRA)
Department for Environment Food Rural Affairs available at: http://teqs.net/Synthesis.pdf
Fawcett T and Parag Y 2010 An introduction to personal carbon trading Clim. Policy 10 329–38
Fleming D 1997 Tradable quotas: using information technology to cap national carbon emissions Eur. Environ. 7 139–48
Harwatt H 2008 Reducing carbon emissions from personal road transport through the application of a tradable carbon permit scheme:
empirical findings and policy implications from the UK International Transport Forum p 30
Harwatt H et al 2011 Personal carbon trading and fuel price increases in the transport sector: an exploratory study of public response in
the UK European Transport vol 47 47–70
Hillman M and Fawcett T 2004 How we can save the planet Int. J. Sustain. High Educ. 5 4
Kenya National Bureau of Statistics 2020 Economic Survey 2020 Government Printer
Lane C, Harris B and Roberts S 2008 An Analysis of the Technical Feasibility and Potential Cost of a Personal Carbon Trading Scheme: A
Report to the Department for Environment, Food and Rural Affairs (London: DEFRA)
Niemeier D et al 2008 Rethinking downstream regulation: California’s opportunity to engage households in reducing greenhouse gases
Energy Policy 36 3436–47
Raux C 2010 The potential for CO2 emissions trading in transport: the case of personal vehicles and freight Energy Effic. 3 133–48
Raux C, Croissant Y and Pons D 2015 Would personal carbon trading reduce travel emissions more effectively than a carbon tax? Transport.
Res. Transport Environ. 35 72–83
Raux C and Marlot G 2005 A system of tradable CO2 permits applied to fuel consumption by motorists Transp. Policy 12 255–65
Rothengatter W, Hayashi Y and Schade W (ed) 2011 Transport Moving to Climate Intelligence (New York: Springer)
Safaricom Limited 2014 Annual report and financial statements, Nairobi available at: https://safaricom.co.ke/investor-relation/financials/
reports/annual-reports
Safaricom Limited 2015 Annual report and financial statements, Nairobi available at: https://safaricom.co.ke/investor-relation/financials/
reports/annual-reports
11Environ. Res.: Infrastruct. Sustain. 1 (2021) 015002 F M O Al-Guthmy and W Yan
Safaricom Limited 2016 Annual report and financial statements, Nairobi available at: https://safaricom.co.ke/investor-relation/financials/
reports/annual-reports
Safaricom Limited 2017 Annual report and financial statements, Nairobi available at: https://safaricom.co.ke/investor-relation/financials/
reports/annual-reports
Safaricom Limited 2018 Annual report and financial statements, Nairobi available at: https://safaricom.co.ke/investor-relation/financials/
reports/annual-reports
Safaricom Limited 2019 Annual report and financial statements, Nairobi available at: https://safaricom.co.ke/investor-relation/financials/
reports/annual-reports
Starkey R 2011 Assessing common(s) arguments for an equal per capita allocation Geograph. J. 177 112–26
Starkey R and Anderson K 2005 Domestic tradable quotas: a policy instrument for reducing greenhouse gas emissions from energy use
Tyndall Centre for Climate Change Research: Technical Report 39
12You can also read