INVESTOR PRESENTATION May 19, 2021 - cloudfront.net

Page created by Kelly Riley
 
CONTINUE READING
INVESTOR PRESENTATION May 19, 2021 - cloudfront.net
I N V E S T O R P R E S E N TAT I O N M a y 1 9 , 2 0 2 1
INVESTOR PRESENTATION May 19, 2021 - cloudfront.net
Disclaimer                                                                                                                                                                                             2

This investor presentation (this “Investor Presentation”) and any oral statements made in connection with this Investor Presentation are for informational purposes only and do not constitute an offer
to sell, a solicitation of an offer to buy, or a recommendation to purchase any equity, debt or other securities of ARKO Corp., a Delaware corporation (including its consolidated subsidiaries, “ARKO,”
the “Company,” “we,” “us” or “our”). The information contained herein does not purport to be all inclusive. The data contained herein is derived from various internal and external sources believed to
be reliable, but there can be no assurance as to the accuracy or completeness of such information. No representation is made as to the reasonableness of the assumptions made within or the accuracy
or completeness of any projections, modeling or any other information contained herein. Any data on past performance contained herein is not an indication as to future performance. Except as
required by applicable law, ARKO assumes no obligation to update the information in this Investor Presentation. Nothing herein shall be deemed to constitute investment, legal, tax, financial,
accounting or other advice. The communication of this Investor Presentation is restricted by law it is not intended for distribution to, or use by any person in, any jurisdiction where such distribution or
use would be contrary to local law or regulation No representation or warranty (whether express or implied) has been made by ARKO with respect to the matters set forth in this Investor Presentation.
INVESTOR PRESENTATION May 19, 2021 - cloudfront.net
Disclaimer                                                                                                                                                                                           3

Forward Looking Statements

This Investor Presentation includes “forward looking statements” within the meaning of the safe harbor provisions of the Private Securities Litigation Reform Act of 1995. The expectations, estimates,
and projections of the businesses of ARKO may differ from actual results and consequently, you should not rely on these forward looking statements as predictions of future events. Words such as
“expect,” “estimate,” “project,” “budget,” “forecast,” “anticipate,” “intend,” “plan,” “may,” “will,” “could,” “should,” “believes,” “predicts,” “potential,” “continue,” and similar expressions are
intended to identify such forward looking statements. These forward looking statements include, without limitation, expectations with respect to the future prospects of ARKO. These forward looking
statements involve significant risks and uncertainties that could cause the actual results to differ materially from the expected results. Most of these factors are outside of the control of ARKO and are
difficult to predict. Factors that may cause actual results to differ materially from those expressed in forward-looking statements include, but are not limited to: (1) the impact of the COVID 19
pandemic on the business of ARKO; (2) the ability to recognize the anticipated benefits of becoming a U.S. public company, which may be affected by, among other things, competition, the ability of
ARKO to grow and manage growth profitably and retain its key employees; (3) changes in applicable laws or regulations; (4) the demand for ARKO’s services together with the possibility that ARKO
may be adversely affected by other economic, business, and/or competitive factors; (5) risks and uncertainties related to ARKO’s business, including, but not limited to, changes in fuel prices, the
impact of competition, environmental risks, restrictions on the sale of alcohol, cigarettes and other smoking products and increases in their prices, dependency on suppliers, increases in fuel efficiency
and demand for alternative fuels for electric vehicles, failure by independent operators to meet their obligations, acquisition and integration risks, and currency exchange and interest rates risks; (6)
failure to realize the expected benefits of entities and businesses that ARKO acquires; (7) failure to promptly and effectively integrate acquired businesses; (8) the potential for unknown or inestimable
liabilities related to acquired businesses; and (9) other risks and uncertainties included in our Annual Report on Form 10-K and the other documents and other materials we file with the Securities and
Exchange Commission (the “SEC”). The foregoing list of factors is not exclusive. You should not place undue reliance upon any forward looking statements, which speak only as of the date made.
Except to the extent required by applicable law, ARKO does not undertake or accept any obligation or undertaking to release publicly any updates or revisions to any forward looking statements to
reflect any change in their expectations or any change in events, conditions, or circumstances on which any such statement is based.

Industry and Market Data

Industry and market data used in this Investor Presentation have been obtained from third party industry publications and sources, including reports by market research firms. ARKO has not
independently verified the information and data obtained from these sources and cannot assure you of the data’s accuracy or completeness. This information and data is subject to change.

Use of Non-GAAP Financial Metrics

This Investor Presentation includes both financial information presented in accordance with U.S. generally accepted accounting principles (“GAAP”) as well as certain non-GAAP financial measures for
ARKO, such as Adjusted EBITDA, net of incremental bonuses and same store measures. ARKO’s management uses these non-GAAP measures in the management of ARKO’s business and believes that
the presentation of non-GAAP measures provides information that is useful to investors as it indicates more clearly the ability of ARKO to meet capital expenditure and working capital requirements
and provides an additional tool for investors to use in evaluating ongoing operating results and trends. Other companies may calculate Adjusted EBITDA and other non-GAAP measures differently,
and therefore ARKO's Adjusted EBITDA and other non-GAAP measures may not be directly comparable to similarly titled measures of other companies. Investors should review ARKO's audited annual
and unaudited interim financial statements, which are prepared in accordance with GAAP, and not consider any of ARKO’s non-GAAP measures in isolation or as a substitute for our financial results
reported in accordance with GAAP.

Additional information with respect to ARKO is contained in its filings with the SEC and is available at the SEC’s website, http://www.sec.gov, and on ARKO’s website, www.arkocorp.com.
INVESTOR PRESENTATION May 19, 2021 - cloudfront.net
Today’s Participants                                                                                                                                             4

                                                                  ARKO Presenters

                            Acquired GPM Investments, LLC in 2011, now a wholly owned subsidiary of ARKO, at which time it operated and supplied 320
                             sites
                            Grew ARKO to 3,000 current sites through a series of 19 acquisitions
                            Spearheaded various real estate and fuel transactions totaling >$2 billion
     ARIE KOTLER            Deep experience and expertise in convenience store operations
  Founder, Chairman &CEO    Seasoned executive experienced in international financial markets and publicly-traded companies/entities

                            CFO of ARKO since April 2014 and previously from 2004-2010
                            Former CFO of Mid-Atlantic Convenience Stores (Catterton-backed and sold to Sunoco in 2013)
                            Served in a wide variety of financial, treasury and MIS roles with major oil companies, other distributors, and service providers
    DON BASSELL             Over 35 years of experience in petroleum, convenience stores, refining and fuel distribution
          CFO
INVESTOR PRESENTATION May 19, 2021 - cloudfront.net
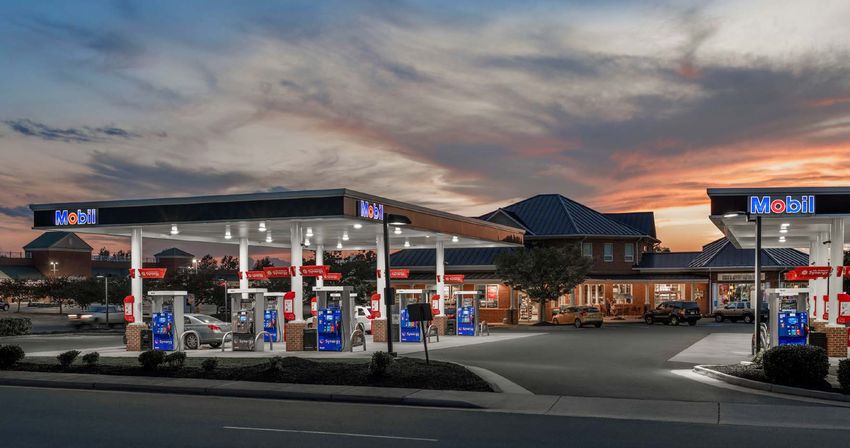
A High Growth, Scaled Consolidator in the U.S. Convenience Store Industry                                                                                                                                                  5

         A LEADING U.S. CONVENIENCE STORE OPERATOR                                                                                           LARGE, RAPIDLY GROWING NETWORK
                                                                                                            (location total)

                    6th                                         3,009
                                                                                                                                                                                                        2,944            3,009
                                                                                                              3,000
                                                                                                              2,500            15%+ Retail Site 5-Year CAGR
                                                                                                                                                                                                        1,614            1,625
         Largest U.S. Convenience                  Total sites as of 03/31/21, including                      2,000
             Store Operator(1)                     1,324 retail stores and 1,625 dealer-                                                                                   1,341          1,400
                                                                                                              1,500                                        1,103                                  128
                                                     operated / ARKO-supplied sites(3)                                                       1,023                                  126
                                                                                                              1,000            777                   134           130
                                                                                                                                       111                               1,215            1,272         1,330        1,384(3)
                     33
                                                                                                                500                           889          973
                                                         ~$1.6 Billion                                            0
                                                                                                                               666

                                                                                                                               2015          2016          2017            2018           2019          2020             2021
             States of Operation                     2020 Pro Forma In-Store Sales(2)
                                                                                                                                                            Retail Sites      Wholesale Sites

                                 ~2.0 Billion
                                                                                                                                         TOP U.S. CONVENIENCE STORE OPERATORS(1)
                         2020 Pro Forma Fuel Gallons        Sold(2)                                                   RANK            COMPANY / CHAIN               U.S. STORE COUNT
                                                                                                                          1                                                13,264                               8.8%
                     DIVERSE GEOGRAPHIC FOOTPRINT
                                                                                                                          2                                                5,933                                3.9%
                                                                                                                         3                                                 2,181                                1.4%
                                                                                                                          4                                                1,679                                1.1%
                                                            3,009 sites across 33 states                                  5                                                 1,489                               1.0%
                                                            and Washington D.C.; retail
                                                                                                                          6                                                1,384   (3)
                                                                                                                                                                                                                0.9%
                                                             network expanded ~4.2x
                                                               over past eight years                                     7                                                  1,017                               0.7%
                                                                                                                          8                                                  942                                0.6%
                                                                                                                          9                                                  880                                0.6%
                                                                                                                         10                                                  820                                 0.5%
(1)   According to CSP’s Top 202 Convenience Stores 2020; includes only company-operated locations based on 2019 store counts (7-Eleven is combined with Speedway following recent merger) with the exception of ARKO.
(2)   Includes ‘Q1 – ‘Q3 2020 contribution of Empire in addition to ARKO’s FY2020 results.
(3)   Reflects ARKO’s store count as of 03/31/21 in addition to the 5/18/21 transaction of 60 ExpressStop sites; excludes 1,625 wholesale locations.
INVESTOR PRESENTATION May 19, 2021 - cloudfront.net
INVESTMENT HIGHLIGHTS
INVESTOR PRESENTATION May 19, 2021 - cloudfront.net
Investment Highlights                                                                                     7

 1   A Leader in the Large and Growing Convenience Store Sector

                2   Successful, Differentiated Strategy Embracing Community C-Store Brands

                        Demonstrated History of Rapid, High-ROI Growth Led by Reputation as an Acquirer
                    3   of Choice

                    4   Expected Significant Embedded Growth via Remodel Opportunity

                5   Inherent Growth as a Result of the 2020 Acquisition of Empire

 6   Founder-Led Management Team
INVESTOR PRESENTATION May 19, 2021 - cloudfront.net
We Believe We Are an Acquiror-of-Choice in Highly Fragmented Industry with a
 1                                                                                                                                                                                                                  8
            Long Runway of Opportunities Ahead

                         ARKO’S SUCCESSFUL HISTORY OF GROWTH                                                                            U.S. CONVENIENCE STORE COMPOSITION BY CHAIN SIZE(1)
                                                                                                                                                 Fragmented industry of 152,720 convenience stores
             19 acquisitions completed since 2013
                                                                                                                                                                                    500+ Stores
             Store base grown ~4.2x in eight years                          (3)
                                                                                                                                                                                       17% (26,000)

             Highly fragmented market                                                                                                                                                    201 - 500 Stores
                                                                                                                                                                                                 6% (9,200)
                     ‒     70% of industry comprised of
INVESTOR PRESENTATION May 19, 2021 - cloudfront.net
2   Entrenched, Local Brands Plus Benefits of Participation in Large Network                9

     ~50 Years Average Local Brand History       ROI-Focused Acquiror of Choice

                                                Differentiated Strategy Preserves
                                                Long-Established Community Brand Equity

                                                Centralized Procurement and Merchandising
                                                Leverage Network Scale

                                                Optimized Purchasing and High-Performing
                                                In-Store Product Offerings Drive ROI

                                                Common Loyalty Program Enables Network-
                                                Wide Promotions and Marketing Initiatives
INVESTOR PRESENTATION May 19, 2021 - cloudfront.net
3        Multi-Faceted Growth Strategy                                                                                                                           10

                                                                                                                    ROBUST WHOLESALE PLATFORM:
    CONTINUE CORE ACQUISITION STRATEGY                        AGGRESSIVE REMODEL OPPORTUNITY
                                                                                                                        EMPIRE ACQUISITION
       Highly fragmented U.S. convenience store             Team built to optimize acquired assets;            Low overhead wholesale operations
        industry                                              remodel prototype underway                         Enhances cash flow stability (long-term
       Well-developed acquisition and integration           Traffic counts and demographics analyzed to         contracts) and diversification
        capabilities                                          identify ~700 candidates                           Widens range of acquisition targets; certain
                                                                                                                  competing consolidators have difficulty
       Ability to acquire both small and large chains;      Foodservice will be a key feature of store
                                                                                                                  acquiring wholesale operations
        ARKO reviews all opportunities                        reinvestment program
                                                                                                                 Scale enhances leverage with suppliers and
       Actionable pipeline of opportunities                 360 sites projected to be remodeled over the        synergy potential
       In-house M&A team performs in-depth reviews           next three to five years
        of several target opportunities per annum            Estimating ~$70 million of incremental EBITDA
                                                              and pre-tax ROI of 20%+
Dedicated M&A Team with Well-Developed Target Diligence, Transaction
 3                                                                                                                                                                                     11
            Execution, and Integration Capabilities
      ARKO has consistently acquired quality assets at attractive multiples relative to publicly disclosed industry transactions. The Company has
      exercised demonstrable price discipline and creative approaches to transaction structuring which has historically resulted in attractive returns
      over time.

                   6.6x                                                 19                                                                                             2,944   3,009

        Historical Gross Purchase Multiple(1)                   Acquisitions Since 2013

                       18                                       IN-HOUSE
                                                                M&A TEAM
              Regional C-Store Banners                         with Extensive Experience
                                                                                                                                                               1,400
                                                                                                                                                       1,341
                                                                                                                      (2)

                                                                                                                                    1,103
                                                                                           (2)            1,023

                                      (2)
                                                                                 777
                              596                       573

       Stores                2013                      2014                      2015                      2016                      2017              2018    2019    2020    2021
       Acquired:           301                             0                       211                       264                      106(3)           289      87     1,537    60

(1)   Sample size based on 14 transactions completed (excludes 2019 and 2020 acquisitions for lack of visibility into post-transaction performance).
(2)   Gas Mart, Road Ranger, Arey Oil, and Hurst Harvey stores rebranded post-closing under Company’s existing brands.
(3)   Includes Broyles Hospitality locations, a Dunkin’ franchisee in Tennessee and Virginia.
Strong Return on Capital: Sustained Price Discipline Augmented by
 3                                                                                                                                                                                                 12
           Significant Synergies Opportunities
     ARKO has maintained purchase price discipline over time and focused intently on capturing cost savings and synergies post-transaction. Thorough diligence on the
     front end has been key to avoid mis-pricing assets that erode the Company’s ability to meet return hurdles. Looking forward, we believe that the scale of the platform
     will enable the Company to achieve greater levels of synergies.

                                                               AVERAGE ARKO PURCHASE MULTIPLES FROM 2013 TO 2018(1)
                             8.0x
                                                                            6.6x
                             6.0x
                                                                                                                                                                       38.2%
                             4.0x                                                                                                                                      Return on Capital(2)
                                                                                                                                                2.6x
                             2.0x

                             0.0x
                                                                           Gross                                                                Net (2)

                                                                                 ARKO’S DISCIPLINED APPROACH TO M&A

                   Identify strategic                       Execute the right deals                                  Efficient                  Aggressively extract
                                                                                                                                                                                      Deleverage
                     opportunities                            at the right prices                                  integration                       synergies

Note: Sample size based on 14 transactions (excludes 2019 -2021 acquisitions for lack of visibility into post-transaction performance); “Net”
multiple based on EBITDA generated one-year after closing of acquisitions and is illustrated as a weighted average across all transactions.
(1) Purchase price based on store-level EBITDA.
(2) Before incremental G&A expenses from acquisitions; capital reduced by value structured real estate financing.
3          Capturing Synergies Has and Is Expected to Continue to Create Substantial Value                                                                                                                              13

      ARKO’s scale and purchasing power are leveraged to significantly improve the performance of acquired operations
                                                                      HURST HARVEY                                                VPS – SOUTHEAST DIVISION                                       AREY OIL
                                                            Purchase Price: $4.8 million                                   Purchase Price: $45.9 million                          Purchase Price: $8.7 million
                                                            Geography: VA                                                  Geography: NC, SC, TN, & VA                            Geography: NC & SC
                                                            Sites: 5                                                       Sites: 296                                             Sites: 8
                                                                                                 28.4¢                                                                 20.0¢                                     21.4¢
                                                                     17.7¢       +10.7¢                                                       16.4¢        +3.6¢                         17.5¢     +3.9¢
                  Fuel Margin
                                                                    At Close                  12 Mos.                                        At Close                 12 Mos.           At Close             12 Mos.
                                                                                             Post-Close                                                              Post-Close                             Post-Close
                                                                                                31.7%                                         32.1%                    31.6%                                     33.2%
                     In-Store                                        21.9%       +9.8%                                                                   (0.5%)(2)                       29.0%      4.2%

                     Margins(1)                                     At Close                  12 Mos.                                        At Close                 12 Mos.           At Close             12 Mos.
                                                                                             Post-Close                                                              Post-Close                             Post-Close
                 ($ in millions)                                                                $1.5                                                                   $21.1                                   $2.5
                                                                                                                                              $16.1
                   Store-Level                                        $0.8        +90%                                                                     +31%                           $1.5     +69%

                     EBITDA                                         At Close                  12 Mos.                                        At Close                 12 Mos.           At Close             12 Mos.
                                                                                             Post-Close                                                              Post-Close                             Post-Close
                                                                      6.0x                                                                     2.8x                                       5.9x
                                                                                                                                                                        2.2x
                    MULTIPLE                                                                     3.2x                                                                                                            3.5x
                  REDUCTION AS
                                                                    At Close                  12 Mos.                                        At Close               12 Mos.             At Close             12 Mos.
                  SYNERGIES ARE                                                              Post-Close                                                            Post-Close                               Post-Close
                    REALIZED                                         2.8x Reduction                                                           0.6x Reduction                             2.4x Reduction
(1)   In-store margin does not include adjustments for inventory over/short, spoilage, or deferred loyalty sales.
(2)   ARKO adopted an alternate cigarette pricing strategy post-transaction, voluntarily sacrificing profit margin for higher volumes to drive store traffic.
4        Multi-Faceted Growth Strategy                                                                                                                           14

                                                                                                                    ROBUST WHOLESALE PLATFORM:
    CONTINUE CORE ACQUISITION STRATEGY                        AGGRESSIVE REMODEL OPPORTUNITY
                                                                                                                        EMPIRE ACQUISITION
       Highly fragmented U.S. convenience store             Team built to optimize acquired assets;            Low overhead wholesale operations
        industry                                              remodel prototypes underway                        Enhances cash flow stability (long-term
       Well-developed acquisition and integration           Traffic counts and demographics analyzed to         contracts) and diversification
        capabilities                                          identify ~700 candidates                           Widens range of acquisition targets; certain
                                                                                                                  competing consolidators have difficulty
       Ability to acquire both small and large chains;      Foodservice will be a key feature of store
                                                                                                                  acquiring wholesale operations
        ARKO reviews all opportunities                        reinvestment program
                                                                                                                 Scale enhances leverage with suppliers and
       Actionable pipeline of opportunities                 360 sites projected to be remodeled over the        synergy potential
       In-house M&A team performs in-depth reviews           next three to five years
        of several target opportunities per annum            Estimating ~$70 million of incremental EBITDA
                                                              and pre-tax ROI of 20%+
Roughly Half of Existing Company Operated Stores Are Candidates for
 4                                                                                                                                                                                                                 15
            High Return Store Remodel Program
      Following significant acquisition growth, ARKO is re-investing in the in-store experience with numerous initiatives to drive sales and
      enhance returns

                       SIGNIFICANT STORE REMODEL PROGRAM(1)                                                                                             PROGRAM OVERVIEW
          Significant, embedded growth opportunity with high return store refresh program
                                                                                                                                Identified candidates after analysis of traffic counts, local demographic
                                                                                                                                 information and remodel feasibility studies
                                                                                                                                Plans to spend ~$360 million over next three to five years with an anticipated
                                                                                                                                 return on capital of at least 20%; estimated ~$70 million of EBITDA upside over
                                                                                                                                 three to five years
                                                                                                                                Program will emphasize brand development with regional brands featured
                                                                                                                                 alongside national ARKO brand for network consistency
                                                                                                                                Emphasis on enhanced foodservice offering

                                                                                                                                       ESTIMATED TOTAL STORES REMODELED OVER TIME
                                                                                                                                400                                                                      360

                                                                                             Cumulative # of Remodeled Stores
                                                                                                                                300                                                       260

                                                                                                                                200                                       160

                                                                                                                                100                        60
                                                                                                                                            10
                                                                                                                                 0
                                                                                                          % of                             '21E           '22E            '23E           '24E            '25E
                                                                                                        Current                           0.8%            4.7%           12.6%          20.4%           28.3%
                                                                                                         Stores

(1)   Will include select raze & rebuilds.
4         Remodeling Efforts in the Past Have Generated Significant Returns                                                                                                      16

          ($ in 000’s)                                                                  STORE 57 – RAZE & REBUILD
                                                                                $750                              $651
                          Investment: $2,174.0                                                                                               ARKO HAS EXPERIENCED SIGNIFICANT
                                                                                $500

                                                                       EBITDA
                          ROI: 28.6%                                                                                                        SUCCESS WITH PAST REMODEL EFFORTS
                                                                                $250                                                               GENERATING RETURNS IN
                          Payback: 3.5 years                                                $27
                                                                                 $0                                                                THE ~30% TO 60% RANGE
                                                                                           12 Mos.              12 Mos.
                                                                                                                         (1)
                                                                                          Prior-Close          Post-Close

                                                                                         BEFORE(2)                                                                      AFTER(2)

                                       STORE 27 – “SOFT” REMODEL                                                               STORE 33 – “HARD” REMODEL
         Investment: $199.5                          $400                               $335            Investment: $358.6               $750                        $680
                                                                   $279                                                                                $464
                                             EBITDA

                                                                                                                                  EBITDA
         ROI: 28.1%                                  $300                                               ROI: 60.2%                       $500

                                                      $200                                                                                 $250
         Payback: 3.6 years                                                                             Payback: 1.7 years
                                                      $100                                                                                  $0
                                                                 12 Mos.                12 Mos.                                                      12 Mos.          12 Mos.
                                                                Prior-Close            Post-Close                                                   Prior-Close      Post-Close

Note: ROI defined as EBITDA lift divided by total investment.
(1) Follows a three month re-opening period.
(2) Store #57 located in Quinton, Virginia.
4   Remodeling Platform                                                                 17

                    Remodel Platform to Drive Increased Foot Traffic and Inside Sales
5        Multi-Faceted Growth Strategy                                                                                                                           18

                                                                                                                    ROBUST WHOLESALE PLATFORM:
    CONTINUE CORE ACQUISITION STRATEGY                        AGGRESSIVE REMODEL OPPORTUNITY
                                                                                                                        EMPIRE ACQUISITION
       Highly fragmented U.S. convenience store             Team built to optimize acquired assets;            Low overhead wholesale operations
        industry                                              remodel prototype underway                         Enhances cash flow stability (long-term
       Well-developed acquisition and integration           Traffic counts and demographics analyzed to         contracts) and diversification
        capabilities                                          identify ~700 candidates                           Widens range of acquisition targets; certain
                                                                                                                  competing consolidators have difficulty
       Ability to acquire both small and large chains;      Foodservice will be a key feature of store
                                                                                                                  acquiring wholesale operations
        ARKO reviews all opportunities                        reinvestment program
                                                                                                                 Scale enhances leverage with suppliers and
       Actionable pipeline of opportunities                 360 sites projected to be remodeled over the        synergy potential
       In-house M&A team performs in-depth reviews           next three to five years
        of several target opportunities per annum            Estimating ~$70 million of incremental EBITDA
                                                              and pre-tax ROI of 20%+
An Attractive Business Mix with Enhanced Stability Provided by Strategic
  5                                                                                                                                                                                                         19
            Empire Petroleum Combination
                  DIVERSIFIED GROSS PROFIT MIX FOR THE ARKO BUSINESS                                               EMPIRE ACQUISITION ADDS ADDITIONAL SCALE AND GREATLY EXPANDS
                                                                                                                    ARKO’S EXPOSURE TO WHOLESALE FUEL DISTRIBUTION OPERATIONS

                        GROSS PROFIT                                     MERCHANDISE GROSS                                                                             33                     3,009
                         MIX (FY20)                                      PROFIT MIX (FY20)(3)                      3,000
                                                                                OTP                                                                                    (10)
                         Other                                                                                     2,000     1,389 139        84
                                                                                9%                Grocery                                                             2,936              1,625
           Fuel Wholesale 8%                                    Alcoholic
                                                                                                                   1,000                                  1,453
                 3%                                                9%                              27%                             1,250                                           60    1,384
                                                                                                                      0
                                                           Foodservice                                                      ARKO Pre-       Empire      Empire         Post-    ExpressStop      2021(1)
                                                              12%                                                          Transaction       Retail    Wholesale      Empire
          Retail Fuel                                                                                                                                              Net New Sites
             38%                               Merchandise       Cigarettes                                                                           Retail Sites  Wholesale Sites
                                                                                              Non-Alcoholic
                                                  51%               17%                           26%

                                                                                                                           ~1 Billion                                   ~2.0 Billion
                                                                                                                        Fuel volume excluding                            Fuel volume including
                                HISTORICALLY STABLE FUEL MARGINS
                                                                                                                       Empire Petroleum (FY20)                            Empire Petroleum(2)
         (cents per gallon)
                                                                                                                                         Empire acquisition doubled Company’s scale
         40.0¢                                                                                          32.1¢
                                                                                           31.9¢
         30.0¢                                         21.6¢
                        20.3¢          20.5¢                           20.7¢
         20.0¢
                        6.6¢            8.3¢            7.8¢             9.0¢              8.2¢             8.0¢
         10.0¢
                                                                                                                             COMBINED
          0.0¢
                        2016           2017             2018            2019               2020         1Q20          33 States & Washington, D.C.
                                                                                                                             3,009 Stores(1)
                                       Retail                                 Wholesale                              (1,384 Retail, 1,625 Wholesale)
                                                                                                                                                                         ARKO           New Empire states

Note:
(1) Reflects ARKO’s store count as of 03/31/21 in addition to 60 ExpressStop sites;
(2) Includes ‘Q1 – ‘Q3 2020 contribution of Empire in addition to ARKO’s FY2020 results.
(3) Excludes wholesaler allowances.
Recent Updates                                                                                                                                                                                      20

                1Q 2021 EARNINGS                                             $1 Billion Real Property Commitment                                                 COMPLETED ACQUISITION OF
                 ANNOUNCEMENT                                                            from Oak Street                                                              EXPRESS STOP

   Operating Income increased $21.2 million                                In May 2021, ARKO entered into an                                           In May 2021, ARKO closed on its
    (265%) . $13.2 million Q1 21compared to                                  agreement with Oak Street Real Estate                                        previously announced acquisition of 60
    Operating Loss of $8.0 million in Q1 20.                                 Capital LLC.                                                                 convenience stores with gas stations in
   Adjusted EBITDA of $42.3 million, an                                    Oak Street has agreed to purchase and                                        Michigan and Ohio operating under the
    increase of $25.4 million, or 150%,                                      lease to GPM real estate associated with                                     ExpressStop banner.
    versus 1Q20, with Empire contributing                                    acquisitions of convenience stores and                                      This acquisition will complement GPM’s
    approx. $13 million of the increase.                                     fueling stations. GPM would own and                                          existing 165 stores in Michigan and 9
   Eliminating the extra day in 2020 due                                    operate the related acquired businesses,                                     stores in Ohio.
    to the leap year, same store                                             whereas Oak Street would own the real                                       Purchase multiple was approximately
    merchandise sales increased by 7.2%                                      estate and lease it to GPM.                                                  1.5x(1).
    and same store merchandise sales
                                                                            Oak Street is committing up to $1 billion
    excluding cigarettes increased by
                                                                             to the program for a one-year period.
    10.4% as compared to 1Q20.
   Merchandise margin increased 130
    basis points year-over-year
Reconciliation of Adjusted EBITDA to Net loss on
Page 30
                   (1)   Purchase price based on store-level EBITDA before incremental G&A expenses from acquisitions; capital reduced by value structured real estate financing.
FINANCIAL OVERVIEW
Same Store In-Store Sales vs Prior Year                                                                                              22

                                                  Slight retreat during the worst of the pandemic;
                                                  accelerated in more recent months as consumer
                                                    behavior shifted and state re-openings were
                                                                       initiated

                                          8.0%
                                                                                                                          7.2% (1)
                                          7.0%

                                          6.0%
                                                                                                5.0%     5.0%
                                          5.0%

                                          4.0%

                                          3.0%
                                                                                                                   3.3%
                                          2.0%

                                          1.0%
                                                          0.3%
                                                                                    0.2%
                                          0.0%
                                                         Q4 19              Q1 20               Q2 20    Q3 20   Q4 20     Q1 21

                                          (1)   Eliminates the extra day in 2020 due to the leap year.
Strong Track Record of Growth Projected to Continue                                                                                                                                                                                       23

      ARKO is an industry leader with strong projected earnings and sales growth

                               HISTORICAL AND PRO FORMA FUEL VOLUMES                                                                                HISTORICAL AND PRO FORMA IN-STORE SALES
                                                                                                                                  ($ in 000s)                                     ARKO          Empire            $1,567
       (gallons in millions)                                                                                                                                                                   $1,494
        2,500                                     ARKO         Empire                                                                $1,500                                   $1,376
                                                                                                                                                                $1,282
                                                                                  1,956                                              $1,300
        2,000                                                                                                                                     $1,032
                                                                                                                                     $1,100
        1,500                                                   1,207                                                                  $900
                                    1,053       1,108
                        872                                                                                                            $700
        1,000
                                                                                                         448                           $500                                                                                 $324       $359
          500                                                                                 249
                                                                                                                                       $300
             0                                                                                                                         $100
                        '17          '18         '19           '20             '20        1Q20          1Q21                                         '17           '18          '19             '20                '20       1Q20      1Q21
                                                             Reported       Pro Forma (2)                                                                                                     Reported          Pro Forma(2)
                                                          Excludes ‘Q1 – ‘Q3                                                                                                          Excludes ‘Q1 – ‘Q3 contribution
                                                       contribution from Empire                                                                                                                 from Empire

                    ADJUSTED EBITDA, NET OF INCREMENTAL BONUSES(1)                                                                                             CONTINUED STRONG GROWTH(2)
      ($ in millions)
       $280.0
                                                                                                                                                                                        18.4%
      $210.0                  Growth:                                                                                                                                          In-Store Sales CAGR
                                                   $183
                               135%                                                                                                                                              (2016-2020 PF)
      $140.0
                              $78                                                       Growth:
       $70.0                                                                             150%                                                                                           30.0%
                                                                                                      $42
                                                                                  $17                                                                                       Fuel Volume Sales CAGR
         $0.0
                                                                                                                                                                                (2016-2020 PF)
                          FY 2019                FY 2020                     Q1 2020                Q1 2021

(1)   Adjusted EBITDA, net of incremental bonuses is calculated as EBITDA adjusted to exclude the gain or loss on disposal of assets, impairment charges, acquisition costs, other non-cash items, other unusual or non-recurring charges and
      incremental bonuses based on 2020 performance. Refer to Appendix for reconciliation
(2)   Includes ‘Q1 – ‘Q3 2020 contribution of Empire in addition to ARKO’s FY2020 results
Capitalization                                                                                            24

1)   Total capacity of up to $140 million.
2)   Current availability of $100 million with the option to add an accordion facility of $200 million.
3)   Represents US Treasury collateral.
4)   Equity value reflects closing price as of May 13, 2021.
APPENDIX
Diversified Community Brands with Regional Footprints                                                                                                                                               26

        SITES                  YEAR ACQ.                             SITES                  YEAR ACQ.                            SITES                   YEAR ACQ.     SITES            YEAR ACQ.
          265                      2018                               213                      Legacy                             144                        2013      129                 2016
         STATE(S) OF OPERATION                                        STATE(S) OF OPERATION                                       STATE(S) OF OPERATION                STATE(S) OF OPERATION
                 AR, LA, OK, TX                                CT, IA, IL, IN, KY, MI, NC, NE, PA, TN, VA                                  NC, SC, TN, VA                      IN, MI

                                                                                                                             (formerly Road Ranger and Gas Mart)
        SITES                  YEAR ACQ.                             SITES                  YEAR ACQ.                            SITES                   YEAR ACQ.    SITES             YEAR ACQ.
          89                       2015                                92                       2017                               44                      Multiple    51                 2019
         STATE(S) OF OPERATION                                        STATE(S) OF OPERATION                                       STATE(S) OF OPERATION               STATE(S) OF OPERATION
                 IL, IN, MI, OH                                              NC, SC, TN, VA                                             IL, IA, KY, IN, NE, MI                 WI

        SITES                  YEAR ACQ.                             SITES                  YEAR ACQ.                            SITES                   YEAR ACQ.    SITES             YEAR ACQ.
          38                       2016                                28                       2015                               28                        2013      22                 2013

         STATE(S) OF OPERATION                                        STATE(S) OF OPERATION                                       STATE(S) OF OPERATION               STATE(S) OF OPERATION
                     KY, VA                                                       IN, MI                                                         SC                            SC

        SITES                  YEAR ACQ.                             SITES                  YEAR ACQ.                            SITES                   YEAR ACQ.    SITES             YEAR ACQ.
          17                       2019                                16                       2016                               16                        2015      11                 2018

         STATE(S) OF OPERATION                                        STATE(S) OF OPERATION                                       STATE(S) OF OPERATION               STATE(S) OF OPERATION
                        FL                                                        IL, MO                                                         TN                            MI

Note: Store count as of 9/30/20; excludes nine Dunkin’ locations, two standalone Subway locations, as well as 36 additional stores carrying
banners with less than ten locations across network including one banner acquired in 2019. Excludes 84 retail sites acquired from Empire on
10/6/2020.
Empire Petroleum: Highly Strategic Combination that Meaningfully
                                                                                                                                                                                                                                         27
            Increases Company Scale
                                 EMPIRE COMPANY OVERVIEW                                                                                               ARKO HISTORICAL TOTAL FUEL VOLUME
                                                                                                                              (gallons in millions)

                1,537                                                             23
                                                                                                                                                                             Arko                      Empire
                                                                                                                              2,400
                                                                                                                                                                                                                       (3)       1,956
                                                                                                                              1,800                                                                      Acquired
                                                                                                                                                                                                         Volume                  986
  Total Stores Operated and/or             Supplied(1)                     Acquisitions Since 2011
                                                                                                                              1,200

             Top 10                                                  1.0 Billion                                                600

                                                                                                                                   0
                                                                                                                                                 685                   872
                                                                                                                                                                                               1,053            1,108            969

              Super-Jobbers(2) In the U.S.                           Fuel Gallons Distributed in 2020                                            '16                   '17                     '18               '19         Pro Forma '20

                                                                                              TRANSFORMATIVE TRANSACTION

            Announced: 12/17/19                                                                 BENEFITS TO COMBINATION
            Closed: 10/6/20
            Purchase Price: $353 million(4)
            Multiple Paid: 7.6x EBITDA (pre-synergies)
            Materially increased footprint (10 new states of operation & D.C.)
            Further diversified ARKO’s cash flow and provided ARKO with a scaled wholesale platform
            ARKO expects to achieve significant synergies from the transaction moving forward
            Enhanced ARKO’s competitiveness as an acquiror
            Empire’s wholesale volume in FY 2020 was 872M gallons of which approximately 83% is sold on a rack plus basis and
             the remaining 17% is sold on a consignment basis

(1)       Empire store count at closing (as of 10/6/20).
(2)       Per management estimates; super-jobbers defined as fuel distributors with volumes greater than 1 billion gallons annually and significant scale with multiple major oil companies.
(3)       Includes ‘Q1 – ‘Q3 2020 contribution of Empire in addition to ARKO’s FY2020 results.
(4)       Excludes five year deferred payment of $20.0 million and potential post-closing contingent amounts of up to an additional $45 million.
Large, Growing, Recession-Resistant Industry                                                                                                                                            28

                                                                                      U.S. IN-STORE C-STORE SALES VS. U.S. CONSUMPTION INDEX
                                                                                                         Strong c-store sales growth during Great Recession
ATTRACTIVE INDUSTRY DYNAMICS:                                                 6.0%
                                                                                                                                                     4.9%

 Strong fundamentals                                                         4.0%                   3.2%
                                                                                                                         2.8%
 Large, mature industry
                                                                              2.0%

 Consistent industry-wide sales and profitability
  growth; acquiring share from other retail channels                          0.0%
                                                                                                                 2008                                        2009

 Stable industry store count                                                 -2.0%
                                                                                                           In-Store C-Store Sales Growth            U.S. PCE Growth
                                                                                                                                                                      -1.3%

 Highly fragmented                                                                       U.S. CONVENIENCE STORE IN-STORE SALES OVER TIME
                                                                                ($ in billions)
 Recession-resistant                                                          $275
                                                                                                        Industry has grown at a 3.4% CAGR over the last 12 years                 $252
                                                                                                                                                                          $242
 Minimal impact of Covid-19 (net beneficial to                                $250
                                                                                                                                                    $226
                                                                                                                                                            $233 $237

  ARKO)                                                                        $225                                                          $214
                                                                                                                                      $204
                                                                                                                         $195 $199
                                                                                                                  $190
 Perpetual value of convenience                                               $200
                                                                                                  $174
                                                                                                          $182
                                                                                         $169
                                                                               $175
 Historically adaptable in the face of headwinds
                                                                               $150
                                                                                           '07    '08      '09     '10   '11    '12   '13    '14     '15    '16     '17   '18    '19

Source: EIA, Department of Transportation, and Bureau of Economic Analysis.
Note: PCE = Personal Consumption Expenditures.
Reconciliation of ARKO GAAP Net Income to Adjusted EBITDA, Net of
                                                                                                                                                                                                                                                  29
 Incremental Bonuses
                 ($ in millions)                                                                                                                                                  FY 2020                          FY 2019
                 Net income (loss)                                                                                                                                                  $30.1                           ($47.2)
                 Interest and other financing expenses, net                                                                                                                           50.4                            41.8
                 Income tax (benefit) expense                                                                                                                                         (1.5)                             6.2
                 Depreciation and amortization                                                                                                                                        74.4                            62.4
                   EBITDA                                                                                                                                                          $153.4                            $63.2
                 Non-cash rent expense (a)                                                                                                                                             7.1                              7.6
                 Acquisition costs (b)                                                                                                                                                 6.0                              6.4
                 Gain on bargain purchase (c)                                                                                                                                              -                           (0.4)
                 Loss (gain) on disposal of assets and impairment charges (d)                                                                                                          6.1                             (1.2)
                 Share-based compensation expense (e)                                                                                                                                  1.9                              0.5
                 Loss from equity investee (f)                                                                                                                                         1.3                              0.5
                 Non-beneficial cost related to potential initial public offering of master limited partnership (g)                                                                        -                            0.1
                 Settlement of pension fund claim (h)                                                                                                                                      -                            0.2
                 Merchandising optimization costs (i)                                                                                                                                      -                            1.0
                 Fuel taxes paid in arrears (j)                                                                                                                                        0.8                                 -
                 Other (k)                                                                                                                                                            (1.0)                             0.3
                   Adjusted EBITDA                                                                                                                                                 $175.6                            $78.2
                 Incremental bonuses (l)                                                                                                                                               7.8                                 -
                   Adjusted EBITDA, net of incremental bonuses                                                                                                                     $183.4                            $78.2

a)   Eliminates the non-cash portion of rent, which reflects the extent to which our GAAP rent expense recognized         e)   Eliminates non-cash share-based compensation expense related to the equity incentive program in place to
     exceeds (or is less than) our cash rent payments. The GAAP rent expense adjustment can vary depending on the              incentivize, retain, and motivate our employees and officers.
     terms of our lease portfolio, which has been impacted by our recent acquisitions. For newer leases, our rent         f)   Eliminates our share of loss attributable to our unconsolidated equity investment
     expense recognized typically exceeds our cash rent payments, while for more mature leases, rent expense              g)   Eliminates non-beneficial cost related to potential initial public offering of master limited partnership.
     recognized is typically less than our cash rent payments.                                                            h)   Eliminates the impact of mainly timing differences related to amounts paid in settlement of a pension fund claim
b)   Eliminates costs incurred that are directly attributable to historical business acquisitions and salaries of              filed against GPM.
     employees whose primary job function is to execute our acquisition strategy and facilitate integration of acquired i)     Eliminates the one-time expense associated with our global merchandising optimization efforts in 2019.
     operations.                                                                                                          j)   Eliminates the payment of historical fuel tax liabilities owed for multiple prior periods.
c)   Eliminates the gain on bargain purchase recognized as a result of the Town Star acquisition in 2019.                 k)   Eliminates other unusual or non-recurring items that we do not consider to be meaningful in assessing operating
d)   Eliminates the non-cash loss (gain) from the sale of property and equipment, the gain recognized upon the sale of         performance.
     related leased assets, including $6.0 million related to the sale of eight stores in 2019, and impairment charges on l)   Eliminates incremental bonuses based on 2020 performance.
     property and equipment and right-of-use assets related to closed and non-performing stores.
Reconciliation of ARKO GAAP Net Income to Adjusted EBITDA   30
You can also read