Investor Presentation - EXPANDING OUR REACH EXTENDING OUR CAPABILITIES EXPLORING NEW OPPORTUNITIES - SmartCentres
←
→
Page content transcription
If your browser does not render page correctly, please read the page content below
EXPANDING OUR REACH
EXTENDING OUR CAPABILITIES
EXPLORING NEW OPPORTUNITIES

                             Investor Presentation
                                  Based on Fourth Quarter 2015
                                         February 2016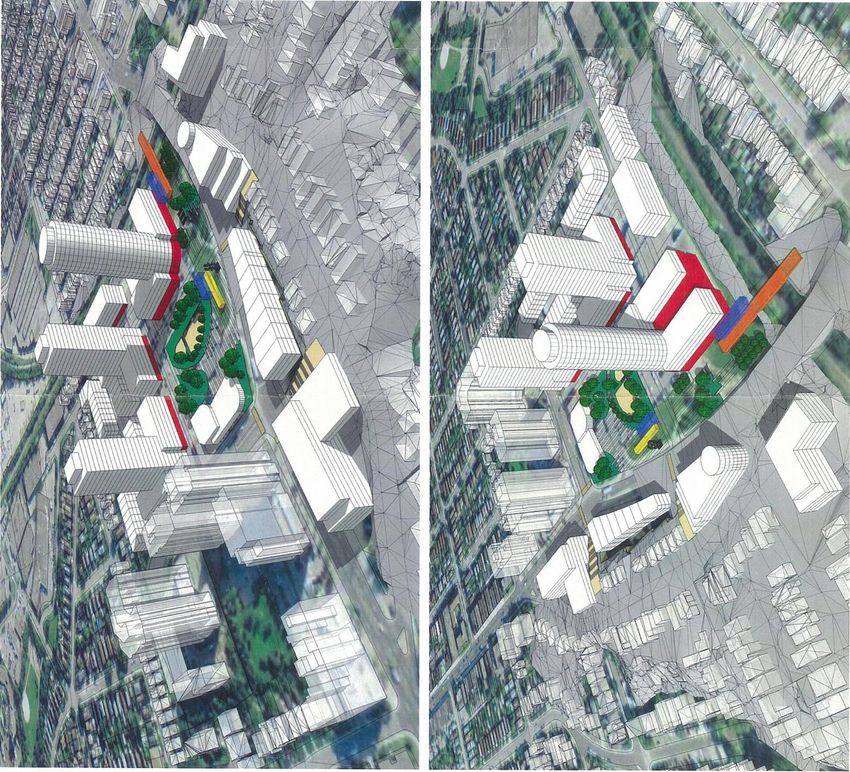
Notice to Reader

            Readers are cautioned that certain terms used in this Investor Presentation (“Presentation”) such as Funds from
            Operations ("FFO"), Adjusted Funds from Operations ("AFFO"), "Gross Book Value", "Payout Ratio", "Interest
            Coverage", "Total Debt to Adjusted EBITDA" and any related per Unit amounts used by management to measure,
            compare and explain the operating results and financial performance of the Trust do not have any standardized
            meaning prescribed under IFRS and, therefore, should not be construed as alternatives to net income or cash flow
            from operating activities calculated in accordance with IFRS. These terms are defined in this Presentation and
            reconciled to the consolidated financial information of the Trust in the Management’s Discussion and Analysis
            (“MD&A”) for the year ended December 31, 2015. Such terms do not have a standardized meaning prescribed by
            IFRS and may not be comparable to similarly titled measures presented by other publicly traded entities.

            Certain statements in this Presentation are "forward-looking statements" that reflect management's expectations
            regarding the Trust's future growth, results of operations, performance and business prospects and opportunities.
            More specifically, certain statements contained in this Presentation, including statements related to the Trust's
            maintenance of productive capacity, estimated future development plans and costs, view of term mortgage renewals
            including rates and upfinancing amounts, timing of future payments of obligations, intentions to secure additional
            financing and potential financing sources, and vacancy and leasing assumptions, and statements that contain words
            such as "could", "should", "can", "anticipate", "expect", "believe", "will", "may" and similar expressions and
            statements relating to matters that are not historical facts, constitute "forward-looking statements". These forward-
            looking statements are presented for the purpose of assisting the Trust's Unitholders and financial analysts in
            understanding the Trust's operating environment, and may not be appropriate for other purposes. Such forward-
            looking statements reflect management's current beliefs and are based on information currently available to
            management. However, such forward-looking statements involve significant risks and uncertainties. A number of
            factors could cause actual results to differ materially from the results discussed in the forward-looking statements.
            Although the forward-looking statements contained in this Presentation are based on what management believes to
            be reasonable assumptions, the Trust cannot assure investors that actual results will be consistent with these
            forward-looking statements. The forward-looking statements contained herein are expressly qualified in their entirety
            by this cautionary statement. These forward-looking statements are made as at the date of this Presentation and the
            Trust assumes no obligation to update or revise them to reflect new events or circumstances unless otherwise
            required by applicable securities legislation.

SmartREIT                                                                                                                           2
Vision

       Creating Exceptional Places to Shop and Work

SmartREIT                                             3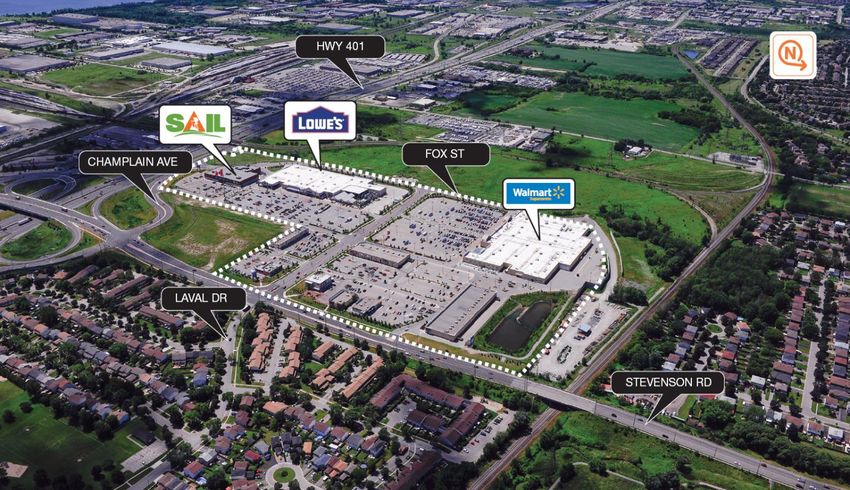
Smart Real Estate Investment Trust
One of Canada’s premier REITs
$4.8 billion equity capitalization
(unit price of $31.16 as of February 9, 2016)
$8.5 billion total asset value
139 shopping centres across Canada
31.1 million square feet of owned GLA
72% of our properties are anchored by Walmart
SmartREIT 4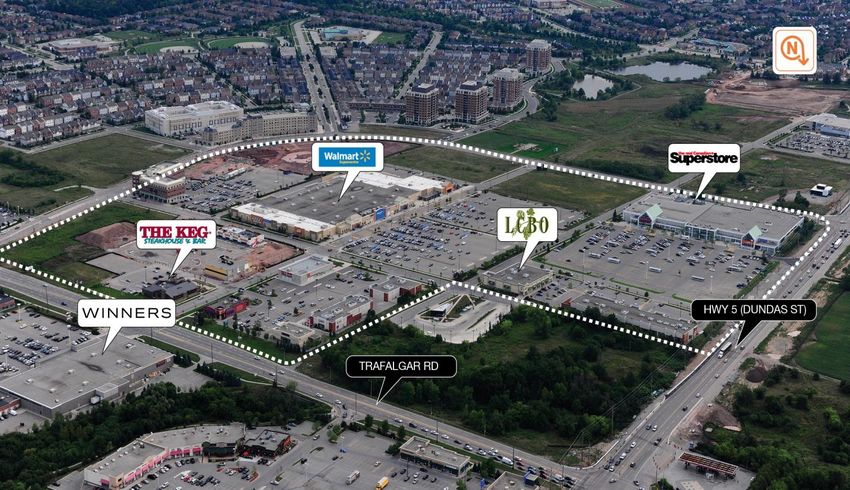
2015 - Solid Performance
98.7% occupancy
Portfolio increased in value by $1.4 billion to $8.5
billion over 2014
FFO per unit increased by 7.7% over 2014
2015 tenant retention of 75% at an average rental
increase of 6.6%
Montreal Premium Outlets opened to strong
consumer response and construction of the first
phase of the Vaughan Metropolitan Centre now
largely complete
SmartREIT 5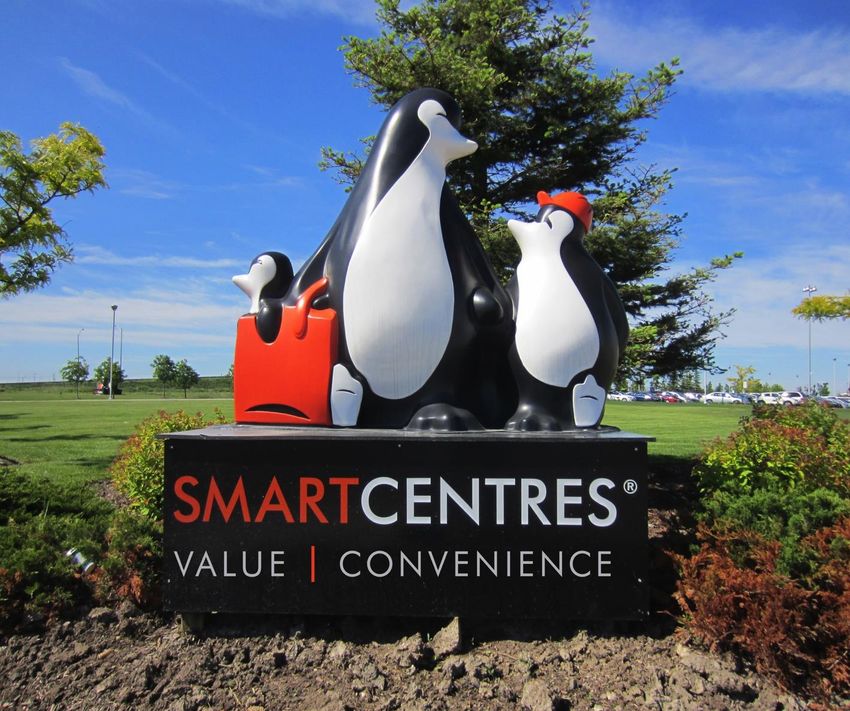
2015 - Solid Performance

                                        Dec. 31,   Dec. 31,
                                          2015       2014     Change
            FFO / unit                    $2.10      $1.95     +7.7%
            AFFO / unit                   $1.99      $1.84     +8.2%
            Payout ratio                 81.1%      84.7%      -3.6%
            Debt to Aggregate Assets     44.7%      42.8%      +1.9%
            Liquidity: Cash Resources   $345.1M    $323.5M     +6.7%
            Unencumbered Asset Pool       $2.5B      $2.4B     +4.2%
            Debt to Adjusted EBITDA        8.4X       7.4X    +13.5%
            Interest Coverage              3.0X       2.7X    +11.1%

SmartREIT                                                              6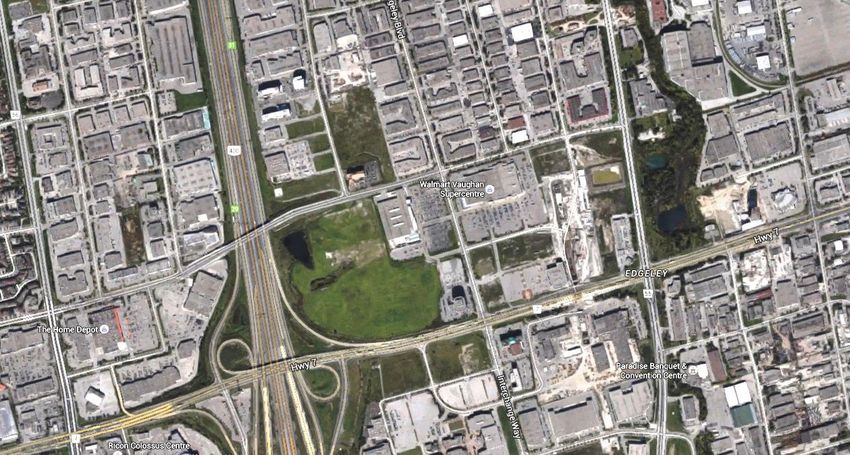
Growth in Total Assets
39.8% CAGR since 2002
Total Assets
(in millions of $)
8,505
7,070 7,107
6,480
5,956
4,194 4,237 4,374
3,894
3,584
2,564
1,015
109 229
2002 2003 2004 2005 2006 2007 2008 2009 2010 2011 2012 2013 2014 2015
SmartREIT 7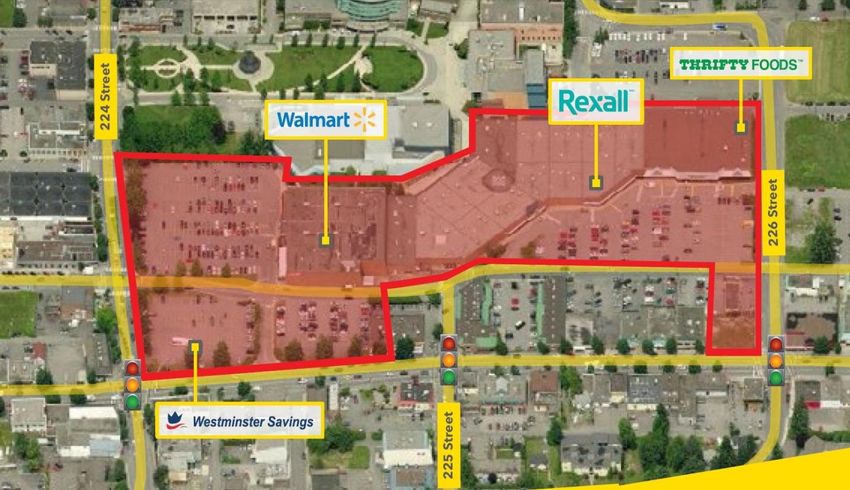
Total Return to Unitholders
17.3% average annual return since IPO
$1,000
$900
$814.60
$800
$700
$600
$500
$400
$348.10
$300
$289.50
$200
$100
$0
Nov-02 Nov-03 Nov-04 Nov-05 Nov-06 Nov-07 Nov-08 Nov-09 Nov-10 Nov-11 Nov-12 Nov-13 Nov-14 Nov-15
Smart REIT S&P/TSX Capped REIT Index S&P/TSX Index
SmartREIT 8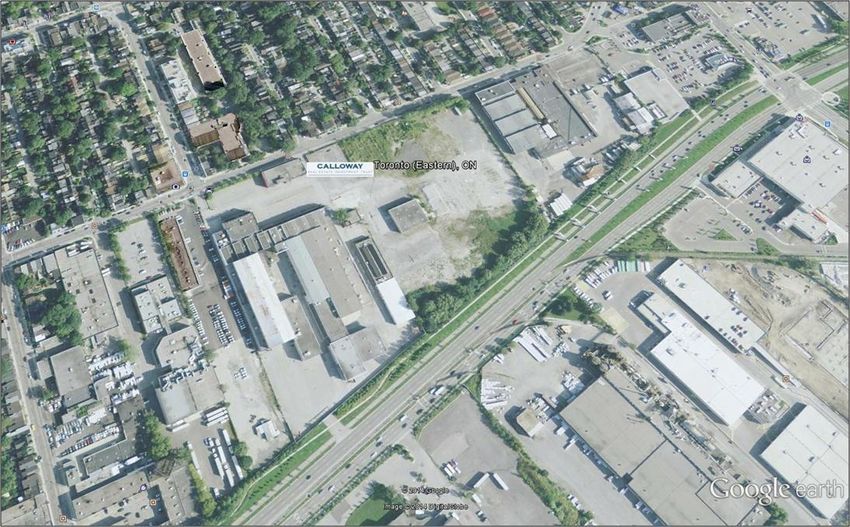
Growth in AFFO / Unit
6.2% CAGR since 2003
AFFO / Unit
1.99
1.84
1.71 1.75
1.66 1.70
1.65
1.56 1.57 1.54
1.44
1.29
0.97
2003 2004 2005 2006 2007 2008 2009 2010 2011 2012 2013 2014 2015
SmartREIT 9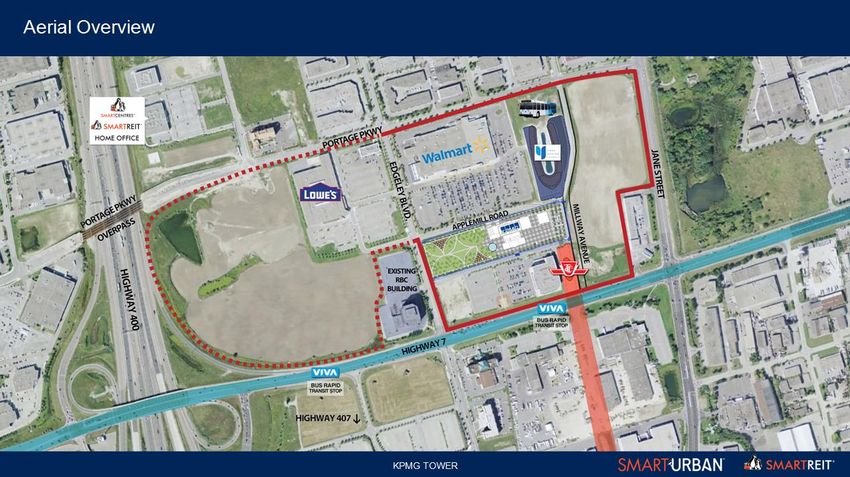
What Makes SmartREIT Strong
The capabilities of our team
The quality of our portfolio
The quality of our tenants
Our strategic relationships
Our healthy balance sheet
SmartREIT 10The Capabilities of our Team
Integrated team of approximately 300 employees
The most experienced retail development team in
Canada
50 million square feet and in excess of 170 centres
developed and built over the last 20 years
Very experienced and capable leasing, and
operations groups
Exceptional support organization
SmartREIT 11SmartREIT’s Portfolio
31.1 million square feet of shopping centre space
Average age: 12 years (youngest in the industry)
Low capital expenditures
Coast to coast locations
84% are urban or near urban markets
Virtually 100% of sites contain both a food store and a
pharmacy, either in a Walmart store or independently
Strong value orientation
Results in high degree of stability:
98.7% occupancy as at December 31
Average occupancy of 99.1% since 2005
SmartREIT 12SmartREIT’s Portfolio
139 Properties*
31.1 million square feet*
Alberta Manitoba
7 3
Saskatchewan Quebec
BC 4 21
13 Atlantic
Ontario 10
81
* Excludes 3 redevelopment properties and 8
development lands totalling 1.4 million square feet upon
completion and an additional 3.5 million square feet of
development density associated with existing centres
72% of our sites are Walmart anchored or shadow-anchored (85%
by total area)
High % of the portfolio focused in Ontario, Quebec and BC, which
are Canada’s fastest growing provinces
SmartREIT 13Stable Cash Flow
AFFO Payout Ratio
Distribution fully funded from
operating cashflow
94.0% 90.3% 88.6% 84.7% 81.1% Efficient capital allocation
Efficient and transparent
distribution
2011 2012 2013 2014 2015
$ per unit
FFO 1.70 1.79 1.85 1.95 2.10
AFFO 1.65 1.71 1.75 1.84 1.99
Distributions 1.55 1.55 1.55 1.56 1.61
Management and the Board have endorsed a target payout range of 77% to 82% as of
February 2016
Management expects the payout ratio to remain in the high 70% to low 80% range
Annual distribution increased in 2014 to $1.60 from $1.55, representing a 3.4% increase,
with a further increase in October 2015 to $1.65, representing a 3.125% increase
SmartREIT 14SmartREIT’s Tenant Base
72% of our sites are Walmart anchored or
shadow-anchored (85% by total area)
92% of our tenants are national
Our top ten tenants generate 50% of our
revenue
Adding exciting new tenants all the time
Results in:
75% tenant retention as for 2015 renewals,
representing 1.1 million square feet
6.6% average rental uplifts
SmartREIT 15Well Tenanted, High Quality Portfolio
The following table illustrates the top ten tenants for SmartREIT’s Property
Portfolio as at December 31, 2015, in terms of their percentage contribution to
gross rental revenues of SmartREIT’s Portfolio:
Average
% of Gross DBRS Credit
Tenant Number of Stores Remaining
Rental Revenues Rating
Lease Term
Walmart 94 26.9 8.8 AA
Canadian Tire, Mark's and FGL Sports 69 4.7 6.7 BBB (high)
Winners, Homesense and Marshalls 43 3.6 5.8
Reitmans 109 2.5 3.3
Best Buy 27 2.3 3.2
Loblaw and Shoppers Drug Mart 19 2.3 6.9 BBB
Sobeys 15 2.2 6.6 BBB (low)
RONA 7 2.0 7.6 BB (high)
Michaels 24 1.6 4.8
Staples 23 1.4 2.9
Total 49.5 7.7
SmartREIT 16Best-in-class Stable Occupancy
99.1% average occupancy since 2005
Occupancy
99.2% 99.3% 99.3% 99.2%
98.9% 99.1% 99.0% 99.0% 99.0% 99.0% 98.7%
97.9% 97.8%
96.4%
2002 2003 2004 2005 2006 2007 2008 2009 2010 2011 2012 2013 2014 2015
SmartREIT 17Stable Income Base
Average lease term of 6.9 years
Average remaining lease term of 8.8 years for Walmart, with multiple renewal options
of up to 80 years
Average remaining lease term excluding Walmart is 5.4 years
2015 average retention rate at 75% and lifts on renewals of 6.6%
Average “same property” NOI growth is 1.0% to 1.5% p.a.
Lease Maturity by Area
(in millions of square feet)
2.3 3.1 3.1 2.8 3.1 2.6
1.9 1.9
1.2 1.4
0.3 0.4
2016 2017 2018 2019 2020 2021 2022 2023 2024 2025 Month- Vacant
to-month
Average roll of 2.2 million square feet annually (7.2% of total GLA per year)
SmartREIT 18Transformation Transforming into a leading, fully-integrated REIT with best-in-class capabilities SmartREIT 19
Transformational SmartCentres Acquisition Positions
            SmartREIT for Growth

                                      Transaction Highlights
                                      1. Acquired a large, high quality
                                         portfolio of real estate

                                      2. Created a fully-integrated real
                                         estate platform

                                      3. Provides enhanced growth
                                         opportunities

SmartREIT                                                                  20
Transformation of Calloway into SmartREIT
1 2
Calloway Then SmartREIT Now
1. 27.4M square feet of GLA 1. 31.1M square feet of GLA
2. 129 properties 2. 150 properties
3. 98.6% occupancy 3. 98.7% occupancy
4. Weighted average lease term 6.7 years 4. Weighted average lease term 6.9 years
5. 2.7M square feet of potential 5. 5.0M square feet of potential retail
retail development2 development3
6. $7.2B of Total Assets 6. $8.5B of Total Assets
7. Best-in-class internal property and 7. Fully-integrated property, asset development
asset management capabilities and leasing management capability
8. New Brand – Calloway rebranded itself
SmartREIT, trading under a new ticker:
SRU.UN, and leveraging SmartCentres’
considerable brand equity and our new
combined strengths
1 As of March 31, 2015
2 As of December 31, 2015
3 Excludes development opportunities with Mezzanine loans
SmartREIT 21Financing of Transaction
Purchase price within formal valuation range
Approximately $645.5 million of assumed debt at
a weighted average interest rate of 2.5%
Issuance of $174.2 million in Class B LP units of
SmartREIT subsidiary partnerships to certain
vendors, exchangeable for REIT units on a one-
for-one basis
Net proceeds from an offering of $230 million of
subscription receipts in a bought-deal financing
Remainder financed by cash on hand
SmartREIT 22Acquisition Involved a Large, High Quality Real Estate
Portfolio
Acquisition Properties SmartREIT GLA at Share
Province % Acquired Occupancy Major Tenants1
Shopping Centres (SF 000s)
Future
In Place Development Total
Earnout
Alliston SmartCentre ON 100% 171 165 --- 336 100% Walmart Supercentre, Dollarama, Tim Hortons
Aurora North SmartCentre2 ON 50%2 249 --- 8 257 100% Walmart Supercentre, RONA, Best Buy, Golf Town, LCBO
Blainville SmartCentre QC 100% 176 39 --- 215 100% Walmart Supercentre, Dollarama, Bulk Barn, BNS, RBC
Bracebridge SmartCentre ON 100% 142 62 --- 204 100% Walmart Supercentre, Dollar Tree, Boston Pizza, Bulk Barn
Bradford SmartCentre ON 100% 238 184 --- 422 100% Walmart Supercentre, GoodLife Fitness, Dollarama, CIBC
Bramport SmartCentre (II) ON 100% 38 --- --- 38 100% No Frills
Brampton Northeast SmartCentre ON 100% 210 48 --- 258 100% Walmart Supercentre, GoodLife Fitness, LCBO, CIBC
Cornwall SmartCentre ON 100% 164 32 --- 196 100% Walmart Supercentre, Dollar Tree
Laval Centre SmartCentre QC 100% 160 102 --- 262 100% Walmart Supercentre
Markham East SmartCentre ON 40% 69 --- 69 138 100% Walmart Supercentre, Dollar Tree, CIBC
Mascouche North SmartCentre QC 100% 51 61 --- 112 100% Jean Coutu, Structube, McDonald’s, Bulk Barn
Mississauga (Go Lands) SmartCentre ON 50%3 56 --- 3 59 100% Toys R Us, Marshalls, Dollarama
Montreal Premium Outlet (Mirabel) QC 25%4 91 --- 25 116 90% Hudson’s Bay Outlet, Polo, Old Navy, Nike
Oakville SmartCentre ON 100%5 445 --- 110 555 100% Walmart Supercentre, Loblaws, CIBC, The Beer Store
Oshawa North SmartCentre (II) ON 100% 160 --- 20 180 100% Home Outfitters, Winners, PetSmart, Party Packagers
Oshawa South SmartCentre ON 50%2 268 --- 9 277 100% Walmart Supercentre, Lowe’s, Sail, CIBC, Dollarama
Port Elgin SmartCentre ON 100% 116 --- --- 116 100% Walmart Supercentre
Stoney Creek SmartCentre ON 100% 263 100 --- 363 100% Walmart Supercentre, Toys R Us, Dollar Tree, CIBC
Sylvan Lake SmartCentre AB 100% 125 125 --- 250 100% Walmart Supercentre, Dollarama
Vaudreuil SmartCentre QC 100% 15 39 --- 54 100% Brunet, Coco Fruitti
Vaughan Northwest SmartCentre ON 100% 163 344 --- 507 100% Walmart Supercentre, CIBC
Waterloo SmartCentre ON 100% 181 76 --- 257 100% Walmart Supercentre, Value Village, Mark’s, Dollarama
Total - Shopping Centres 3,551 1,376 244 5,172 99.7%
Note: Data as at March 31, 2015. (1) Includes committed leases. (2) SmartREIT previously held a 50% leasehold interest in this property. Following the Transaction, SmartREIT owns a 50% freehold interest and
continues to have an option to acquire the remaining 50% freehold interest at the end of the term of the existing lease. (3) Following the Transaction, SmartREIT owns 100% of this property as it previously owned
the other 50%. (4) Following the Transaction, SmartREIT owns 50% of this property as it previously owned a 25% interest. (5) SmartREIT entered into a lease for this property with an option to acquire the
freehold interest at the end of the lease term. (6) Development Properties expected to close 12-24 months post initial closing.
SmartREIT 23Governance Rights and Non-Compete Agreement
Reflective of Mitchell Goldhar’s significant ownership position and his ongoing relationship with the REIT, certain governance rights of Mitchell
Goldhar and related entities (“MG Entities”) have been amended and extended, and he has entered into a non-compete agreement.
Provision Description
Pre-Transaction Right to appoint Trustees based on the following ownership levels: Ownership >= 5%: appoint 1 Trustee, max. Trustees 8; Ownership >= 15%:
Trustee appoint 2 Trustees, max. Trustees 8; and Ownership >= 25%: appoint 3 Trustees, max. Trustees 9
Appointment
Post-Transaction Ownership thresholds extended to include holdings of Mitchell Goldhar and MG entities
Pre-Transaction Right to vote 25% of votes at a meeting of unitholders to July 1, 2015, as long as Mitchell Goldhar owns the lesser of (i) 20 million Units or (ii)
20% of the Units
Voting Top-up
Right Post-Transaction Expiry extended to July 1, 2020
Ownership extended from Mitchell Goldhar to include MG Entities
20 million Units must represent at least 10% of the outstanding Units
Pre-Transaction NA
Special
Committee Post-Transaction So long as MG Entities own 5% of the Units, until his death Mitchell Goldhar will have the right to appoint 1 member of any special committee
reviewing strategic transactions where MG Entities are not an interested party
Pre-Transaction NA
Board of Post-Transaction Until the earlier of July 1, 2025 or MG Entities no longer owning 10% of the Units, Mitchell Goldhar has the right to be the Non-Executive
Trustees Chair Chairman
If Mitchell Goldhar is the Non-Executive Chairman, the Board will elect a Lead Independent Trustee
Pre-Transaction Mitchell Goldhar has the right to appoint 1 member as long as he owns 15% of Units
Corporate
Governance and Post-Transaction Committee has right to appoint and remove the Chief Operating Officer (“COO”) and Chief Development Officer (“CDO”)
Compensation From closing until the earlier of (i) 5 years post closing; (ii) MG Entities owning less than 10% of the Units; or (iii) Mitchell Goldhar’s death
Committee All decisions require unanimous approval
MG Entities have the right to appoint 1 member of the Committee
Demand & Pre-Transaction NA
Registration
Rights Post-Transaction As long as MG Entities own 10% or more they will have Demand; Piggy-Back; and Pre-Emptive Rights
Pre-Transaction NA
Post-Transaction Later of 3 years post closing or the Voting Top-up Right no longer being applicable. Contains exclusions for certain minority and passive
Non-Compete investments or if SmartREIT does not exercise first right below.
Effectively limits Mitchell Goldhar from acquiring new retail assets of a similar nature to SmartREIT's. Mitchell Goldhar must first offer
SmartREIT the opportunity to purchase them (subject to certain exclusions relating to OneREIT and other existing investments).
Note: The above table sets forth a summary of highlights of the rights and non-compete agreement for Mitchell Goldhar. For comprehensive information on these matters and other rights not
summarized above, please refer to the Management Information Circular posted to Sedar. MG Entities include Mitchell Goldhar, his family members, their spouses, his heirs and executors and
their affiliates and other entities such as trusts established for the benefit of those referred to prior.
SmartREIT 24Strategic Relationships
Walmart
Mitchell Goldhar
Simon Property Group
Investors Group
SmartREIT 25Strategic Relationship - Walmart Canada
Walmart Canada Number of Walmart Stores
attributes
Value pricing and fresh
food generates huge
traffic 198
288
Other
Dominant retailer Shadow
14 SmartREIT
Has benefited from the 11
88 94
closure of Target
76% of Canadians live Supercentres Total Walmart
(297)* Stores (396)*
within 10 km of a Walmart * Company source as at February 9, 2016
SmartREIT 26Strategic Relationship - Mitchell Goldhar
JV Partner
Vaughan Metropolitan Centre
StudioCentre Site
Salmon Arm
Consultant on mixed use projects
Board Chair, Trustee and Investment Committee
member
Ad hoc advice and council on shopping centre
portfolio
Multiple on-going business relationships as
service provider
SmartREIT 27Strategic Relationship - Simon Property Group
Largest public real estate company in the U.S.
Engaged primarily in retail real estate properties
including regional malls, Premium Outlets and
The Mills®
Exceptional relationships with the world’s largest
retailers
Canada is part of a continuing global expansion
SmartREIT 28Strategic Relationship - Investors Group (“IG”)
One of Canada’s largest financial services
companies with $120 billion under management
SmartREIT has jointly acquired properties
with IG from SmartCentres in the past
SmartREIT is continuing to look for joint
acquisition and development properties
SmartREIT will also look for additional ways
to work with IG to leverage our new combined
capabilities
SmartREIT 29Our Balance Sheet is Strong
Unencumbered pool at $2.5 billion
Ready access to mortgage and unsecured debt
capital when needed
Key ratios improving
Payout ratio declined to 81.1% in 2015, within
updated target range of 77% to 82%
Renewing interest rates much lower than
maturing rates
Our focus over the last year has been to move
towards secured financing, but we will continue
to access the unsecured market as appropriate
SmartREIT 30Debt Maturity / Leverage
Debt Maturity
(in millions of $)
4.6%
4.4% 4.3% 4.3%
4.2% 4.2%
3.9%
3.7% 3.7%
3.4%
90 100 3.1% 160
150 150
0 200
150 150
0
0
146 240 334 337 115 121 225 146 25 325 90
2016 2017 2018 2019 2020 2021 2022 2023 2024 2025 Thereafter
Secured Debt Unsecured Debentures Average Int. Rate
Lower interest costs on refinancing available with 10 year unsecured rates around 4% and secured rates well
below that
Interest Coverage: 3.0X Target: 2.5 - 2.75X
Debt to EBITDA: 8.4X Target: 7.25 - 7.5X
Debt to GBV: 52.2% Target: 50 - 60% long-term trend to continue to de-lever
Unencumbered pool: $2.5 billion (2.1X) Target: 1.5X unsecured coverage
Weighted Avg Interest Rate (Secured Debt): 3.87%
Weighted Avg Term to Maturity (Secured Debt): 5.7 yrs
DBRS rating of BBB with a Stable trend
SmartREIT 31Leverage Profile
Dec. 31 Dec. 31 Dec. 31
2013 2014 2015
Debt to Aggregate Assets 43.8% 42.8% 44.7%(1)
Secured Debt to Aggregate Assets 28.1% 24.7% 31.2%(2)
Unencumbered Assets $1.5B $2.4B $2.5B
Debt to Adjusted EBITDA 8.1X 7.4X 8.4X(1)
Interest Coverage 2.5X 2.7X 3.0X
Liquidity: Cash Resources $338M $324M $345M
Weighted Average Interest Rate(3) 5.17% 5.03% 3.87%
Weighted Average Term to Maturity(3) 5.5 yrs 5.3 yrs 5.4 yrs
(1) Leverage increased in support of the transformative SmartCentres Platform transaction
(2) Significant rate spread between unsecured and secured debt led management to increase
secured debt financing during 2015
(3) Secured Debt
SmartREIT 32Conservative Capital Structure
Total Enterprise Value – $8.7 Billion
Secured Mortgage Financing
30.3% Amount - $2.6 billion
Weighted Avg Interest Rate – 3.87%
Weighted Avg Term to Maturity – 5.4 years
Unsecured Debentures Focused on:
13.4% Amount - $1.2 billion
Weighted Avg Interest Rate – 3.94% Lowering interest rates on renewals
Weighted Avg Term to Maturity – 5.4 years
Maintaining maximum flexibility
Equity
55.8% Units Outstanding – 154 million Reducing leverage over time
Share Price – $31.16 as at Feb. 9, 2016
Market Capitalization – $4.8 billion
Operating Lines / Outstanding LC’s
0.5% Operating Line – $10 million
Letters of Credit – $29 million
SmartREIT 33SmartREIT’s Key Challenges and Opportunities
Our core platform has great stability, resulting in
inherent growth in same property income of 1%
to 1.5%
Over time, our cost of capital is expected to climb
as interest rates rise
Acquisition supply is slowing, with more
competitive bidding from pension funds and
other institutions
We needed to diversify our income sources to
manage risk
SmartREIT 34Key Growth Principles We Are Following
Growth will come from a wide variety of areas
Risk management will be a key consideration as
we allocate capital
We will take a reasoned and disciplined
approach for the long term
We will continue to work with key partners to
drive growth
SmartREIT 35SmartREIT’s Growth Drivers
1. Unique portfolio of department store-anchored
value-focused retailers
Improve organic same property growth
above 1%
2. Retail intensification of approximately 310,000
square feet in existing portfolio
Place Bourassa
South Oakville
Other sites to be identified
SmartREIT 36SmartREIT’s Growth Drivers (cont’d)
3. Premium Outlet Malls
Value oriented sites, principally in fashion
segment
Market dynamics currently very supportive
4. Internal Growth Pipeline
Approximately 5.0 million square feet of
future development and earnouts across
multiple sites
SmartREIT 37SmartREIT’s Growth Drivers (cont’d)
5. Vaughan Metropolitan Centre
GTA’s largest future mixed used
development
6. Other mixed use opportunities identified and
moving through the zoning process
SmartREIT 38SmartREIT’s Growth Drivers (cont’d)
7. Walmart JV
SmartREIT has stepped into SmartCentres’
role to provide planning, development,
leasing and other services to Walmart in
Canada
SmartCentres has built over 170 shopping
centres over the last 20 years and we expect
to continue that business into the future
We are at the very early stages of exploring
opportunities in the US market with Walmart
SmartREIT 39SmartREIT’s Growth Drivers (cont’d)
8. Platform Leverage
Over and above the various development
opportunities noted, we have acquired the
most experienced retail development
platform in Canada. We will be looking for
third party development and redevelopment
opportunities to maximize the platform
capabilities
SmartREIT 40Greater Toronto Area
Key development area for SmartREIT
1
2
4
3
1. Vaughan Metropolitan Centre
2. Westside Mall
3. StudioCentre
4. Toronto Premium Outlets
SmartREIT 41Premium Outlets
Toronto Premium Outlets (Halton Hills)
JV with Simon Property Group
500,000 SF when all phases are completed
Phase I opened August 1, 2013
Stabilized yield will be in the double digits
Montreal Premium Outlets (Mirabel)
JV with Simon Property Group
Phase I – 350,000 SF
Opened October 30, 2014
Additional 75 acres of potential retail development
adjacent to the site
Actively sourcing other locations
SmartREIT 42Premium Outlets SmartREIT 43
Vaughan Metropolitan Centre (“VMC”)
A long term build (10 – 15 years)
A 50:50 JV between SmartREIT and SmartCentres
Potential density of 6 million square feet of residential,
office and retail development
First development completed – KPMG tower complex
with 365,000 SF of LEED Gold space, opening in 2016
Second office tower at the Letter of Intent stage with two
key tenants in the commercial and community areas
Subway extension to open in 2017 – now fully funded
and updated schedule in place
Exceptional opportunity to develop a new city centre for
one of Canada’s fastest growing communities
SmartREIT 44VMC - Pedestrian Tunnel Connections SmartREIT 45
VMC Today: Under Construction

SmartREIT                                   46
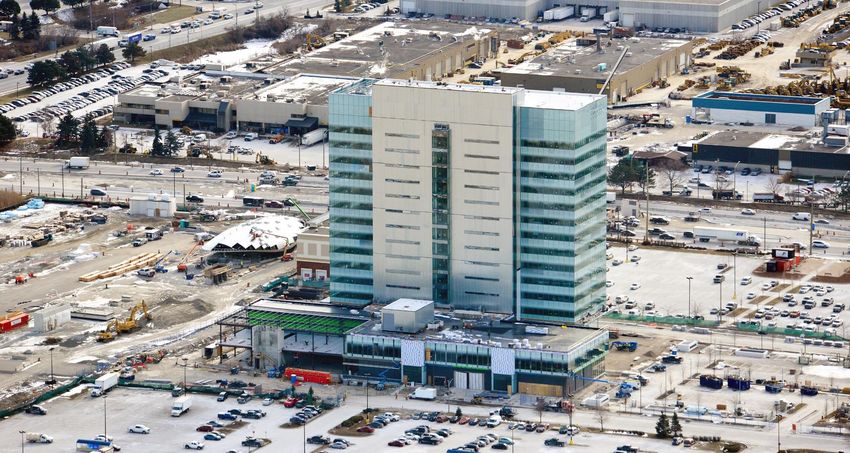
VMC Today: Under Construction

  Construction of the KPMG Tower: nearly complete

SmartREIT                                           47
VMC - Aerial

SmartREIT                  48
VMC – Major Construction Projects in Vicinity

SmartREIT                                                   49
VMC - Rapid Transit to Downtown Toronto

SmartREIT                                             50
VMC - TTC Subway Extension

SmartREIT                                51
Additional Mixed Use Potential Opportunities
StudioCentre (Lakeshore Boulevard East)
1.2 million square foot site owned jointly with
SmartCentres
Received council approval in November 2015 relating
to the rezoning application
Westside Mall Toronto (Eglinton and Caledonia)
Shopping centre redevelopment leveraging new LRT
station
South Keys Ottawa
Redevelopment of shopping centre leveraging new
transit hub
Hwy 7 & Hwy 400 (Vaughan)
Redevelopment of current shopping centre site to
leverage proximity of Vaughan Metropolitan Centre
Various other sites under investigation
SmartREIT 52StudioCentre SmartREIT 53
StudioCentre

  Architect’s rendering of potential new site layout

SmartREIT                                              54
StudioCentre

SmartREIT                  55
StudioCentre
StudioCentre is a brownfield
location next to Toronto’s eastern
waterfront. A former industrial site,
today it is an underutilized film
production centre
SmartREIT and SmartCentres
intend to revitalize the centre,
adding new production, office, and
retail opportunities
A rezoning exercise is underway,
seeking right to build 1.2 million
square feet at the centre. Approval
from the City of Toronto was
received in November 2015
Leasing activity for new media
businesses has already started –
over 30,000 square feet leased for
2015
SmartREIT 56Westside Mall Toronto
Current density - 143,800
square feet
City of Toronto proposed
density for site: 4.5x coverage =
approximately 2.15 million
square feet
Buildings height of up to 33
storeys
LRT to open by 2020;
construction well underway.
Tunnel boring is complete in
front of the centre. Station
construction not yet started
Zoning and approvals will be a
lengthy process
Architect’s rendering of potential intensification site plan
SmartREIT 57Other Issues We Are Monitoring
In the coming years, retailers’ businesses will be affected
by:
E-commerce
Aging population
Urbanization and the move to more convenient
shopping
Changing ethnic mix of population
We will continue to monitor the impact of these issues
and will adjust our business model accordingly, always
remembering:
The quality of our sites
The value we provide our tenants
The strength and capabilities of our partners
SmartREIT 58E-commerce Responses
Penguin Pick-Up:
Initiative driven by SmartCentres
Convenient locations for consumers to pick up
products ordered online
Drives traffic to shopping centres and supports
tenants
Five SmartREIT locations currently part of the
initiative
Piloting free Wi-Fi at select Western Canadian sites
Launching digital signage at select locations
Further initiatives in the planning stage
SmartREIT 59The Best Offense Starts With a Strong Defense -
SmartREIT
Best-in-Class Portfolio
Newest retail portfolio amongst all Canadian peers.
84% located in urban or near urban locations, with
strong national tenants as anchors
Strong Financial Position
Strong balance sheet and strong credit metrics.
Growing unencumbered pool provides increased
financial flexibility. Access to multiple sources of
capital
Growth Prospects Increasing, particularly after acquisition
Portfolio of growth opportunities from smaller local
intensification to Vaughan Metropolitan Centre,
amongst Canada’s largest potential mixed use
developments
SmartREIT 60Appendix SmartREIT 61
July 2015 Acquisition – Haney Place Mall

                              Address: 11900 Haney Place, Maple Ridge, BC

                              Major Intersection: Lougheed Highway & 224th street

                              Site Area: 227,000 square feet

                              Occupancy: 97%

                              Major Tenants: Walmart Supercentre, Thrifty Foods, Dollar Tree,
                                            Rexall Pharmacy, Westminster Savings

SmartREIT                                                                                       62
SmartCentres Acquisition - Oakville SmartCentre
Address: 234 Hays Boulevard, Oakville, ON
Major Intersection: Highway 5 & Trafalgar Road
Site Area: 445,000 square feet
Occupancy: 100%
Major Tenants: Walmart Supercentre, Real Canadian Superstore
(Loblaws), LCBO, CIBC
SmartREIT 63SmartCentres Acquisition - Oshawa South SmartCentre
Address: 680 Laval Drive, Oshawa, ON
Major Intersection: Stevenson Road & Laval Drive
Site Area: 540,000 square feet
Occupancy: 100%
Major Tenants: Walmart Supercentre, Lowe’s, Sail, CIBC
SmartREIT 64You can also read