Nonspectroscopic imaging for quantitative chlorophyll sensing
←
→
Page content transcription
If your browser does not render page correctly, please read the page content below
Nonspectroscopic imaging for
                 quantitative chlorophyll sensing

                 Taehoon Kim
                 Jeong-Im Kim
                 Michelle A. Visbal-Onufrak
                 Clint Chapple
                 Young L. Kim

Downloaded From: https://www.spiedigitallibrary.org/journals/Journal-of-Biomedical-Optics on 10 Mar 2021
Terms of Use: https://www.spiedigitallibrary.org/terms-of-use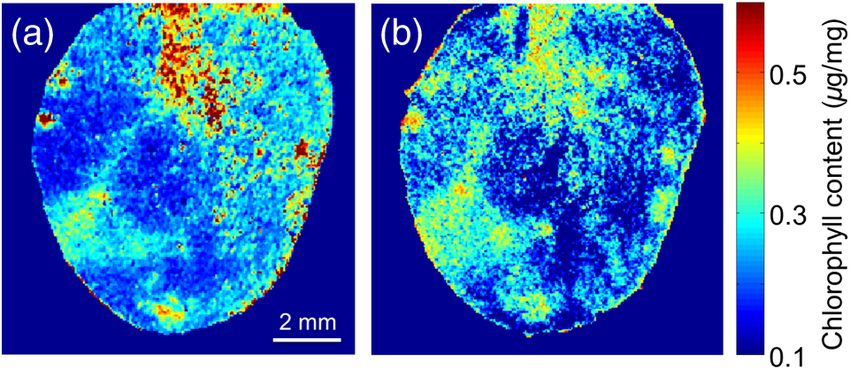
Journal of Biomedical Optics 21(1), 016008 (January 2016)

                Nonspectroscopic imaging for quantitative
                chlorophyll sensing
                Taehoon Kim,a Jeong-Im Kim,b Michelle A. Visbal-Onufrak,a Clint Chapple,b and Young L. Kima,c,*
                a
                  Purdue University, Weldon School of Biomedical Engineering, 206 South Martin Jischke Drive, West Lafayette, Indiana 47907, United States
                b
                  Purdue University, Department of Biochemistry, 175 South University Street, West Lafayette, Indiana 47907, United States
                c
                  Kyung Hee University, Department of Computer Science and Engineering, 1732, Deogyeong-daero, Yongin 17104, Republic of Korea

                              Abstract. Nondestructive imaging of physiological changes in plants has been intensively used as an invaluable
                              tool for visualizing heterogeneous responses to various types of abiotic and biotic stress. However, conventional
                              approaches often have intrinsic limitations for quantitative analyses, requiring bulky and expensive optical
                              instruments for capturing full spectral information. We report a spectrometerless (or spectrometer-free) reflec-
                              tance imaging method that allows for nondestructive and quantitative chlorophyll imaging in individual leaves
                              in situ in a handheld device format. The combination of a handheld-type imaging system and a hyperspectral
                              reconstruction algorithm from an RGB camera offers simple instrumentation and operation while avoiding the
                              use of an imaging spectrograph or tunable color filter. This platform could potentially be integrated into a com-
                              pact, inexpensive, and portable system, while being of great value in high-throughput phenotyping facilities and
                              laboratory settings. © 2016 Society of Photo-Optical Instrumentation Engineers (SPIE) [DOI: 10.1117/1.JBO.21.1.016008]
                              Keywords: spectrometer-free; spectrometerless; hyperspectral; multispectral; label-free imaging.
                              Paper 150763R received Nov. 11, 2015; accepted for publication Dec. 10, 2015; published online Jan. 20, 2016.

                1     Introduction                                                                 excitation source as well as quenching of fluorescence. Thus, it
                Abiotic and biotic stress (e.g., drought, nutrient deficiency, tem-                would not be straightforward to obtain an absolute value of
                perature, and pathogen attack) impact plant growth and develop-                    chlorophyll content when different instruments for detecting
                ment, eventually influencing crop yield.1 Thus, it is critical to                  chlorophyll fluorescence are utilized. As a result, fluorescence
                                                                                                   signals in plants often serve as a proxy measure or an indirect
                assess stress symptoms during early alteration stages before irre-
                                                                                                   indicator of photosynthesis. On the other hand, reflectance mea-
                versible damage and yield loss occur.2 In addition, as transgenic
                                                                                                   surements are based on elastic light scattering and absorption, in
                and conventional plant breeding strategies seek to continue to
                                                                                                   which the wavelength is not changed by the scattering or absorp-
                improve plant input and output traits, researchers in laboratory
                                                                                                   tion processes without energy conversion. In this respect, reflec-
                and industry settings often require quantitative plant phenotyp-
                                                                                                   tance-based approaches could potentially provide simple and
                ing technologies for specific selection of pathogen-resistant,
                                                                                                   reliable quantification of chlorophyll content while resolving
                stress-tolerant, and high-yielding plants.3 Indeed, there is a
                                                                                                   its spatial heterogeneity.
                strong need for plant imaging technologies that nondestructively
                                                                                                       For label-free imaging, conventional hyperspectral imaging
                and quantitatively visualize stress traits in situ. Importantly,
                                                                                                   systems rely on the use of a mechanical filter wheel, an imaging
                alterations in chlorophyll content are one of the key symptoms
                                                                                                   spectrograph, or a liquid crystal tunable filter, all of which
                that plants display under stresses as a major component of
                                                                                                   limit the development of simple, compact, and cost-effective
                photosynthesis.3
                                                                                                   systems. To build compact and affordable systems for wide-
                    There are a few methods currently available for quantifying
                                                                                                   spread utilization, it would be desirable to realize a spectrome-
                chlorophyll content. Since subtle alterations in chlorophyll are
                                                                                                   terless (or spectrometer-free) imaging system. Such a system
                not visible until they reach a certain level, destructive biochemi-
                                                                                                   can be implemented by utilizing an algorithm that can reliably
                cal analyses serve as the gold standard. Optical meters, which
                                                                                                   reconstruct full spectral information from RGB image data,
                quantify chlorophyll content as spot measurements, are also                        which are easily acquired by commonly used three-color
                used as an advanced method, given the nondestructive nature                        CCD (or CMOS) cameras. Fortunately, several methods for
                of the technologies.4 However, these methods provide chloro-                       spectral reconstruction with RGB data have been studied exten-
                phyll content in a single spot area, lacking the information                       sively.8–10 Thus, hyperspectral reconstruction approaches using
                on spatial distribution. In this respect, fluorescent imaging of                   RGB data could potentially lead to simplicity for instrumenta-
                chlorophyll has received considerable attention as a nondestruc-                   tion and operation without using bulky and expensive color
                tive imaging method.5–7 Indeed, chlorophyll fluorescence imag-                     filters and spectrometers.
                ing serves as a valuable tool for quantifying leaf photosynthetic                      In this study, we report that a spectrometerless reflectance
                efficiency. On the other hand, quantitative assessment of abso-                    imaging method can map out the detailed spatial distributions
                lute chlorophyll content using chlorophyll fluorescence is often                   of chlorophyll content in individual leaves in situ in a handheld
                limited, because fluorescent signals depend on measurement                         device format. First, we confirm that reflectance spectral pat-
                parameters, including the duration (e.g., continuous or pulsed)                    terns correlate with chlorophyll content in leaves assessed by
                and the bandwidth (e.g., laser or incoherent light source) of the                  biochemical analyses. Initially, we utilize a laboratory system

                *Address all correspondence to: Young L. Kim, E-mail: youngkim@purdue.edu          1083-3668/2016/$25.00 © 2016 SPIE

                Journal of Biomedical Optics                                              016008-1                                         January 2016   •   Vol. 21(1)

Downloaded From: https://www.spiedigitallibrary.org/journals/Journal-of-Biomedical-Optics on 10 Mar 2021
Terms of Use: https://www.spiedigitallibrary.org/terms-of-use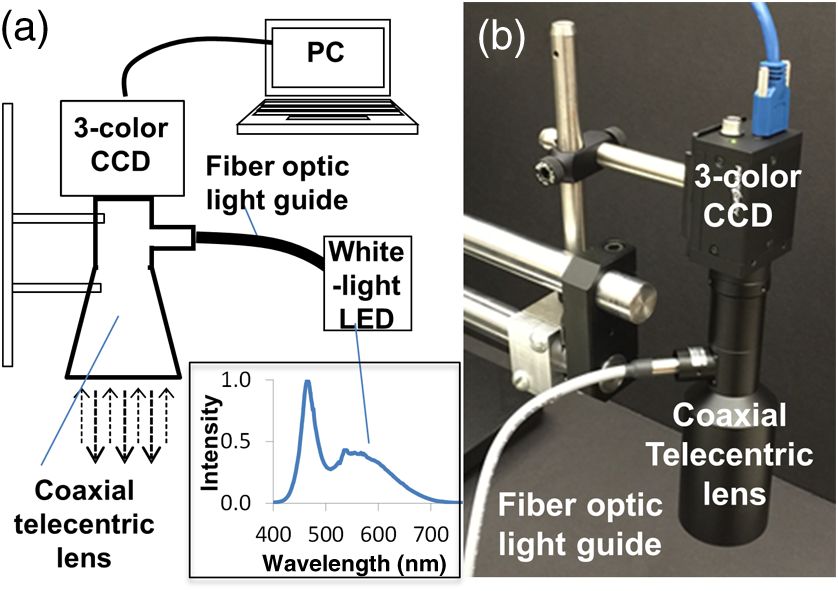
Kim et al.: Nonspectroscopic imaging for quantitative chlorophyll sensing

                coupled with an imaging spectrograph with a high spectral res-                     a reflectance reference standard (Labsphere, North Sutton,
                olution for obtaining a full reflectance spectrum in each ðx; yÞ                   New Hampshire) on the sample stage, a reference intensity
                location. As a testing model, Arabidopsis thaliana is used. We                     matrix rreference ðx; y; λÞ was measured. Because the reflectance
                also measure the total chlorophyll content in each sample using                    reference standard had flat spectral and uniform spatial
                conventional biochemical assays. Second, we conduct numeri-                        responses in the entire visible range, rreference ðx; y; λÞ captured
                cal experiments for extracting chlorophyll content without using                   the entire system responses. Third, rspecimen ðx; y; λÞ was normal-
                hyperspectral imaging data. We implement a hyperspectral                           ized by rreference ðx; y; λÞ such that
                reconstruction algorithm that reliably reconstructs the full spec-
                tral information in plant leaves from RGB data. Third, we test                                                                        rspecimen ðx; y; λÞ − rbackground ðx; y; λÞ
                                                                                                                                       rðx; y; λÞ ¼                                                :             (1)
                a handheld-type spectrometerless imaging system consisting of                                                                         rreference ðx; y; λÞ − rbackground ðx; y; λÞ
                                                                                                   EQ-TARGET;temp:intralink-;e001;326;675

                a three-color CCD camera and a white-light light-emitting diode
                (LED) as a detector and a light source, respectively. Finally, we                  Thus, the resultant intensity matrix rðx; y; λÞ was mainly deter-
                demonstrate detailed chlorophyll imaging in a whole leaf by                        mined by the scattering and absorption properties of the sample,
                acquiring RGB data only, without using an imaging spectro-                         without being affected by the system responses, including the
                graph, in a pilot testing study.                                                   light source or the camera.

                2     Materials and Methods                                                        2.3                                       Spectrometerless Imaging System Using
                                                                                                                                             a Three-Color CCD
                2.1     Plant Models and Biochemical Assays for
                        Chlorophyll Quantitation                                                   A working prototype of the spectrometerless hyperspectral
                                                                                                   imaging system was also constructed, as shown in Fig. 1. To
                A series of 24 leaf samples from A. thaliana, a well-known                         directly use a hyperspectral reconstruction algorithm trained
                model plant, were utilized for covering a wide range of total                      using the laboratory system, it was important to minimize
                chlorophyll content from 0.17 to 1.68 μg∕mg. A. thaliana eco-                      any spectral variations resulting from different illumination
                type Col-0 was cultivated at a light intensity of 100 μE m−2 s−1                   and detection configurations.15 Thus, the illumination and detec-
                at 22 °C under a photoperiod of 16-h light/ 8-h dark. Rosette                      tion configurations of the laboratory system were mimicked in
                leaves were detached from 4-week-old plants, were incubated                        the prototype system. In particular, a telecentric lens with
                in a solution of 3-mM MES (2-[N-morpholino]ethanesulfonic                          coaxial illumination (magnification of 0.3×, Schott Moritex,
                acid) at pH 5.7, and were kept under dark for up to 6 days.                        Japan) allowed us to image the light scattered from the sample
                For conventional biochemical assays, we extracted chlorophyll                      in the exact backward direction with respect to the incident
                with 95% ethyl alcohol after incubating the samples at 70 °C                       light, acting as back-directional angular gating in the reflection
                for 1 h. Then, absorbance at 665 and 649 nm was measured                           mode.17 A white-light LED (0.315 0 0 LED Spot Light, Edmund
                using a UV/visible spectrophotometer. Finally, total chlorophyll                   Optics, Barrington, New Jersey) was coupled to the telecentric
                content (i.e., chlorophyll a and chlorophyll b) was calculated in                  lens via a fiber-optic light guide and was illuminated onto the
                the unit of μg∕mg (i.e., chlorophyll/fresh weight) as previously                   plant sample. The light reflected from the sample was collected
                described.11                                                                       using the same telecentric lens mounted with a three-color CCD
                                                                                                   (Color Grasshopper3, Point Grey Research, Richmond, British
                2.2     Laboratory Hyperspectral Imaging System                                    Columbia). The system had a field of view of 70 mm × 60 mm
                                                                                                   with a pixel size of 56 μm. Similarly to the hyperspectral
                For obtaining experimental spectra from leaf samples, our                          measurements, an RGB intensity matrix was normalized by
                recently developed system described elsewhere was used.12–14                       a reference signal from the reflectance reference standard to
                This system allowed us to acquire a matrix of reflectance inten-                   compensate for the spectral and spatial responses of the entire
                sity (also known as a hypercube) rðx; y; λÞ as a function of the                   system, including the light source, the fiber-optic light guide, the
                position ðx; yÞ and the wavelength λ of light. The specification                   telecentric lens, and the CCD camera. Thus, it should also be
                included a transverse resolution of ∼100 μm with a field of view
                of 15 × 15 mm2 , an imaging depth of ∼1 mm, and a spectral
                range of 400 to 770 nm with a spectral resolution of 2 nm.
                A back-directional (angular) filtering scheme in the detection
                part collected the light reflected from the sample within a narrow
                solid angle in the exact backward direction. Importantly,
                this configuration avoided spectral variations originating from
                different systems, because reflectance spectra, in particular
                scattering components, are highly sensitive to illumination and
                detection geometries.15 It should be noted that this aspect is
                crucial to apply a hyperspectral image reconstruction algorithm,
                trained by hyperspectral data obtained from the laboratory sys-
                tem, to a spectrometerless imaging system.
                    To remove the stray background light and to compensate for
                the system responses, the following procedures were imple-
                mented:13,16 First, after the acquisition of a raw intensity matrix
                from the sample rspecimen ðx; y; λÞ, a background intensity matrix                 Fig. 1 (a) Schematic diagram of the spectrometerless hyperspectral
                rbackground ðx; y; λÞ without the sample was measured and then                     imaging system. Inset: Spectral profile of the white-light LED.
                subtracted from the raw intensity matrix. Second, by placing                       (b) Photograph of the current working prototype.

                Journal of Biomedical Optics                                              016008-2                                                                                  January 2016       •   Vol. 21(1)

Downloaded From: https://www.spiedigitallibrary.org/journals/Journal-of-Biomedical-Optics on 10 Mar 2021
Terms of Use: https://www.spiedigitallibrary.org/terms-of-use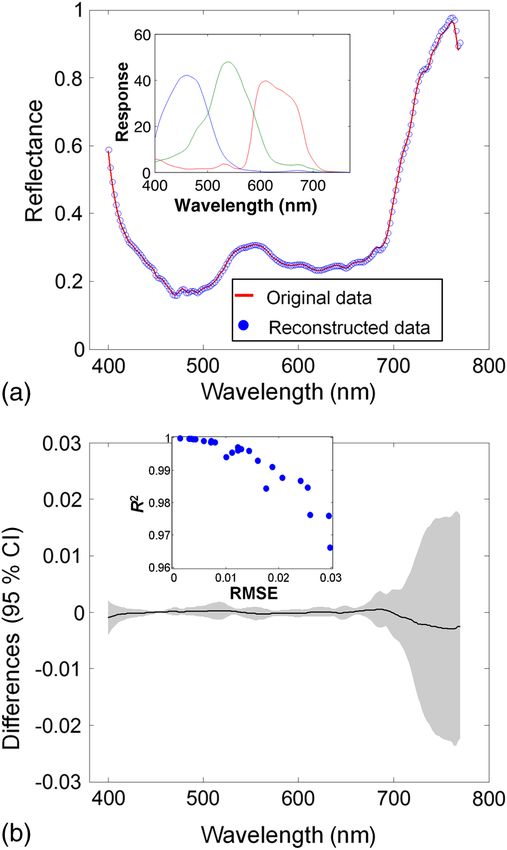
Kim et al.: Nonspectroscopic imaging for quantitative chlorophyll sensing

                noted that this resultant intensity matrix was relatively indepen-
                dent of the spectral responses of the light source and the camera.

                2.4                                        Reconstruction of Hyperspectral Image Data
                                                           from RGB Data
                The relationship between a full reflectance spectrum and an
                RGB reflectance spectrum in each ðx; yÞ position can be mod-
                eled such that8–10
                                                    x3×1 ¼ S3×N rN×1 þ e3×1 ;
                EQ-TARGET;temp:intralink-;e002;63;656                                                         (2)
                where x is a 3 × 1 vector that has RGB intensities, S is a 3 × N
                matrix of the spectral responses of the three-color camera sensor,
                r is an N × 1 vector that has the reflectance intensity normalized
                by the reflectance standard, and e is a 3 × 1 vector of system
                noise with zero mean. N indicates the number of wavelengths.
                In our case, N ¼ 186 from 400 to 770 nm with an interval of                                             Fig. 2 Correlation between the spectral index SI for chlorophyll con-
                2 nm. In general, S can be obtained from the sensor manufac-                                            tent and the biochemical assays. The solid line is a linear regress fit
                turer or estimated mathematically from training color sam-                                              and the dotted lines are 95% confidence intervals.
                ples.18,19 Then, the problem to reconstruct a full spectrum
                from an RGB spectrum is to solve the following question:                                                where rðλÞ is the reflectance intensity at λ given an ðx; yÞ posi-
                “Would it be possible to compute or estimate r given S and                                              tion. We note that this approach has not yet been used for
                x are known?” In fact, Eq. (2) can be considered as a system                                            detailed visualization of chlorophyll content in individual
                of linear equation. However, since the dimension of S is                                                leaves, in part because of the lack of appropriate hyperspectral
                a 3 × N, an infinite number of solutions of r can exist to                                              systems, although this has been widely used in canopy and
                satisfy Eq. (2). Fortunately, several methods and techniques for                                        remote sensing measurements. Second, we validated the corre-
                reconstructing full spectra from RGB data have been studied                                             lation between SI and chlorophyll content, when the reflectance
                extensively, such as Wiener estimation8–10,20–22 and regression                                         spectra from the entire leaves were averaged and the total
                methods.23–25                                                                                           chlorophyll content was measured with the biochemical assays.
                    Suppose that a reflectance spectrum r and a corresponding                                           Indeed, Fig. 2 shows that the p-value of the slope estimate of
                RGB spectrum x are collected for each sample. Then, R^ m×N and                                          linear regression between SI and chlorophyll content is
Kim et al.: Nonspectroscopic imaging for quantitative chlorophyll sensing
3.2 Reconstruction of Reflectance Image Data The overall performance of the reconstruction method was
Using RGB Data validated utilizing a leave-one-out cross-validation method
with all of the plant samples (m ¼ 24). In this validation,
We computationally implemented a hyperspectral reconstruc- each round of cross-validation used 23 spectra as a training
tion algorithm that can reliably predict detailed spectral infor- set to reconstruct a full spectrum from the RGB data, and a
mation from RGB data. Among several different reconstruction total of 24 rounds were performed. The accuracy of the recon-
methods, we chose polynomial multivariate regression, described structed spectral information was evaluated using goodness-of-
in Sec. 2.4, for reconstructing reflectance spectra for optimal fit metrics [i.e., coefficient of determination R2 and root
performance. To generate a conversion matrix T in Eq. (3), we mean square error (RMSE)]. Given the relatively small sample
imaged 24 A. thaliana leaf samples as follows: first, because of size, leave-one-out cross-validation was a reasonable validation
the relatively small sample size (m ¼ 24), we used the entire method for avoiding over-fitting. It should be noted that
data set for training. To build a model for reconstructing reflec- reconstruction models were built using only the training data
tance spectra using RGB data, an RGB camera response x was set. The representative spectra in Fig. 4(a) show that a full reflec-
expressed in terms of r and S in Eq. (2). We obtained S from tance spectrum can be reliably reconstructed from the RGB data,
the manufacturer (Sony ICX625) that was used in the handheld compared to the original hyperspectral data. To estimate errors
system [inset in Fig. 4(a)]. Second, we determined a conversion of the hyperspectral reconstruction method, we further analyzed
matrix T by applying multivariate polynomial regression in differences between the original reflectance spectra and the
Eq. (3). Finally, we computed a reconstructed reflectance estimated spectra in the entire wavelength range. Figure 4(b)
spectrum r^ for a new RGB spectrum. In this step, to determine shows 95% confidence intervals for mean differences between
the best polynomial degree, x was varied such that x ¼ the original reflectance spectra and the estimated spectra. As
ð1; x1 ; x2 ; x3 ; x21 ; x22 ; x23 Þ for second-order polynomial regression, expected, the wavelength regions around 400 nm and above
which provided reliable performance in our plant hyperspectral 700 nm have wider confidence intervals because of the limited
image data. spectral range of the RGB channel of the camera, as shown in
the inset of Fig. 4(a). After including all of the samples with
second-order polynomial multivariate regression, the average
RMSE of cross-validation from 24 samples was 0.013
(min ¼ 0.001 and max ¼ 0.030) and the average adjusted R2
was 0.99 (min ¼ 0.966 and max ¼ 0.999), as shown in the
inset of Fig. 4(b). This numerical evaluation supports the fea-
sibility that chlorophyll content can be sensitively and accu-
rately predicted using the three-color sensor-based system.
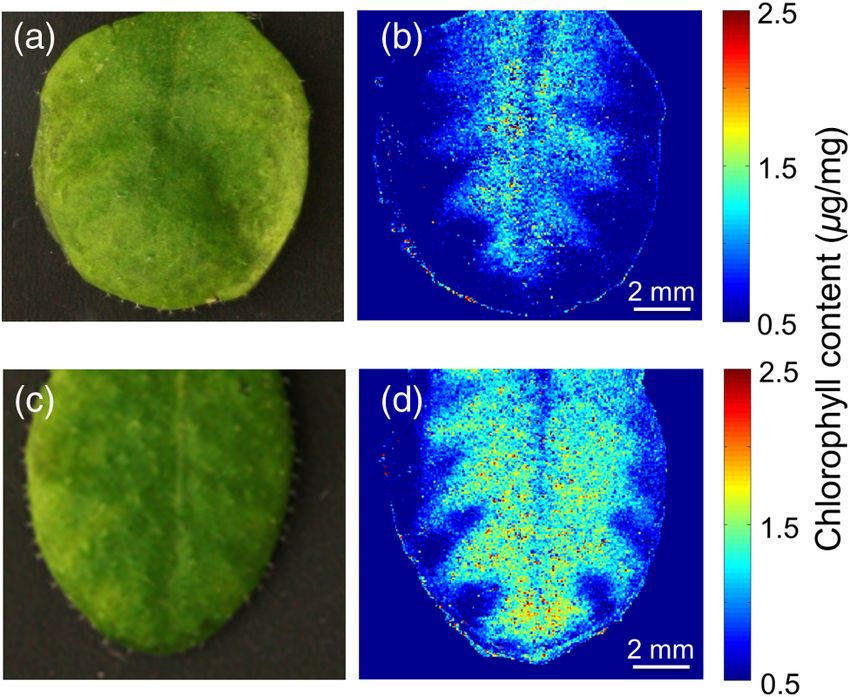
3.3 Spectrometerless Chlorophyll Imaging
As a pilot test, we acquired hyperspectral image data and RGB
image data from Arabidopsis samples in a sequential manner.
After the samples were imaged using the original laboratory im-
aging system (with the imaging spectrograph), the identical sam-
ples were also imaged using the handheld prototype system with
the three-color CCD. Figures 5(a) and 5(b) depict representative
chlorophyll images from the original hyperspectral imaging
system and the prototype spectrometerless system, respectively.
We compared the spatial distribution patterns of chlorophyll
content Iðx; yÞhyperspectral and Iðx; yÞspectrometerless obtained from
the laboratory hyperspectral system and the spectrometerless
system. Specifically, we calculated a two-dimensional (2-D) cor-
relation coefficient C2-D , which is defined as
Fig. 4 (a) Reconstruction of full spectral information from RGB data.
Representative comparison between an original reflectance spectrum
obtained from the laboratory hyperspectral system and a recon-
structed one from RGB data. Inset: Spectral response of the three-
color CCD camera. (b) 95% confidence intervals of mean differences Fig. 5 (a) and (b) Chlorophyll images generated by the laboratory
(dark line) between the original reflectance spectra and the estimated hyperspectral system and the current prototype system with the
spectra at each wavelength. Inset: Goodness-of-fit metrics from all of three-color CCD camera using the hyperspectral reconstruction,
the plant samples using the leave-one-out cross-validation method. respectively.
Journal of Biomedical Optics 016008-4 January 2016 • Vol. 21(1)
Downloaded From: https://www.spiedigitallibrary.org/journals/Journal-of-Biomedical-Optics on 10 Mar 2021
Terms of Use: https://www.spiedigitallibrary.org/terms-of-useKim et al.: Nonspectroscopic imaging for quantitative chlorophyll sensing
P P
y ðI − I hyperspectral ÞðI spectrometerless − I spectrometerless Þ
hyperspectral
x
C2-D ¼ sffiffiffiffiffiffiffiffiffiffiffiffiffiffiffiffiffiffiffiffiffiffiffiffiffiffiffiffiffiffiffiffiffiffiffiffiffiffiffiffiffiffiffiffiffiffiffiffiffiffiffiffiffiffiffiffiffiffiffiffiffiffiffiffiffiffiffiffiffiffiffiffiffiffiffiffiffiffiffiffiffiffiffiffiffiffiffiffiffiffiffiffiffiffiffiffiffiffiffiffiffiffiffiffiffiffiffiffiffiffiffiffiffiffiffiffiffiffiffiffiffiffiffiffiffiffiffiffiffiffiffiffiffiffiffiffiffiffiffiffiffiffiffiffi
ffi : (5)
P P hyperspectral P P spectrometerless
EQ-TARGET;temp:intralink-;e005;63;740
hyperspectral 2 spectrometerless 2
ðI −I Þ ðI −I Þ
x y x y
A calculated C2-D in this specific case was 0.93, support- 7. L. A. Spomer, M. A. L. Smith, and J. S. Sawwan, “Rapid, nondestruc-
tive measurement of chlorophyll content in leaves with nonuniform
ing the strong similarity of spectrometerless chlorophyll chlorophyll distribution,” Photosynth. Res. 16(3), 277–284 (1988).
imaging. We note that the subtle discrepancy in the 8. S. Chen and Q. Liu, “Modified Wiener estimation of diffuse reflectance
two chlorophyll images originated from rapid dehydration spectra from RGB values by the synthesis of new colors for tissue
in detached leaves, because the data acquisition time of measurements,” J. Biomed. Opt. 17(3), 030501 (2012).
9. I. Nishidate et al., “Noninvasive imaging of human skin hemodynamics
the original system was relatively slow (∼10 min). In using a digital red–green–blue camera,” J. Biomed. Opt. 16(8), 086012
addition, the exact validation of the hyperspectral recon- (2011).
struction algorithm was challenging, because the two sys- 10. H.-L. Shen, J. H. Xin, and S.-J. Shao, “Improved reflectance recon-
tems had different pixel sizes and imaging areas, and the struction for multispectral imaging by combining different techniques,”
Opt. Express 15(9), 5531–5536 (2007).
sample orientation to the system was not the same. Thus, a 11. H. K. Lichtenthaler, “Chlorophylls and carotenoids—pigments of pho-
next-generation integrated imaging system would produce tosynthetic biomembranes,” Methods Enzymol. 148, 350–382 (1987).
more reliable comparisons. Overall, this pilot test demon- 12. R. L. Konger et al., “Spatiotemporal assessments of dermal hyperemia
strates that the working prototype of the spectrometerless enable accurate prediction of experimental cutaneous carcinogenesis as
well as chemopreventive activity,” Cancer Res. 73(1), 150–159 (2013).
imaging system has the potential for detailed spatial and 13. Z. Xu et al., “Back-directional gated spectroscopic imaging for diffuse
high-temporal imaging of chlorophyll content. light suppression in high anisotropic media and its preclinical applica-
tions for microvascular imaging,” IEEE J. Sel. Top. Quantum Electron.
16(4), 815–823 (2010).
4 Conclusion 14. Z. Xu et al., “Spectroscopic visualization of nanoscale deformation
This study demonstrates that the proposed spectrometerless in bone: interaction of light with partially disordered nanostructure,”
imaging method is capable of nondestructive and quantitative J. Biomed. Opt. 15(6), 060503 (2010).
in situ imaging of chlorophyll content. A reliable spectrometer- 15. S. C. Gebhart, S. K. Majumder, and A. Mahadevan-Jansen,
“Comparison of spectral variation from spectroscopy to spectral imag-
less (or spectrometer-free) hyperspectral imaging system was
ing,” Appl. Opt. 46(8), 1343–1360 (2007).
developed using a commonly used three-color CCD (or CMOS) 16. Y. L. Kim et al., “Simultaneous measurement of angular and spectral
camera. Detailed spatial distribution of chlorophyll content in properties of light scattering for characterization of tissue microarchi-
a whole leaf was successfully visualized with a high correlation tecture and its alteration in early precancer,” IEEE J. Sel. Top.
between the reflectance spectra pattern and the chlorophyll Quantum Electron. 9(2), 243–256 (2003).
content. Although our hyperspectral reconstruction is currently 17. J. H. Moore et al., Building Scientific Apparatus, University Printing
applicable for Arabidopsis samples, due to the Arabidopsis- House, Cambridge, United Kingdom (2009).
18. K. Barnard and B. Funt, “Camera characterization for color research,”
based model training, future systematic studies will allow us Color Res. Appl. 27(3), 153–164 (2002).
to image other type of plants and crops as well as various pig- 19. H.-L. Shen and J. H. Xin, “Spectral characterization of a color
ments besides chlorophyll (e.g., anthocyanin and carotenoid). scanner by adaptive estimation,” J. Opt. Soc. Am. A 21(7), 1125–1130
This capability of imaging multiple stress traits would help to (2004).
deepen our understanding of stress and coping mechanisms in 20. Y. Murakami et al., “Color reproduction from low-SNR multispectral
plants. Further, this prototype could potentially serve as a plat- images using spatio-spectral Wiener estimation,” Opt. Express 16(6),
form for easy integration into an imaging instrument of modest 4106–4120 (2008).
21. I. Nishidate et al., “Estimation of melanin and hemoglobin using spec-
price, potentially leading to widespread uses. tral reflectance images reconstructed from a digital RGB image by the
Wiener estimation method,” Sensors 13(6), 7902–7915 (2013).
Acknowledgments 22. I. Nishidate et al., “In vivo imaging of scattering and absorption proper-
ties of exposed brain using a digital red–green–blue camera,” Proc.
This work was supported by the Samsung Global Research SPIE 8928, 89280N (2014).
Outreach Program. 23. S.-C. Yoon et al., “Hyperspectral image reconstruction using RGB color
for foodborne pathogen detection on agar plates,” Proc. SPIE 9024,
90240I (2014).
References 24. S.-C. Yoon et al., “Hyperspectral imaging using a color camera and its
application for pathogen detection,” Proc. SPIE 9405, 940506 (2015).
1. R. Mittler, “Abiotic stress, the field environment and stress combina-
25. W.-F. Zhang and D.-Q. Dai, “Spectral reflectance estimation from cam-
tion,” Trends Plant Sci. 11(1), 15–19 (2006).
era responses by support vector regression and a composite model,”
2. R. D. Jackson, “Remote sensing of biotic and abiotic plant stress,” Annu.
J. Opt. Soc. Am. A 25(9), 2286–2296 (2008).
Rev. Phytopathol. 24(1), 265–287 (1986).
3. L. Li, Q. Zhang, and D. F. Huang, “A review of imaging techniques for 26. D. A. Sims and J. A. Gamon, “Relationships between leaf pigment con-
plant phenotyping,” Sensors 14(11), 20078–20111 (2014). tent and spectral reflectance across a wide range of species, leaf struc-
4. C. Parry, J. M. Blonquist, and B. Bugbee, “In situ measurement of leaf tures and developmental stages,” Remote Sens. Environ. 81(2), 337–354
(2002).
chlorophyll concentration: analysis of the optical/absolute relationship,”
Plant Cell Environ. 37(11), 2508–2520 (2014).
5. K. Maxwell and G. N. Johnson, “Chlorophyll fluorescence—a practical Taehoon Kim is a PhD student in the Weldon School of Biomedical
guide,” J. Exp. Bot. 51(345), 659–668 (2000). Engineering, Purdue University, West Lafayette, Indiana, USA.
6. C. Rousseau et al., “High throughput quantitative phenotyping of
plant resistance using chlorophyll fluorescence image analysis,” Plant Jeong-Im Kim is a research scientist in the Department of
Methods 9(1), 17 (2013). Biochemistry, Purdue University, West Lafayette, Indiana, USA.
Journal of Biomedical Optics 016008-5 January 2016 • Vol. 21(1)
Downloaded From: https://www.spiedigitallibrary.org/journals/Journal-of-Biomedical-Optics on 10 Mar 2021
Terms of Use: https://www.spiedigitallibrary.org/terms-of-useKim et al.: Nonspectroscopic imaging for quantitative chlorophyll sensing
Michelle A. Visbal Onufrak received her BS and MS degrees in elec- Young L. Kim received his PhD degree in biomedical engineering
trical engineering from the University of Puerto Rico, Mayaguez, and his MS degree in clinical investigation from Northwestern Univer-
Puerto Rico, USA. She is currently pursuing her PhD in biomedical sity in 2005 and 2007, respectively. He is currently an associate
engineering, Purdue University, West Lafayette, Indiana, USA. Her professor in the Weldon School of Biomedical Engineering and
current research project consists in developing noninvasive optical a codirector of the Biomedical Sciences Interdisciplinary Graduate
imaging devices for clinical assessment of precancerous lesions in Program at Purdue University, West Lafayette, Indiana, USA. His
collaboration with Indiana University School of Medicine. research interests include light-matter (e.g., natural materials and bio-
logical tissue) interactions, biophotonics technology development for
Clint Chapple is a distinguished professor of biochemistry, Purdue sensing, imaging, and treatment, and biostatistical analyses.
University, West Lafayette, Indiana, USA. His areas of expertise
include biochemistry and molecular biology of plant secondary
metabolism.
Journal of Biomedical Optics 016008-6 January 2016 • Vol. 21(1)
Downloaded From: https://www.spiedigitallibrary.org/journals/Journal-of-Biomedical-Optics on 10 Mar 2021
Terms of Use: https://www.spiedigitallibrary.org/terms-of-useYou can also read