INNOVATIVE INGREDIENTS TO ADDRESS GLYCAEMIC RESPONSE - Tate & Lyle
←
→
Page content transcription
If your browser does not render page correctly, please read the page content below
INNOVATIVE INGREDIENTS
TO ADDRESS GLYCAEMIC
RESPONSE

                         1
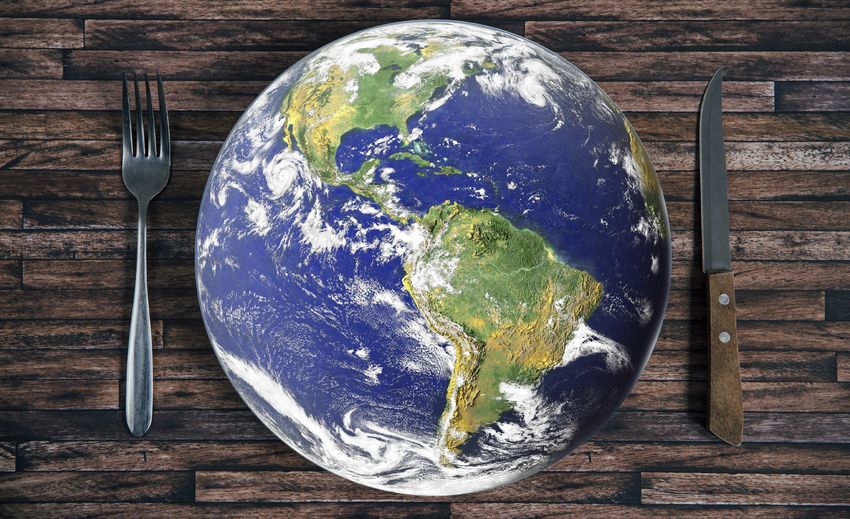
In light of the public health concerns surrounding high incidence of diabetes and metabolic syndrome there is a critical
need to manage blood glucose. The food and beverage industry can play an immense role in developing products
which will serve this need via designing products to have a lower glycaemic response. This document will review:
•   The size of diabetes epidemic
•   The importance of managing blood glucose
•   The role of dietary interventions
•   Specific ingredients that can help reduce the blood glucose response in food products such as fibres, rare sugars,
    and low and non-nutritive sweeteners (NNS)

Defining glycaemic response
Various terms used to describe blood glucose changes can cause confusion. Table 1 details these definitions for
numerous terms used to describe blood glucose - glycaemic response, glycaemic index, and glycaemic load. In this
document, we will be referring to the clinical endpoint of glycaemic response.

Table 1. Definitions of terms used to describe blood glucose responses to dietary components1.

    Glycaemic response (GR)                      Glycaemic index (GI)                         Glycaemic load (GL)

•   Post-prandial blood glucose            •   Representing quality of                •   GL = GI x available carbohydrate in
    response caused when a food                carbohydrate.                              a given amount of food
    that contains carbohydrate is
                                           •   % GR caused by a food containing       •   Available carbohydrates, and GL,
    consumed.
                                               50 g of carbohydrate vs 50 g of the        can be expresed as:
•   Also considered the change in              reference carbohydrate (glucose
    blood glucose concentration over           solution or white bread).                  •     g per serving;
    time and represented as the area       •   Foods having carbohydrate                  •     g per 100 g food;
    under the curve (AUC).                     that is digested, absorbed and
                                               metabolized quickly are considered         •     g per day’s intake;
                                               high GI foods (GI ≥ 70) vs low GI
                                                                                          •     g per 1000 kJ or 1000 kcal.
                                               foods (GI ≤ 55).

                                                                                                                                2
WHAT IS THE IMPACT OF DIABETES?

Incidence

According to the World Health Organization (WHO) diabetes is a chronic metabolic illness with elevated levels of
blood glucose, which if unmanaged, leads to impairment to the heart, blood vessels, eyes, kidneys, and nerves2. Type
1 diabetes occurs because the pancreas cannot produce any or sufficient amounts of the hormone insulin whereas
in type 2 diabetes the body does not respond to insulin. Type 1 diabetes can occur at any age but most often starts in
children and adolescents3. Type 2 diabetes is a chronic condition where the body does not utilize insulin properly which
then impacts glucose metabolism. While type 2 diabetes was referred to as “adult-onset diabetes”, it is occurring with
increasing frequency in children and makes up the vast majority of diabetes cases2.

The International Diabetes Federation (IDF) estimates that men have a slightly higher rate of diabetes than women
and the age group 65-79 years has the highest prevelance3. Once an affliction of predominantly rich nations, Figure 1
demonstrates that type 2 diabetes has now spread to every region of the world3. Diabetes affected 425 million people
worldwide or 8.8% adults in 2017 and is expected to rise to 629 million by 20453. A significant challenge is that about
212 million or 50% of all adults with diabetes are undiagnosed3. The highest rates are found in North America and
the Caribbean regions where 11.0%i of the population has diabetes compared to the Africa region at 4.2%, yet due to
population sizes the largest numbers of are found in China, India, and then North America3.

South and Central America fall in the middle of the global incidence rates with 7.6% of their population affected3.
Prediabetes, or impaired glucose tolerance, is defined later in this document and affects 352.1 million people
worldwide3. To indicate further what a serious health concern diabetes is, global estimates are that 212.4 million
people are unaware that they have diabetes, which only adds numbers to a growing global epidemic3.

Global Burden of Diabetes

Diabetes is a complex disease that takes time and knowledge to
manage. It affects people during critical stages of their education
and productivity in the workplace, can reduce quality of life and
even disable, reduces life expectancy, and eventually results in
death if left unmanaged. In addition to real human costs, diabetes
is associated with an enormous economic burden. Worldwide,
diabetes is a costly problem demanding personal and families’
finances for medical costs, drains national healthcare budgets,
slows economic growth, and overwhelms healthcare systems3.
Seventeen percent of the total healthcare budget was spent
on diabetes in the Middle East and North African region, the
highest percentage from all the regions that the IDF evaluated4.
Global assessments for healthcare expenditures for adults with
diabetes were USD 727 billion in 20173,4.

i
    Age-adjusted comparative diabetes prevalence                                                                          3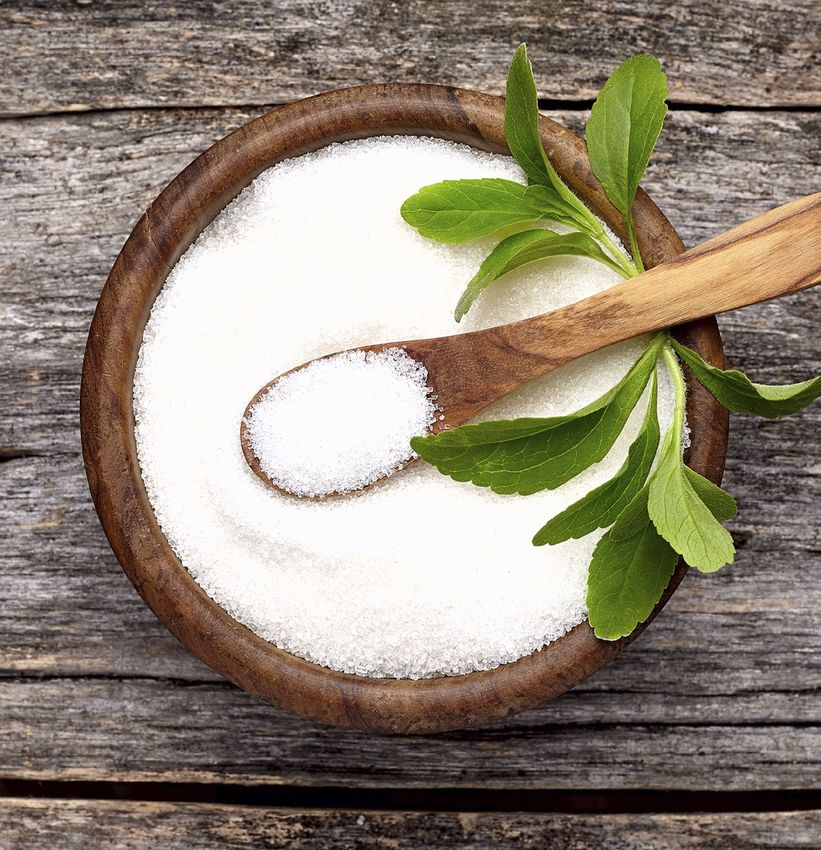
Figure 1. Global incidence rates for the top five countries with the largest numbers (in millions) of adults with
diagnosed diabetes, undiagnosed diabetes, or impaired glucose tolerance (IGT) in 20173.

                                                                                                      IGT
                        48,6
                                                                                                      Undiagnosed diabetes

                                                                                                      Diabetes
                        61,3
                                                 24

                                                 42,2

                        114,4                                             36,8

                                                 72,9                     11,5               14,6                    12,1
                                                                          30,2               5,7                     4,5
                                                                                             12,5                    12
           CHINA                    INDIA                 UNITED STATES          BRAZIL                MEXICO

WHAT CAUSES DIABETES?
Physiology
Insulin is a hormone, secreted from the pancreas,
but acts all over the body to maintain blood glucose
as it signals cells to transport glucose. In type 1
diabetes, insulin is not produced, thus cells cannot
absorb glucose resulting in hyperglycemia (high blood
glucose) and serum glucose can be measured as a
diagnostic tool, Table 2. In type 2 diabetes, the cells
stop responding to insulin, termed insulin resistance,
and this also results in high blood glucose. The fasting
test is performed to measure the amount of glucose
in the blood when someone has not eaten in at least
eight hours and the impaired glucose tolerance (IGT)
test measures the amount of glucose in the blood after
someone drinks 75 grams of glucose, called a glucose
response test (glucose tolerance test). Prediabetes
is when blood glucose is higher than normal, but not
elevated enough to be diagnosed as diabetes as a
result of the IGT or impaired fasting glucose (IFG),
table 2. Prediabetes occurs because of decreased
insulin sensitivity or increased insulin resistance and
symptoms are often milder versions of those with type 2
diabetes, Figure 25.

                                                                                                                        4
Table 2. Diagnostic Criteria for Diabetes per the International Diabetes Foundation and WHO3,4.

                                                                              Prediabetes
                                                                                                                                             Diabetes
                  Test                                                                         Impaired Glucose
                                             Impaired Fasting Glucose°                                                               (any one of these results)
                                                                                                  Tolerance°
                                            100-125 mg/dL                               < 126 mg/dL                                ≥ 126 mg/dL
 Fasting Glucose*                           (6.1-6.9 mmol/L)                            (< 7.0 mmol/L)                             (≥ 7.0 mmol/L)
                                            140-199 mg/dL                               ≥ 140 to < 200mg/dL                        ≥ 200 mg/dL
 2 hour glucose response**                  (7.8-11.0 mmol/L)                           (≥ 7.8 to < 11.1mmol/L)                    (≥ 11.0 mmol/L)

 Random Glucose test in                                                                                                            ≥ 200 mg/dL
                                            N.A.                                        N.A.
 symptomatic patient                                                                                                               (≥ 11.0 mmol/L)

                                                                                                                                   ≥ 6.5%
 HbA1c                                      N.A.                                        N.A.
                                                                                                                                   (≥ 48mmol/mol)

° Both fasting glucose and 2 hour glucose response criteria should be met for prediabetes diagnosis. | *Fasting is defined as no calories for 8
hours before the blood test. | **Consumed as 75 g glucose dissolved in water. | N.A. Blood test not typically performed for this condition.

Risk Factors

The risk factors for developing type 1 diabetes are                                        and of these 650 million were obese, and more than 340
family history, genetics, and infection, as shown in Table                                 million children and adolescents aged 5-19 years were
3 . The incidence of type 1 diabetes is increasing and the
 6
                                                                                           overweight or obese8. In Asian or African populations
cause is not definitive but could be due to global birth                                   even minor changes in body weight can have a
weights and life expectancy increasing . Individuals    7
                                                                                           significant impact on the risk of developing pre- or
with prediabetes are at high risk for developing insulin                                   type 2 diabetes9, 10, 11. The risk factors with the greatest
resistance and eventually type 2 diabetes5. Other risk                                     impact on the development and prevention of diabetes
factors for type 2 diabetes include physical inactivity,                                   will need to be identified for each specific group of
increased age, and a family history of diabetes, heart                                     interest and customized as was done with the Latin
disease or stroke. One of the strongest risk factors for                                   America Finnish Diabetes Risk Score (LA-FINDRISC) for
type 2 diabetes is being overweight or obese . Estimates        8
                                                                                           different Hispanics/Latinos populations12, 13.
for 2016 indicated 1.9 billion adults were overweight,

Table 3. Risk factors for developing type 1 or 2 diabetes3.

                 Type 1 diabetes                                           Type 2 diabetes                                             Prediabetes

 Family history                                             Obesity or overweight                                    Obesity or overweight
 Genetics                                                   Poor diet*                                               Poor diet*
                                                            Physical inactivity                                      Physical inactivity
                                                            Increased age                                            Increased age
 Infection
                                                            Family history of diabetes, heart                        Family history of diabetes, heart
                                                            disease or stroke                                        disease or stroke

*Poor diet can include low intakes of fruits, vegetables, whole grains, and fibre, and excessive intakes of calories, saturated fats, and empty calorie foods and beverages.

                                                                                                                                                                               5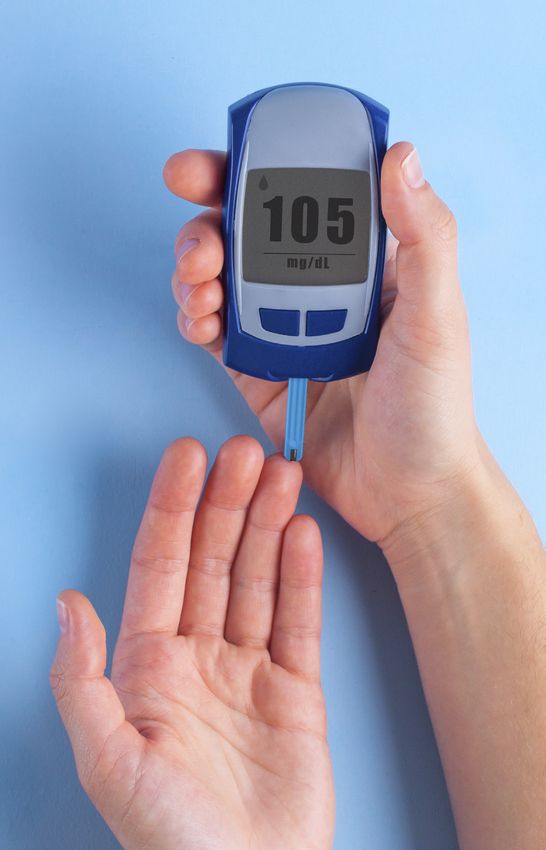
Figure 2. Symptoms of Diabetes. Some symptoms are unique to each type and some are similar.

                                                                                             Symptoms of both
                                                                                             types of diabetes3
                 Type 1                           Type 2                                     • Excessive thirst

    • Constant                                          • Tingling or                        • Frequent urination
      hunger                                              numbness in                        • Lack of energy
                                                          hands and feet
    • Sudden weight                                                                          • Blurred vision
      loss                                              • Recurrent fungal
                                                          skin infections
                                                        • Slow healing
                                                          wounds

Complications

High blood glucose, if not managed, can cause damage to many body organs leading to complications that can
decrease quality of life and can even be life threatening. The risk of heart attacks and stroke are two- to three-
fold higher in adults with unmanaged diabetes2. Observational studies have also demonstrated an association of
prediabetes with early kidney disease, nerve damage, vision problems, and vascular disease14. Hence, there is an
urgent global need to screen, diagnose, educate, and care for people with prediabetes and diabetes, as early diagnosis
and management reduces the risk of costly complications.

Prevention

There are no known effective ways to prevent type 1
diabetes and therefore prevention of diabetes in this
document is referring to the modifiable factors that
have been identified for pre- and type 2 diabetes (i.e.
risk reduction). The IDF states that the most influential
modifiable factors are the behaviours commonly
associated with living in an urban setting and living
a modern lifestyle which includes consumption of
unhealthy foods, and sedentary, inactive lifestyles. There
is strong evidence from randomized controlled trials
around the world that simple lifestyle measures such
as weight reduction, a healthy diet, and regular physical
activity can prevent or delay the onset of type 2 diabetes15.

                                                                                                                     6
Diet for Reduced Risk and
Management of Diabetes

For the prevention of type 2 diabetes, WHO suggests                primary management strategy because weight loss
a diet which limits saturated fats to less than 10% of             can reverse some of the metabolic issues observed
total energy intake, is adequate in fibre (minimum                 with type 2 diabetes. Excess intakes of calories, from
20 grams a day), and is less than 10% of total energy              any combination of macronutrients in food or beverage
intake from free sugars, Figure 3 . The WHO and IDF
                                  16
                                                                   sources, has a direct association with weight gain20.
also recommend a diet of less than 5% of total energy              Leading health organizations acknowledge the value of
intake from free sugars for those at risk of diabetes17,18
                                                           .       low calorie and non-nutritive sweeteners in reducing
The overall goal of dietary intervention is to manage              calories as part of an overall healthy diet and physical
blood glucose to healthy levels in type 1, pre-, and type          activity regimen. A review paper on the impact of dietary
2 diabetes. Dietary guidelines also often recommend                management for diabetes concluded that consumption
a low caloric diet for overweight or obese people                  of non-nutritive sweeteners do not increase blood
with type 2 diabetes to achieve significant weight loss            glucose or the glycaemic response and can be
(i.e., 10 kg minimum) . Weight loss should be the
                     19
                                                                   consumed by those with diabetes21.

Figure 3. WHO recommendations for the prevention of type 2 diabetes16.

                                                     Limit saturated
                                                     fats to less than
                                                          10% of total
                                                         energy intake

                                                      FOR THE
                                                    PREVENTION
                                                     OF TYPE 2
                                                     DIABETES:
                             Less than 10%
                                                                                  Adequate in
                             of total energy
                                                                                fibre (minimum
                              intake from
                                                                                20 grams a day)
                              free sugars

                                                                                                                              7
HOW CAN TATE & LYLE PROVIDE
INGREDIENT SOLUTIONS?
Factors that Affect the Blood Glucose Response

A systematic review conducted by the International Life    While diets containing 44 to 50 g of fibre a day are
Sciences Institute (ILSI) Europe reported that dietary     reported to improve blood glucose control in diabetes,
components can modulate blood glucose levels . While
                                                  22
                                                           this is not a usual level of fibre intake globally and it is
post-meal blood glucose is largely dependent on meal       recommended that people with diabetes eat 25 to 30 g
composition, fasting blood levels are only minimally       fibre per day21.
influenced by the amount and/or rate of glucose
absorption during the previous meal, and reflect the
                                                              NNS use was reviewed in an Academy of
rate of glucose production in the liver23. One of the
                                                              Nutrition and Dietetics position paper24 and
strongest influences on post-meal blood glucose is
                                                              states that “consumers can safely enjoy a range
the amount and quality of carbohydrates in the diet23.
                                                              of nutritive and NNS when consumed within an
Dietary factors that delay the process of digestion
                                                              eating plan that is guided by current nutrition
and/or absorption of carbohydrates are important in
                                                              recommendations as well as individual health
reducing the glycaemic response23. Fibres have the
                                                              goals and personal preferences.”
greatest impact on the postprandial glucose and insulin
response. Foods high in soluble fibre from oats, fruits,
and legumes and specific dietary fibres such as beta-      While added fibres and non-nutritive sweeteners may
glucan, pectin, psyllium, polydextrose and soluble corn    help with reducing blood glucose response, there are
fibre have been shown to lower the rise in blood glucose   other factors which affect the glycaemic response of a
levels after a meal in both healthy individuals and        food, including processing, food form, cooking method,
those with diabetes. In contrast, easily digestible and/   ripeness, variety, dietary fibre and overall macronutrient
or refined carbohydrates such as glucose, white bread,     content23. Choosing non-nutritive sweeteners can also
short-grain white rice and cooked potatoes produce         be helpful in moderating carbohydrate intake, which is
a rapid rise in blood glucose, followed by a rapid fall.   important for blood glucose response.

Tate & Lyle Fibres and Non-Nutritive Sweeteners as Part of the Solution

Tate & Lyle has a portfolio of ingredients that can be
used to formulate food and beverage products to reduce
calories, sugar, and glycaemic response:

•   FIBRES: that are clinically proven to lower the
    glycaemic response when used to replace digestible
    carbohydrates
•   NON-NUTRITIVE SWEETENERS: provide very low
    or no calories and limited impact on blood glucose.

                                                                                                                          8
FIBRES
Soluble Fibre

PROMITOR® has exceptional digestive tolerance, is stable to heat, pH, and
processing stresses.

          PROMITOR® Soluble Fibre 70 provides a minimum of 70%
          dietary fibre and contains less than 10% sugar. PROMITOR®
          Soluble Fibre 85 and 90 provide 85% or 90% dietary fibre,
          respectively, and contain less than 2% sugar. Because they
          are primarily sources of non-digestible dietary fibre, all
          PROMITOR® products provide significantly fewer calories
          compared to fully digestible carbohydratesii.

Two clinical studies and one animal study have evaluated the glycaemic effects of soluble corn fibre (SCF). Kendall et
al. showed that the postprandial blood glucose and insulin response to PROMITOR® Soluble Fibre in a lemonade based
beverage was significantly lower than a lemonade control containing glucose in healthy subjects25. Konings et al. also
observed a significant lowering of postprandial blood glucose and insulin levels when 30% of available carbohydrates
were replaced with PROMITOR® in foods and a beverage compared to similar full-calorie meals in sample of overweight
men and women28. Finally, a series of PROMITOR® Soluble Fibre formulations investigated in a study in dogs, were found
to significantly lower postprandial blood glucose and insulin responses versus a maltodextrin control.

Polydextrose

Tate & Lyle’s STA-LITE® Polydextrose is a soluble fibre                                  Jie et al. reported the ingestion of 12 g of polydextrose
ideal for sugar replacement and calorie reduction.                                       with 50 g of glucose, significantly lowered the glycaemic
STA-LITE replaces bulk and mouth feel, and has only
                  ®
                                                                                         response compared to a glucose control in healthy
1 kcal per gram . In 2011 based on available data, EFSA
                         iii
                                                                                         adults28. Kurotobi et al. compared the glycaemic index
concluded that a cause and effect relationship was                                       of five strawberry jams made with sugar, corn syrup
established between the consumption of foods/drinks                                      and sugar, sugar and glucose, apple juice and 40%
containing polydextrose instead of sugar and reduction                                   polydextrose in healthy adults29. The glycaemic index for
in postprandial blood glucose responses (without                                         the polydextrose jam was 17 compared to a range of 47-
disproportionally increasing postprandial insulinemic                                    70 for the other jams and 100 for 100% glucose. Konings
responses) as compared to sugar-containing foods/                                        et al. demonstrated a significantly lower postprandial
drinks . The consumption of polydextrose incorporated
             27
                                                                                         blood glucose and insulin response following the intake
into foods or beverages have demonstrated a lowering                                     of 57 g of STA-LITE® Polydextrose split between two
of the glycaemic response.                                                               meals compared to similar full-calorie meals30.

ii
      Calorie values for labeling may vary according to specific country regulations.
iii
      Caloric values reflect US labeling only. Calorie values for labeling may vary according to specific country regulations.                       9
RARE SUGARS, NON-NUTRITIVE AND
HIGH POTENCY SWEETENERS

                                                                                  Alluloseiv

                                                                                  Allulose is a rare sugar that exists at low levels in certain
                                                                                  fruits and foods including figs, raisins, molasses, and
                                                                                  maple syrup. Allulose is an epimer of fructose without all
                                                                                  the calories.

                                                                                       Tate & Lyle DOLCIA PRIMA® Allulose is 70
                                                                                       percent as sweet as sugar and can replace
                                                                                       sucrose or high-fructose corn syrup and
                                                                                       blends well with other sweeteners to
                                                                                       reduce calories while providing great
                                                                                       sweet taste, mouthfeel, and bulk.

                                                                                  Allulose is absorbed, but not metabolized, thus has
                                                                                  negligible calories31. Allulose consumed alone does
                                                                                  not raise blood glucose or insulin in normal glycaemic,
                                                                                  healthy individuals nor in individuals with type 2
                                                                                  diabetes (unpublished internal reports). Allulose when
                                                                                  consumed with glycaemic carbohydrates modestly
                                                                                  reduces postprandial glycaemic response in individuals
                                                                                  with type 2 diabetes, with prediabetes, and with normal
                                                                                  glycaemia32, 33, 34. While these results are interesting,
                                                                                  further research is needed to determine if there are
                                                                                  long-term benefits of allulose in the diet for blood
                                                                                  glucose management.

Sucralosev

SPLENDA® Sucralose is heat stable in cooking and baking and works well in a broad range of food and beverage
systems. Foods and beverages formulated with sucralose elicit a lower blood glucose response than similar products
with sugar.

iv
     DOLCIA PRIMA® Allulose is available in two regions: North America and Latin America
v
     SPLENDA® and the SPLENDA® logo are trademarks of Heartland Consumer Products, LLC.                                                       10
Stevia
Stevia sweeteners are extracted from the stevia plant,
are zero calories and are considered to have 200 to 300
times the sweetness of sucrose. Clinical studies have
evaluated the postprandial glycaemic effect of stevia
products in healthy individuals and people with type 2
diabetes, with some indicating no significant change36,
37, 38, 39
with others indicating a significant reduction
compared to a control (placebo, sucrose, water, mixed
meal)40, 41. One study examined the effect of a beverage
containing rebaudioside A from the stevia plant and
observed no increases on postprandial blood glucose
and insulin levels36. A meta-analysis of available
randomized clinical trials reported a very small,
clinically insignificant reduction in fasting blood glucose
when stevia is consumed42.
Monk fruit
Monk fruit extract is a natural, zero-
calorie sweetener obtained from monk
fruit grown in the sub-tropical climate of
Asian hillsides.
In a study comparing the effects of consuming monk
fruit in a beverage, it was found that there were not
increases in total daily energy intake, blood glucose or
insulin43. Tate & Lyle PUREFRUIT™ Monk Fruit Extract
is 100-200 times the sweetness of sugar, allowing
for sugar reduction up to 100% in certain foods and
beverages. This ingredient is appropriate for a wide-
range of applications in foods and beverages.
CONCLUSIONS:
Diet is a modifiable factor for the management of both type 1 and 2 diabetes and to help reduce risk of prediabetes and
type 2 diabetes. There are ingredient tools, such as fibres and sweeteners, available to product developers to design
foods and beverages with glycaemic response in mind. There are global health and nutrition organizations which
recognize the important role these ingredients play in the enjoyment, taste, and health of foods and beverages.
11REFERENCES: 2008; 27:711-8.
26
de Godoy MR, Knapp BK, Parsons CM, Swanson KS, Fahey GC Jr.
1
Augustin L, et al. Glycemic index, glycemic load and glycemic response: In vitro hydrolytic digestion, glycemic response in dogs, and true
An International Scientific Consensus Summit from the International metabolizable energy content of soluble corn fibers. J Anim Sci. 2014;
Carbohydrate Quality Consortium (ICQC). Nutr Metab Cardiovasc Dis. 92:2447-57.
2015 Sep;25(9):795-815
27
EFSA Panel on Dietetic Products, Nutrition and Allergies (NDA);
2
World Health Organization. Diabetes. 2017b. http://www.who.int/news- Scientific Opinion on the substantiation of health claims related to the
room/fact-sheets/detail/diabetes sugar replacers xylitol, sorbitol, mannitol, maltitol, lactitol, isomalt,
3
International Diabetes Federation. IDF Diabetes Atlas. Eight edition erythritol, D-tagatose, isomaltulose, sucralose and polydextrose
2017. http://diabetesatlas.org/resources/2017-atlas.html and maintenance of tooth mineralisation by decreasing tooth
4
World Health Organization. Global report on diabetes. 2016. www.who. demineralisation (ID 463, 464, 563, 618, 647, 1182, 1591, 2907, 2921, 4300),
int/diabetes/global-report/en/ and reduction of post-prandial glycaemic responses (ID 617, 619, 669,
5
NIDDK. Insulin resistance and prediabetes. 2018. https://www.niddk. 1590, 1762, 2903, 2908, 2920) pursuant to Article 13(1) of Regulation (EC)
nih.gov/health-information/diabetes/overview/what-is-diabetes/ No 1924/2006. EFSA J. 2011; 9:2076.
prediabetes-insulin-resistance
28
Jie Z, Bang-Yao L, Ming-Jie X, et al. Studies on the effects of polydextrose
6
Rewers M, Ludvigsson J. Environmental risk factors for type 1 diabetes. intake on physiologic functions in Chinese people. Am J Clin Nutr. 2000;
Lancet. 2016; 387(10035):2340-2348. 72:1503-9.
7
You WP, Henneberg M. Type 1 diabetes prevalence increasing globally
29
Kurotobi T, Fukuhara K, Inage H, et al. Glycaemic index and
and regionally: the role of natural selection and life expectancy at birth. postprandial blood glucose response to Japanese strawberry jam in
BMJ Open Diabetes Res Amp Care 2016; 4. normal adults. J Nutr Sci Vitaminol. 2010; 56:198-202.
8
World Health Organization. Obesity and overweight. 2017a. http://www.
30
Konings E, Schoffelen PF, Stegen J, et al. Effect of polydextrose and
who.int/news-room/fact-sheets/detail/obesity-and-overweight soluble maize fibre on energy metabolism, metabolic profile and appetite
9
Das, A. et al. Cardiometabolic disease in South Asians: A global control in overweight men and women. Br J Nutr. 2014; 111:111-21
health concern in an expanding population. Nutrition, Metabolism and
31
Iida et al. Failure of D-psicose absorbed in the small intestine to
Cardiovascular Diseases, Volume 27, Issue 1, 32 – 40. metabolize into energy and its low large intestinal fermentability in
10
Goedecke, Julia H. et al. Type 2 diabetes mellitus in African women. humans. Metabolism 2010; 59(2):206-14.
Diabetes Research and Clinical Practice, Volume 123, 87 – 96.
32
Hayashi et al. Study on the postprandial blood glucose suppression
11
R. S. Bhopa. A four-stage model explaining the higher risk of Type 2 effect of D-psicose in borderline diabetes and the safety of long-term
diabetes mellitus in South Asians compared with European populations. ingestion by normal human subjects. Biosci Biotechnol Biochem 2010;
Diabet Med. 2013 Jan; 30(1):35-42. 74(3):510-9.
12
Nieto-Martínez R, González-Rivas JP, Aschner P, Barengo NC,
33
Iida et al. Acute D-psicose administration decreases the glycaemic
Mechanick JI. Transculturalizing Diabetes Prevention in Latin America. responses to an oral maltodextrin tolerance test in normal adults. J Nutr
Ann Glob Health. 2017 May - Aug; 83(3-4):432-443. Sci Vitaminol (Tokyo) 2008; 54(6):511-4.
13
Avilés-Santa ML, Colón-Ramos U, Lindberg NM, Mattei J, Pasquel FJ,
34
Noronha et al. Effect of Small Doses of Fructose and Allulose on
Pérez CM. From Sea to Shining Sea and the Great Plains to Patagonia: A Postprandial Glucose Metabolism in Type 2 Diabetes: A Double-blind,
Review on Current Knowledge of Diabetes Mellitus in Hispanics/Latinos Randomized, Controlled, Acute Feeding Equivalence Trial. Diabetes,
in the US and Latin America. Front Endocrinol (Lausanne). 2017 Nov 10; Obesity, and Metabolism 2018; 1-10.
8:298.
35
EFSA Panel on Dietetic Products, Nutrition and Allergies (NDA);
14
Bansal N. Prediabetes diagnosis and treatment. World J Diab. 2015; Scientific Opinion on the substantiation of health claims related to the
6:296-303. sugar replacers xylitol, sorbitol, mannitol, maltitol, lactitol, isomalt,
15
Diabetes UK. Evidence-based nutrition guidelines for the prevention erythritol, D-tagatose, isomaltulose, sucralose and polydextrose
and management of diabetes. March 2018. https://www.diabetes. and maintenance of tooth mineralisation by decreasing tooth
org.uk/professionals/position-statements-reports/food-nutrition- demineralisation (ID 463, 464, 563, 618, 647, 1182, 1591, 2907, 2921, 4300),
lifestyle/evidence-based-nutrition-guidelines-for-the-prevention-and- and reduction of post-prandial glycaemic responses (ID 617, 619, 669,
management-of-diabetes 1590, 1762, 2903, 2908, 2920) pursuant to Article 13(1) of Regulation (EC)
16
World Health Organization & UN Food and Agriculture Organization. No 1924/2006. EFSA Journal. 2011; 9:2076.
Diet, nutrition and the prevention of chronic diseases: report of a joint
36
Maki KC, Curry LL, McKenney JM et al. Glycemic and blood pressure
WHO/FAO expert consultation, 2002. responses to acute Doses of Rebaudioside A, a steviol glycoside, in
17
World Health Organization. WHO calls on countries to reduce subjects with normal glucose tolerance or type 2 diabetes mellitus.
sugar intake among adults and children. 2015. http://www.who.int/ FASEB J. 2009; 23: Abstract 351.6.
mediacentre/news/releases/2015/sugar-guideline/en/
37
Jeppesen PB, Barriocanal L, Meyer MT et al. Efficacy and tolerability of
18
International Diabetes Federation. IDF Framework for Action on Sugar. oral stevioside in patients with type 2 diabetes: a long-term, randomized,
Brussels, Belgium, 2015. double-blinded, placebo-controlled study. Diabetologia. 2006; 49:
19
International Diabetes Federation. IDF clinical practice Abstract No. 0843.
recommendations for managing type 2 diabetes in primary care. 2017.
38
Geuns JMC, Buyse J, Vankeirsbilck A, Temme EHM. Metabolism of
https://www.idf.org/e-library/guidelines.html stevioside by healthy subjects. Exp Biol Med. 2007; 232:164–73.
20
World Health Organization. Reducing consumption of sugar-sweetened
39
Tey SL, Salleh NB, Henry J, Forde CG. Effects of aspartame-, monk
beverages to reduce the risk of unhealthy weight gain in adults. 2018. fruit-, stevia- and sucrose-sweetened beverages on postprandial glucose,
http://www.who.int/elena/titles/ssbs_adult_weight/en/ insulin and energy intake. Int J Obes. 2017; 41:450–7.
21
Franz MJ, et al. The evidence for medical nutrition therapy for type 1
40
Gregersen S, Jeppesen PB, Holst JJ, Hermansen K. Antihyperglycemic
and type 2 diabetes in adults. J Am Diet Assoc. 2010; 110:1852-1889. effects of stevioside in type 2 diabetic subjects. Metabolism. 2004;
22
Sadler M. Food, Glycemic Response and Health. ILSI Europe Concise 53:73–6.
Monograph Series. 2011. http://ilsi.org/publication/food-glycaemic-
41
Anton SD, Martin CK, Han H et al. Effects of stevia, aspartame, and
response-and-health/ sucrose on food intake, satiety, and postprandial glucose and insulin
23
Russell WR, Baka A, Bjork I et al. Impact of diet composition on blood levels. Appetite. 2010; 55:37–43.
glucose regulation. Crit Revs Fd Sci Nutr 2016; 56:541-590.
42
Onakpoya IJ, Heneghan CJ. Effect of the natural sweetener, steviol
24
Fitch C, Keim KS; Academy of Nutrition and Dietetics. Position of the glycoside, on cardiovascular risk factors: A systematic review and
Academy of Nutrition and Dietetics: use of nutritive and nonnutritive meta-analysis of randomised clinical trials. Eur J Prev Cardiol. 2015;
sweeteners. J Acad Nutr Diet. 2012 May; 112(5):739-58. 22:1575–87.
25
Kendall C, Esfahani A, Hoffman A, et al. Effect of novel maize-based
43
Tey SL, Salleh NB, Henry J, Forde CG. Effects of aspartame-, monk
dietary fibers on postprandial glycemia and insulinemia. J Am Coll Nutr. fruit-, stevia- and sucrose-sweetened beverages on postprandial glucose,
insulin and energy intake. Int J Obes (Lond). 2017 Mar; 41(3):450-457.
© 2021 Tate & Lyle SOG0121041You can also read