Gymnodimine A and 13-desMethyl Spirolide C Alter Intracellular Calcium Levels via Acetylcholine Receptors - MDPI
←
→
Page content transcription
If your browser does not render page correctly, please read the page content below
toxins
Article
Gymnodimine A and 13-desMethyl Spirolide C Alter
Intracellular Calcium Levels via
Acetylcholine Receptors
Joyce A. Nieva, Bernd Krock , Urban Tillmann , Jan Tebben , Christian Zurhelle
and Ulf Bickmeyer *
 Alfred Wegener Institute, Helmholtz Center for Polar and Marine Research, D-27570 Bremerhaven, Germany;
 joyce.nieva@awi.de (J.A.N.); Bernd.Krock@awi.de (B.K.); urban.tillmann@awi.de (U.T.); jan.tebben@awi.de (J.T.);
 christian.zurhelle@awi.de (C.Z.)
 * Correspondence: ulf.bickmeyer@awi.de; Tel.: +49-471-4831-2028

 Received: 13 November 2020; Accepted: 26 November 2020; Published: 27 November 2020

 Abstract: Gymnodimines and spirolides are cyclic imine phycotoxins and known antagonists of
 nicotinic acetylcholine receptors (nAChRs). We investigated the effect of gymnodimine A (GYM A)
 and 13-desmethyl spirolide C (SPX 1) from Alexandrium ostenfeldii on rat pheochromocytoma (PC12)
 cells by monitoring intracellular calcium levels ([Ca]i ). Using whole cells, the presence of 0.5 µM
 of GYM A or SPX 1 induced an increase in [Ca]i mediated by acetylcholine receptors (AChRs) and
 inhibited further activation of AChRs by acetylcholine (ACh). To differentiate the effects of GYM A
 or SPX 1, the toxins were applied to cells with pharmacologically isolated nAChRs and muscarinic
 AChRs (mAChRs) as mediated by the addition of atropine and tubocurarine, respectively. GYM A
 and SPX 1 activated nAChRs and inhibited the further activation of nAChRs by ACh, indicating that
 both toxins mimicked the activity of ACh. Regarding mAChRs, a differential response was observed
 between the two toxins. Only GYM A activated mAChRs, resulting in elevated [Ca]i , but both toxins
 prevented a subsequent activation by ACh. The absence of the triketal ring system in GYM A may
 provide the basis for a selective activation of mAChRs. GYM A and SPX 1 induced no changes in [Ca]i
 when nAChRs and mAChRs were inhibited simultaneously, indicating that both toxins target AChRs.

 Keywords: cyclic imine; nicotinic, muscarinic, and acetylcholine receptors; calcium signaling;
 Alexandrium ostenfeldii

 Key Contribution: Gymnodimine A and 13-desmethyl spirolide C show a similar effect on nicotinic
 acetylcholine receptors and a differential response to muscarinic acetylcholine receptors.

1. Introduction
     The frequency and widespread occurrence of marine biotoxins associated with microalgae
has increased over the years [1]. Among the emerging classes of lipophilic marine toxins are the
macrocyclic imine compounds such as prorocentrolides, spiro-prorocentrimine, gymnodimines,
spirolides, pinnatoxins, and portimine [2].
     Spirolides, one of the classes of cyclic imine, are produced by Alexandrium ostenfeldii [3]. To this day,
they have not been found in any other microalgal species. Gymnodimines, on the other hand, have only
been recently reported to co-occur with spirolides in at least a number of Alexandrium ostenfeldii
strains [4–8] and were initially identified in Karenia selliformis [9]. The presence of structurally related
gymnodimines and spirolides in a single microalgal species suggests that both toxins share a common
biosynthetic pathway. In addition to the cyclic imine moiety, the butenolide side chain is identical for
gymnodimines and spirolides, indicating a common function in both toxin types [10].

Toxins 2020, 12, 751; doi:10.3390/toxins12120751                                    www.mdpi.com/journal/toxins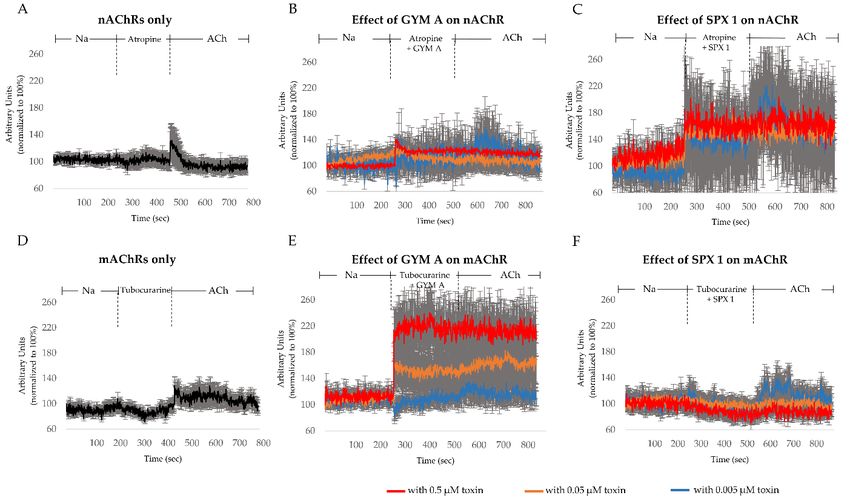
Toxins 2020, 12, 751 2 of 11
side chain is identical for gymnodimines and spirolides, indicating a common function in both toxin
Toxins 2020, 12, 751 2 of 11
types [10].
Functional bioassays on gymnodimine A (GYM A, Figure 1A) and 13-desmethyl spirolide C
(SPX Functional
1, Figure 1B) revealedona gymnodimine
bioassays similar bioactivity. SinceA,
A (GYM both induce
Figure 1A)rapid neurotoxic symptoms
and 13-desmethyl spirolide in C
mice after intraperitoneal injection or oral administration, they are called
(SPX 1, Figure 1B) revealed a similar bioactivity. Since both induce rapid neurotoxic symptoms “fast-acting toxins” [11].
in
Moreover,
mice after results from in vivo
intraperitoneal assaysorshowed
injection that the time for
oral administration, symptoms
they are called to“fast-acting
manifest shortened
toxins” and
[11].
the
Moreover, results from in vivo assays showed that the time for symptoms to manifest shortenedwere
onset of death accelerated when cholinergic or acetylcholinesterase inhibitors and
simultaneously
the onset of death administered.
accelerated whenThesecholinergic
observations prompted studies toinhibitors
or acetylcholinesterase determine the simultaneously
were mechanism by
which the toxins
administered. affect
These acetylcholine
observations receptors
prompted (AChRs)
studies [12,13]. Electrophysiological
to determine the mechanism by which measurements
the toxins
using clonal cells demonstrated that while GYM A as well as SPX
affect acetylcholine receptors (AChRs) [12,13]. Electrophysiological measurements using 1 broadly targets muscular and
clonal cells
neuronal
demonstrated nicotinic
that AChRs
while GYM (nAChRs) [14–17],
A as well as SPXonly GYM Atargets
1 broadly showed a reversible
muscular effect [14].
and neuronal These
nicotinic
studies used both homomeric and heteromeric subtypes such as α7,
AChRs (nAChRs) [14–17], only GYM A showed a reversible effect [14]. These studies used bothα1 2β1γδ, α7-5HT3, α3β2, and
α4β2 nAChRs.
homomeric andThe effect of SPX
heteromeric 1 on muscarinic
subtypes AChRs
such as α7, (mAChRs) was,determined using a human
α12 β1γδ, α7-5HT 3 α3β2, and α4β2 nAChRs.
neuroblastoma
The effect of SPX cell model.
1 on It showed
muscarinic AChRsthe (mAChRs)
antagonisticwaseffect of the toxin
determined usingthat resulted
a human in a reduced
neuroblastoma
function and decreased specificity of mAChRs [18]. However, recent studies
cell model. It showed the antagonistic effect of the toxin that resulted in a reduced function contradicted this model
and
and showed
decreased that neither
specificity SPX 1 [15,17]
of mAChRs [18]. nor GYM A
However, [17] strongly
recent interact withthis
studies contradicted mAChR
modelsubtypes
and showed M1–
M 5.
that neither SPX 1 [15,17] nor GYM A [17] strongly interact with mAChR subtypes M –M . 1 5
Figure 1. Chemical structure of Gymnodimine A (GYM A) (A) and 13-desmethyl spirolide C (SPX 1)
Figure 1. Chemical structure of Gymnodimine A (GYM A) (A) and 13-desmethyl spirolide C (SPX 1)
(B) [16].
(B) [16].
Only a few bioactivity studies other than the mouse bioassay [11] and in vitro inhibition
Only
assays [12–18] a few bioactivity
have beenstudies performedother than the mouse bioassay
on gymnodimines and [11] and in vitro
spirolides. inhibition assays
Electrophysiological
[12–18]
measurements were limited to a specific receptor, which was overexpressed [19].measurements
have been performed on gymnodimines and spirolides. Electrophysiological Considering
were limited to a specific receptor, which was overexpressed [19].
that GYM A and SPX 1 have shown anticholinergic effects on nAChRs in recombinant cells Considering that GYM A and SPX
[12–18],
1it have shown anticholinergic effects on nAChRs
is important to determine the effects on cellular signaling. in recombinant cells [12–18], it is important to
determine the effects on cellular
In neuroendocrine cells such signaling.
as rat pheochromocytoma (PC 12) cells, many different types of
In neuroendocrine cells such
receptors and ion channels are simultaneously as rat pheochromocytoma
present [20,21].(PC 12) cells, many
Voltage-gated different
calcium types of
(Ca) channels
receptors and ion channels are simultaneously present
2+ [20,21]. Voltage-gated
and AChRs are known to permeate calcium ions (Ca ) into the cell when the channels are opened as a calcium (Ca) channels
and
resultAChRs are known toorpermeate
of depolarization binding calcium ions (Ca2+
of acetylcholine ) into the
(ACh), cell when the
respectively. channels are
Voltage-gated Caopened as
channels
aare
result of depolarization or binding of acetylcholine (ACh),
2+ respectively. Voltage-gated
selective gates that regulate the majority of the Ca influx into the cell [22], while nAChRs are Ca channels
are selective gates
non-selective cationthat regulate
channels thatthe
aremajority
permeable of not
the only
Ca2+ toinflux
Ca2+into the cell
but also [22], cations
to other while nAChRs are
[23]. AChRs
non-selective
can be classified cation
intochannels
nicotinicthat
and are permeable
muscarinic not only
AChRs. to Ca
While
2+ but also
nAChRs to other
function as cations
ionotropic [23]. AChRs
receptors
can be classified into nicotinic and muscarinic AChRs. While nAChRs
inducing as a fast response in the cell [24], mAChRs are coupled to G-proteins that use the transmitted function as ionotropic
receptors inducinga as
signal to activate a fast of
cascade response
reactionsin and
the cell [24], mAChRs
produce a secondary are messenger.
coupled to G-proteins
Comparedthat use the
to nAChRs,
transmitted
mAChRs provide signal anto activate a cascadeto
indirect response ofareactions
series of and produce
reactions [25].a secondary messenger. Compared
to nAChRs,
In this study, we investigated the effects of GYM A of
mAChRs provide an indirect response to a series andreactions
SPX 1 [25].
on the intracellular Ca2+
([Ca]In this study, we investigated the effects of GYM A and SPX 1 on the intracellular Ca2+ ([Ca]i)
i ) alterations mediated by ion channels and receptors. We chose PC12 cells in order to be
alterations mediated
able to investigate thebyeffects
ion channels
of toxinsand receptors.
on more than We one chose
type ofPC12 cells and
receptor in order
manytodifferent
be ableion
to
investigate the effects of toxins on more than one type of receptor and many
channels [20]. We specifically aimed to determine the influence of GYM A and SPX 1 on voltage-operated different ion channels
[20]. We specifically
plasma-membrane Caaimed
channels to and
determine theand
nicotinic influence
muscarinic of GYM
AChRs A of
and
PCSPX 1 on
12 cells voltage-operated
under physiological
plasma-membrane Ca channels and nicotinic and muscarinic
conditions. Since PC12 cells contain the nAChR subtypes α3, α5, β2–β4 [26], as well AChRs of PC 12 cells under
as atypical
mAChR subtypes [27], our approach is more general than previously published works [14–18].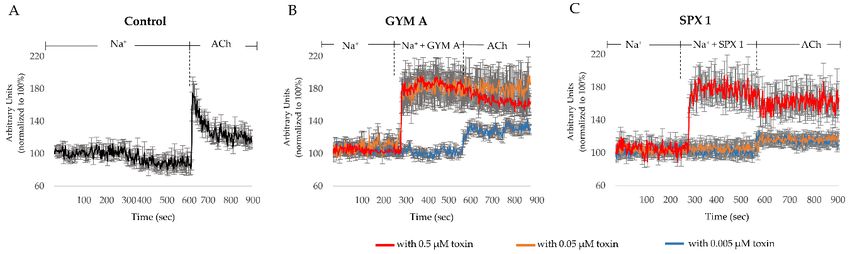
Toxins 2020, 12, 751
physiological conditions. 3 of 11
Since PC12 cells contain the nAChR subtypes α3, α5, β2–β4 [26], as well as
atypical mAChR subtypes [27], our approach is more general than previously published works [14–
physiological conditions. Since PC12 cells contain the nAChR subtypes α3, α5, β2–β4 [26], as well as
18].
atypical mAChR subtypes [27], our approach is more general than previously published works [14–
Toxins 2020, 12, 751 3 of 11
18].
2. Results
2.
2. Results
Results
2.1. Depolarization of Ca Channels Using K+
To account for
2.1. Depolarization
Depolarization theChannels
of Ca possibility K++ toxins inhibiting voltage-dependent calcium channels, we
of the
Using
investigated their influence on depolarization-induced [Ca]i changes (Figure 2). This was done to
To account
account for
for the
thepossibility
possibility ofofthe toxins
the inhibiting
toxins inhibitingvoltage-dependent
voltage-dependent calcium channels, we
avoid misinterpretation of toxin induced calcium channel inhibition with effectscalcium channels,
on AChRs. In the
investigated
we their
investigated influence
their influenceonon
depolarization-induced
depolarization-induced [Ca]i changes
[Ca] changes (Figure 2).
2).This was done
done to
controls, an elevation of [Ca]i, induced by high concentrations i of K+ was(Figure
associated This
withwas
a change in
avoid misinterpretation
misinterpretation of toxin induced calcium channel inhibition with effects on AChRs. In the
fluorescence emission intensity of the Flou-3 AM dye. Baseline recovery of [Ca]i to the baseline was
controls, an elevation of [Ca]ii, induced by high concentrations of of K K++ was
was associated
associated with a change in
observed after depolarization (Figure 3A).
fluorescence emission intensity of the Flou-3 AM dye. Baseline recovery of [Ca]ii to the baseline was
observed after depolarization (Figure 3A).
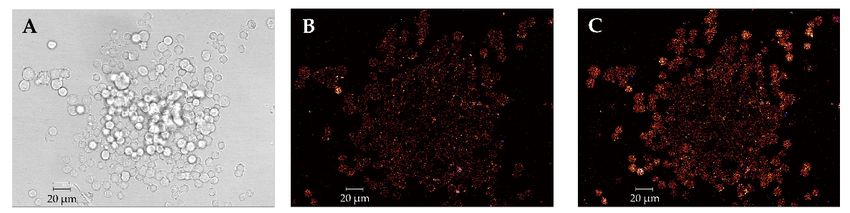
Figure 2. (A) Transmission image of pheochromocytoma (PC12) cells and (B) fluorescence images of
flou-3 acetoxymethylester (Flou-3 AM)-stained PC 12 cells before and (C) during depolarization.
Figure 2. (A) Transmission image of pheochromocytoma (PC12) cells and (B) fluorescence images of
flou-3
Cells acetoxymethylester
incubated with GYM (Flou-3
A orAM)-stained PC 12
SPX 1 (0.5 µM) cells before
showed before and
and (C)
(C) during
an increase of [Ca]depolarization.
during depolarization.
i during depolarization
and no calcium channel inhibition (Figure 3B,C, respectively). In both treatments, the baseline
Cells incubated
Cells incubated with
with GYM
GYM A or SPX
A or SPX 11 (0.5
(0.5 µM) showed an
µM) showed an increase
increase of
of [Ca]
[Ca]ii during
during depolarization
depolarization
recovery was delayed (Figure 3B,C) compared to the control (Figure 3A).
and no
and nocalcium
calciumchannel
channelinhibition (Figure
inhibition 3B,C,3B,C,
(Figure respectively). In both
respectively). Intreatments, the baseline
both treatments, the recovery
baseline
was delayed (Figure 3B,C) compared to the control (Figure 3A).
recovery was delayed (Figure 3B,C) compared to the control (Figure 3A).
Figure 3. Alterations of fluorescence intensity (FI) induced by 80 mM K+ +. (A) Intracellular calcium
Figure 3. Alterations of fluorescence intensity (FI) induced by 80 mM K . (A) Intracellular calcium
levels ([Ca]i ) changes (shown as arbitrary FI units) induced by activation of voltage-gated calcium
levels ([Ca]+i) changes (shown as arbitrary FI units) induced by activation of voltage-gated calcium
channels
Figure 3. (K ) under control
Alterations conditionsintensity
of fluorescence and (B) in cells treatedbywith 0.5 µM
K+.GYM A or (C) 0.5 µM SPX
channels (K+) under control conditions and (B) (FI) induced
in cells 80 mM
treated with 0.5 µM (A) Intracellular
GYM A or (C) 0.5 calcium
µM SPX
1. n
levels= 10.
([Ca]i) changes (shown as arbitrary FI units) induced by activation of voltage-gated calcium
1. n = 10.
channels (K+) under control conditions and (B) in cells treated with 0.5 µM GYM A or (C) 0.5 µM SPX
2.2. [Ca]i Changes Induced by ACh
1. n =i Changes
2.2. [Ca] 10. Induced by ACh
A [Ca]i elevation, as described by an increase of [Ca]i from the baseline, was also mediated by
2.2. A [Ca]
[Ca] i elevation,
i Changes
ACh (Figure 4A). Induced
To revealasbydescribed
ACh
the effects by an increase
of the toxins onof[Ca]
[Ca] i from the baseline, was also mediated by
i , GYM A or SPX 1 were applied before ACh
ACh
(Figure (Figure
4B,C). 4A). To reveal the effects of the toxins on [Ca] i, GYM A or SPX 1 were applied before
A [Ca] i elevation, as described by an increase of [Ca]i from the baseline, was also mediated by
ACh (Figure 4B,C).
ACh In cells treated
(Figure 4A). Towith
reveal either
the 0.5 µM of
effects (Figure 4B, inon
the toxins red)
[Ca] ori,0.05
GYM µMA(Figure
or SPX 4B, in orange)
1 were appliedGYM A,
before
In cells
an increase treated with either 0.5 µM (Figure 4B, in red) or 0.05 µM (Figure 4B, in orange) GYM A,
ACh (Figureof4B,C).
[Ca]i was observed after the toxins were applied. The successive application of ACh
an increase
induced of
no further[Ca] i was observed after the toxins were applied. The successive application of ACh
In cells treated[Ca]
with i elevation
either 0.5(Figure 4B, in4B,
µM (Figure redinand orange).
red) or 0.05AµM different
(Figurepattern
4B, in was observed
orange) GYM for
A,
induced
0.005 µM no
GYM further
A [Ca]
(Figure i elevation (Figure 4B, in red and orange). A different pattern was observed
4B, in blue). In this case, no increase in [Ca] was observed after the addition
i
an increase of [Ca]i was observed after the toxins were applied. The successive application of ACh
of GYM A
induced nobut instead
further [Ca]after the ACh was applied.
i elevation (Figure 4B, in red and orange). A different pattern was observed
The application of 0.5 µM of SPX 1 also resulted in an increase in [Ca]i (Figure 4C, in red). Following
the application of ACh, no further [Ca]i response was detected. As for the lower concentrations,Toxins 2020, 12, 751 4 of 11
for 0.005 µM GYM A (Figure 4B, in blue). In this case, no increase in [Ca]i was observed after the
addition of GYM A but instead after the ACh was applied.
The 12,
Toxins 2020, application
751 of 0.5 µM of SPX 1 also resulted in an increase in [Ca]i (Figure 4C, in red).
4 of 11
Following the application of ACh, no further [Ca]i response was detected. As for the lower
concentrations, no increase in [Ca]i was observed after the addition of 0.05 and 0.005 µM SPX 1. When
no
AChincrease in [Ca]i wasapplied,
was subsequently observed after
a [Ca] the addition of 0.05 and 0.005 µM SPX 1. When ACh was
i elevation was observed (Figure 4C, in orange and blue).
subsequently applied, a [Ca]i elevation was observed (Figure 4C, in orange and blue).
Figure 4. [Ca]i changes induced by ACh, GYM A, and SPX 1. (A) [Ca]i level changes induced by
Figure 4. [Ca]
activation i changes induced by ACh, GYM A, and SPX 1. (A) [Ca]i level changes induced by
of AChRs under control conditions; (B) in cells treated with GYM A in the concentrations
0.005 µM (blue), 0.05under
activation of AChRs control conditions;
µM (orange), and 0.5 µM(B) in cells
(red); andtreated
(C) SPXwith
1 inGYM A in the concentrations
the concentrations 0.005 µM
0.005 µM (blue), 0.05 µM (orange), and 0.5 µM
(blue), 0.05 µM (orange), and 0.5 µM (red). n = 10.(red); and (C) SPX 1 in the concentrations 0.005 µM
(blue), 0.05 µM (orange), and 0.5 µM (red). n = 10.
To differentiate the effects of both toxins on AChRs present in the cells, we pharmacologically
To the
isolated differentiate
effect of the thetoxins
effectsonof both toxins
nAChRs on AChRs
by using present in theatropine
the mAChR-blocker cells, we pharmacologically
(Figure 5A–C). Under
isolated the effect of the toxins on nAChRs by using the mAChR-blocker
control conditions, a response in [Ca]i was observed upon the addition of ACh to nAChRs atropine (Figure 5A–C).
(Figure 5A).
Under control conditions, a response in [Ca] i was observed upon the addition of ACh to nAChRs
In cells treated with atropine and 0.5 µM GYM A (Figure 5B, in red) and 0.05 µM GYM A (Figure 5B,
(Figure
in orange),5A).a In cellsresponse
[Ca] treated with atropine and
was observed. The 0.5subsequent
µM GYM A (Figure 5B,ofinACh
application red) induced
and 0.05 noµMfurther
GYM
i
A (Figurein5B,
increase [Ca]in .orange), a [Ca]i response was observed. The subsequent application of ACh induced
i For 0.005 µM GYM A (Figure 5B, in blue), only a slight increase of FI (~10%) was
no further increase
observed when the toxin was in [Ca] i. For 0.005 µM GYM A (Figure 5B, in blue), only a slight increase of FI
added along with atropine. Upon application of ACh (Figure 5B, in
blue), [Ca]i increased further the
(~10%) was observed when (~30%toxin was added
FI increase). along
When SPXwith atropine.
1 (0.5, Upon
0.05, and application
0.005; Figure 5C, ofinACh
red,
(Figure 5B, in blue), [Ca] i increased further (~30% FI increase). When SPX 1 (0.5, 0.05, and 0.005; Figure
orange, and blue, respectively) was applied together with atropine, an increase in [Ca]i was observed
5C,
at allinthree
red,concentrations.
orange, and blue, Upon respectively)
applicationwas applied
of ACh, together with
no additional [Ca]iatropine,
responsean increase
was observed in in
[Ca]
0.5i
was observed at all three concentrations. Upon application of ACh, no additional
and 0.05 µM SPX 1-treated cells. However, in cells treated with 0.005 µM SPX 1 (Figure 5C, in blue), [Ca] i response was
observed
an increaseinin 0.5[Ca]
and by 0.05ACh
µM was SPX evident.
1-treated cells. However, in cells treated with 0.005 µM SPX 1 (Figure
i
5C, in blue), an increase in [Ca] i by ACh was evident.
The effect of the toxins on mAChRs was investigated by adding nAChR-blocker tubocurarine.
Under The effectconditions,
control of the toxins on mAChRs
a response was investigated
in [Ca] by adding nAChR-blocker tubocurarine.
i was observed upon the addition of ACh to mAChRs
Under control conditions, a response in [Ca]i was observed upon the addition of ACh to mAChRs
(Figure 5D). In cells treated with 0.5, 0.05, and 0.005 µM GYM A, a dose-dependent increase of [Ca]i was
(Figure 5D). In cells treated with 0.5, 0.05, and 0.005 µM GYM A, a dose-dependent increase of [Ca]i
observed (Figure 5E, in red, orange, and blue, respectively). At the highest concentration used in this
was observed (Figure 5E, in red, orange, and blue, respectively). At the highest concentration used in
study (0.5 µM), no further [Ca]i response was observed after additional ACh was applied (Figure 5E,
this study (0.5 µM), no further [Ca]i response was observed after additional ACh was applied (Figure
in red). For the two lower concentrations, 0.05 and 0.005 µM, an increase of [Ca]i (~20% FI increase)
5E, in red). For the two lower concentrations, 0.05 and 0.005 µM, an increase of [Ca]i (~20% FI increase)
was observed (Figure 5E, in orange and blue, respectively). A different response was observed when
was observed (Figure 5E, in orange and blue, respectively). A different response was observed when
SPX 1 was applied on mAChRs. A decrease of [Ca]i (~5–10% FI) was measured in cells treated with
SPX 1 was applied on mAChRs. A decrease of [Ca]i (~5–10% FI) was measured in cells treated with
SPX 1 (Figure 5F, in red, orange, and blue, respectively). In cells treated with 0.5 and 0.05 µM SPX 1
SPX 1 (Figure 5F, in red, orange, and blue, respectively). In cells treated with 0.5 and 0.05 µM SPX 1
(Figure 5F, in red and orange, respectively), the addition of ACh resulted in no further change in [Ca]i .
(Figure 5F, in red and orange, respectively), the addition of ACh resulted in no further change in
In cells treated with 0.005 µM SPX 1 (Figure 5F, in blue), however, the addition of ACh induced a [Ca]i
[Ca]i. In cells treated with 0.005 µM SPX 1 (Figure 5F, in blue), however, the addition of ACh induced
elevation (~+40% FI).
a [Ca]i elevation (~+40% FI).Toxins 2020, 12, 751 5 of 11
Toxins 2020, 12, 751 5 of 11
Figure 5. [Ca]i changes induced by acetylcholine (ACh), GYM A, and SPX 1 through pharmacologically isolated nicotinic acetylcholine receptors (nAChRs) or
Figure 5. [Ca]
muscarinic i changes induced by acetylcholine (ACh), GYM A, and SPX 1 through pharmacologically isolated nicotinic acetylcholine receptors (nAChRs) or
AChRs (mAChRs). (A) [Ca]i level changes in cells pretreated with only mAChR-blocker atropine and (B) atropine with GYM A in the concentrations
0.005 µM (blue), 0.05 (mAChRs).
muscarinic AChRs µM (orange),(A) [Ca]
and i level changes in cells pretreated with only mAChR-blocker atropine and (B) atropine with GYM A in the concentrations
0.5 µM (red) followed by the application of ACh. (C) [Ca]i level changes in cells pretreated with mAChR-blocker atropine and
0.005 µM (blue), 0.05 µM (orange), and 0.5 µM (red) followed by the application of ACh. (C) [Ca]i level changes in cells pretreated with mAChR-blocker atropine
SPX 1 in the concentrations 0.005 µM (blue), 0.05 µM (orange), and 0.5 µM (red) followed by the application of ACh. (D) [Ca]i level changes in cells pretreated with
and SPX 1 in the concentrations 0.005 µM (blue), 0.05 µM (orange), and 0.5 µM (red) followed by the application of ACh. (D) [Ca]i level changes in cells pretreated
only nAChR-blocker tubocurarine and (E) tubocurarine with GYM A in the concentrations 0.005 µM (blue), 0.05 µM (orange), and 0.5 µM (red) followed by the
with only nAChR-blocker tubocurarine and (E) tubocurarine with GYM A in the concentrations 0.005 µM (blue), 0.05 µM (orange), and 0.5 µM (red) followed by
application of ACh. (F) [Ca]i level changes in cells pretreated with nAChR-blocker tubocurarine and SPX 1 A in the concentrations 0.005 µM (blue), 0.05 µM (orange),
the application of ACh. (F) [Ca]i level changes in cells pretreated with nAChR-blocker tubocurarine and SPX 1 A in the concentrations 0.005 µM (blue), 0.05 µM
and 0.5 µM (red), followed by the application of ACh. n = 10.
(orange), and 0.5 µM (red), followed by the application of ACh. n = 10.Toxins 2020, 12, 751 6 of 11
Toxins 2020, 12, 751 6 of 11
In order to rule out effects of the toxins on cellular targets involved in [Ca]i signaling other than
AChRs, either
In order to GYM A or
rule out SPXof
effects 1 the
(0.5toxins
µM) was appliedtargets
on cellular to the involved
cells while simultaneously
in [Ca] inhibiting
i signaling other than
nAChRs and mAChRs. In both treatments, no obvious change in [Ca]i was observed. In addition, no
AChRs, either GYM A or SPX 1 (0.5 µM) was applied to the cells while simultaneously inhibiting
[Ca]i response
nAChRs was observed
and mAChRs. after
In both ACh addition
treatments, (Figure change
no obvious 6A,B). in [Ca] was observed. In addition,
i
no [Ca]i response was observed after ACh addition (Figure 6A,B).
Figure 6. (A) [Ca]i level changes in cells pretreated with mAChR-blocker atropine and nAChR-blocker
Figure 6. (A) [Ca]i level changes in cells pretreated with mAChR-blocker atropine and nAChR-blocker
tubocurarine with 0.5 µM GYM A and (B) SPX 1. n = 10.
tubocurarine with 0.5 µM GYM A and (B) SPX 1. n = 10.
3. Discussion
3. Discussion
3.1. GYM A and SPX 1 Do not Inhibit the Influx of [Ca]i through Voltage-Gated Ca Channels
3.1. GYM A and SPX 1 Do not Inhibit the Influx of [Ca]i through Voltage-Gated Ca Channels
First, we excluded the influence of voltage-gated Ca channels on toxin-induced [Ca]i changes.
During First , we excluded voltage-gated
depolarization, the influence Ca of voltage-gated
channels mediate Ca channels
the influxon Ca2+ into the cell.
of toxin-induced [Ca]Free Ca2+
i changes.
isDuring
removed depolarization, voltage-gated
from the cytosol by uptake Cainto
channels mediate the influx
the endoplasmic of Caand
reticulum 2+ into the cell. Freeand
mitochondria Ca2+byis
removed mechanisms
extrusion from the cytosol
such asbycalcium
uptakepumps
into the
andendoplasmic
ion exchangers reticulum andi measurements
[28,29]. [Ca] mitochondria and duringby
extrusion mechanisms
depolarization in controls such as calcium
as well as in GYMpumps A- and SPX ion exchangers
1-exposed cells[28,29]. [Ca]i that
indicate measurements
the toxins
during
do depolarization
not reduce the influxinofcontrols as wellvoltage-gated
[Ca]i through as in GYM A-Caand SPX 1-exposed
channels. The gradual cells decrease
indicate in that thei
[Ca]
toxins do depolarization
following not reduce theininflux
GYMof A-[Ca]
andi through voltage-gated
SPX 1-treated Ca channels.
cells (Figure The gradual
3B,C, respectively) decrease
indicates in
either
[Ca]
an i following
inhibition depolarization
of transport in GYM
proteins A-2+
(e.g., Ca and SPX 1-treated
ATPases) that remove Ca2+ from
cells (Figure 3B,C,therespectively)
cell or that theindicates
influx
of Ca2+an
either inhibition
into the cell isofmediated
transportby proteins (e.g., Ca
other means 2+ ATPases)
[28]. Since AChRs thatdepolarize
remove Cathe 2+ from the membrane
cellular cell or that
the influx
and permeate of Ca 2+2+
Ca into the
into cell
the is mediated
cells [23], and byGYM other
A and means
SPX[28]. Since
1 bind to AChRs depolarize
those receptors, the cellular
AChRs were
membrane and permeate Ca 2+
chosen as targets for further experiments.into the cells [23], and GYM A and SPX 1 bind to those receptors,
AChRs were chosen as targets for further experiments.
3.2. GYM A and SPX 1 Alter [Ca]i
3.2. GYM A and SPX
The binding of an1 Alter
agonist[Ca] i
such as ACh to AChRs initiate the influx of Ca2+ into the cell. GYM A
or SPX The1 tested
binding here had
of an the same
agonist sucheffect:
as ACh thetoapplication of 0.05,
AChRs initiate 0.5 µMofGYM
the influx A, and
Ca2+ into the 0.5
cell.µM
GYM SPX A
1orinduced [Ca]i elevations
SPX 1 tested here had the (Figure
same 4B, in red
effect: the and orange of
application and Figure
0.05, 0.5 µM4C,GYM
in red). The 0.5
A, and activation
µM SPXof1
AChRs
inducedby either
[Ca] GYM A(Figure
i elevations or SPX4B,1, in
particularly
red and orange at theand
concentration
Figure 4C, inofred).
0.5 The may be the
µM, activation of reason
AChRs
why a slow andAgradual decrease in [Ca] was observed inof the +
by either GYM or SPX 1, particularly at ithe concentration 0.5KµM,-depolarized
may be thecells (Figure
reason why a3B,C).
slow
The response observed in [Ca] infers that toxins mimic ACh and thereby initiate the influx of Ca 2+
and gradual decrease in [Ca]i iwas observed in the K -depolarized cells (Figure 3B,C). The response
+
into the cell.
observed The iresulting
in [Ca] infers that AChR-toxin
toxins mimic complex
ACh and further inhibits
thereby a subsequent
initiate activation
the influx of Ca2+ intoofthe
AChRs by
cell. The
ACh (Figure
resulting 4B, in redcomplex
AChR-toxin and orange andinhibits
further Figure a4C, in red). Both
subsequent toxinsof
activation activated
AChRs by AChRs
ACh at varying
(Figure 4B,
concentrations, with GYM A acting as a more potent activator than SPX 1.
in red and orange and Figure 4C, in red). Both toxins activated AChRs at varying concentrations,Compared to GYM A (at
0.05
withµM,GYMFigure 4B, inas
A acting orange),
a moreSPX 1 ofactivator
potent a higher concentration (at 0.5 µM,toFigure
than SPX 1. Compared GYM4C in red)
A (at 0.05was
µM,needed
Figure
to 2+ influx into the cell. At the lowest concentrations (0.005 µM) of both toxins,
4B,induce comparable
in orange), SPX 1 Caof a higher concentration (at 0.5 µM, Figure 4C in red) was needed to induce
no activation Ca
comparable of 2+
AChRs
influxwasintomeasurable.
the cell. At the lowest concentrations (0.005 µM) of both toxins, no
activation of AChRs was measurable.
3.3. GYM A and SPX 1 Show a Similar Effect on nAChRs and a Differential Response to mAChRs
The difference in response in [Ca]i between the atropine-treated cells (Figure 5A) and
atropine-toxin-treated cells indicate an interaction of GYM A (Figure 5B) and SPX 1 (Figure 5C)Toxins 2020, 12, 751 7 of 11
with nAChRs. Both toxins activate nAChRs, induce entry of Ca2+ into the cells, and block the binding
of ACh to nAChRs. At low concentrations (0.005 µM), activation of nAChRs appears in SPX 1-
(Figure 5C, in blue) but not in GYM A-treated cells (Figure 5B, in blue), demonstrating dose-dependent
differences. For both toxins, low concentrations did not inhibit the activation of nAChRs by ACh,
resulting in an increase in [Ca]i . Our results support previous studies that showed SPX to have a
higher efficacy for nAChRs than GYM A (2–15 fold difference) [16,17].
The contrasting response between cells treated only with tubocurarine and cells that were
additionally treated with GYM A or SPX 1 suggests that toxins may have also interacted with mAChRs.
GYM A activates mAChRs dose-dependently. ACh only activates mAChRs at low concentrations
of GYM A (0.005 µM) (Figure 5E, in blue) where an inhibition of a constitutive activity of receptors
may have happened. For SPX 1, a decrease in [Ca]i was observed that could have been caused by an
inhibition of a constitutive activity of mAChRs [30]. Following the observed decrease in [Ca]i upon
addition of SPX 1, high and moderate concentrations of the toxin inhibit the subsequent activation of
mAChRs by ACh (Figure 5F, in red and orange). A low concentration of SPX 1, on the other hand, had
no effect (Figure 5F, in blue). GYM A [17] and SPX 1 [15,17] have previously been described to have
a low ability to interact with mAChRs, with the latter having a lower affinity [17]. Here, we show a
differential effect of GYM A and SPX 1 on mAChRs.
3.4. GYM A and SPX Alter [Ca]i through nAChRs and mAChRs
At a concentration of 0.5 µM, GYM A and SPX 1 activate nAChR (GYM A also activates mAChRs)
and inhibit the response to ACh. [Ca]i was not affected by GYM A and SPX 1 (0.5 µM) when both
AChR subtypes were blocked simultaneously by atropine and tubocurarine (Figure 6A,B). This shows
that nAChRs and mAChRs must be the primary targets of GYM A and SPX 1 related to [Ca]i signaling.
Previous studies have demonstrated that both GYM A and SPX 1 acted as antagonists to
nAChRs [14–18], while neither interacted strongly with mAChRs [15,17]. Here, we show that GYM A
and SPX 1 activate nAChR at 0.5 µM and dose-dependently interact with a successive ACh stimulation.
We show that GYM A additionally activates mAChRs at 0.5 µM demonstrating that mAChRs are also
a target of GYM A. This may be due to different receptor subtypes present in PC12 cells (nAChR
subtypes α3, α5, β2–β4 [26], and atypical mAChR subtypes [27]) compared to subtypes used in
studies published previously (nAChR subtypes α7, α12 β1γδ, α7-5HT3 , α3β2 and α4β2, and M1 –M5
mAChR subtypes) [14–18]. To investigate structure–activity relationship and to investigate functional
measurements due to desensitization mechanism, future electrophysiological studies are required.
The potentiation of nAChRs by atropine is described for specific subunits of the receptor (α4β4) [31],
which are to our knowledge not present in PC12 cells. A potential interaction site of atropine with
nAChRs (inhibition) is the α3β4 subunit, which is present in PC12 cells [32]. It is therefore possible
that in our experiment atropine potentiated the effect of SPX 1 on certain nAChR subunits and has a
small effect during application of a low dose of GYM A. This provides a baseline for future studies.
The response of cells following direct application of higher concentrations of toxins has not been
described previously. This study demonstrates GYM A and SPX 1 to dose-dependently interact with
AChRs of neuroendocrine PC12 cells. Furthermore, SPX 1 has the capability to inhibit the constitutive
activity of mAChRs.
The activation of receptors at high toxin concentrations and inhibition of subsequent activation by
ACh at lower concentrations hint at the cooperativity of molecules. In this case, e.g., one molecule binds
to one receptor’s binding site, preventing further activation by ACh, and when more toxin molecules
together bind to more receptor sites, this leads to activation of receptors. The cooperativity can be
calculated by the steepness of dose response relationships. This is unfortunately not feasible for our
data due to limited amounts of compounds being available and therefore limited dose-response-related
data points.
In summary, we show that under physiological conditions, both toxins act as agonists for nAChRs
and that GYM A induces an increase in [Ca]i through mAChRs. We provide clear evidence that GYMToxins 2020, 12, 751 8 of 11
A and SPX 1 mimic the action of ACh, preventing further activation of receptors. The macrocyclic
nature of GYM A and SPX 1 allows the toxins to conform to the same binding sites of nAChRs with the
cyclic imine as the pivot point of the molecule [16]. Absence of a triketal ring system may provide a
basis for selective activation of mAChRs by GYM A as compared to SPX 1. The difference in activity
regarding nAChRs and mAChRs observed between the toxins may be due to the subtype selectivity of
these receptors. Subtypes of nAChRs, which can be homomeric or heteromeric in form, have different
permeabilities to Ca2+ and affinities to ACh [33]. mAChR subtypes couple to different G-protein types,
initiating different secondary induction pathways [34]. Structural conformation of the toxins (presence
or absence of a triketal ring system) as well as of the AChR subunits plays crucial roles in the selectivity
and specificity of toxin–receptor interactions.
4. Materials and Methods
4.1. Extraction and Purification of Gymnodimine A and 13-Desmethyl Spirolide C
GYM A and SPX 1 were isolated from clonal isolates of Alexandrium ostenfeldii (OKNL 48) collected
from Ouwerkerkse Kreek, the Netherlands [5]. The extraction and purification of the toxins was
conducted using the procedure described by Zurhelle et al. [9]. In brief, the microalgal culture
was treated with acetone (7% final concentration) and the toxins were extracted using conditioned
HP-20 (Diaon Supelco, Steinheim, Germany). The resin was eluted with methanol, and the eluate
was dried under vacuo before loading into the preparative reversed phase chromatography (C18,
25 × 310 mm, 5 mL min−1 ). The elution was done with a stepwise gradient from aqueous:acetonitrile
(ACN) (water/ACN, 80:20 v/v) to 100% ACN.
4.2. PC 12 Culture Methods
Prior to cell cultivation, cover slips were placed into the Petri dishes, coated with 0.5 mg mL−1
collagen A (Biochrom, Berlin, Germany), and dried for 24 h. The Petri dishes were filled with 100 mL
of culture medium composed of Roswell Park Memorial Institute (RPMI) medium 1640, 10% fetal calf
serum, 5% horse serum, and 100 units penicillin/streptomycin per milliliter. Rat pheochromocytoma
(PC12) cells (ATCC, Wesel, Germany) were then seeded into thus-prepared Petri dishes. The cells were
kept in an incubator at 37 ◦ C, 90% humidity, and 5% CO2, and medium changes were conducted after
three to five days of cultivation.
4.3. Fluorimetric Measurements of Intracellular Calcium Levels
For fluorometric measurements of [Ca]i , cover slips adhered with PC12 cells were incubated
in Na+ buffer (in mM: 125 NaCl, 2.5 KCl, 1 MgCl2 , 2 CaCl2 , 1.3 NaH2 PO4 , 30 Glucose, and 26 Na
HEPES (4-(2-hydroxyethyl)-1-piperazineethanesulfonic acid)) with a final concentration of 10 µM Ca2+
fluorescent dye, Flou-3 acetoxymethylester (Flou-3 AM), for 1 h at 37 ◦ C. Then, the physiological Na+
buffer was removed and replaced with fresh Na+ buffer. The cell fluorescence was monitored using an
inverted confocal laser scanning microscope (Leica SP5, Wetzlar, Germany) equipped with an argon ion
laser for fluorescence excitation (exc 488 nm, em 520–550). Laser settings were identical in all runs and
images were taken every second. The beam of the laser scanned the object plane through a Zeiss (Jena,
Germany) 20x water immersion objective. We constructed a plastic inlay to reduce the exchangeable
volume to 250 µL, to increase the speed of solution exchange and to minimize the amount of toxins
used in the experiment. To increase speed, the compounds were manually pipetted, instead of using
pumping or gravity filtration. The experiment took place in an Utermöhl chamber.
10 PC12 cells (n = 10) were selected in the cover slips and were analyzed independently using region
of interest (ROI)s in the Leica Application Suite Advanced Fluorescence (LAS AF, Wetzlar, Germany)
software. The dye intensity represents the calcium concentration inside the cell. Ten individual cells
were measured simultaneously in all treatments. The cellular fluorescence emission of the selected
PC12 cells was normalized by dividing the fluorescence measured by the initial values (t0) and thenToxins 2020, 12, 751 9 of 11
multiplying them by 100. All experiments were replicated using a different cell culture batch obtaining
comparable results.
4.4. [Ca]i Measurements Using K+ Depolarization
Cover slips with adhered cells were mounted on the microscope using a chamber with a volume
capacity of 250 µL. The fluorescence of the PC12 cells was measured, and cells were subsequently
depolarized by submerging K+ buffer (in mM: 55 NaCl, 80 KCl, 1 MgCl2 , 2 CaCl2 , 1.3 NaH2 PO4 ,
30 Glucose, 26 Na HEPES) through manual pipetting. The effects of the toxin were determined by
spiking the K+ buffer with GYM A or SPX 1 reaching a final concentration of 0.5 µM.
4.5. [Ca]i Measurements with Application of Acetylcholine
Cells were stimulated by application of 100 µM Acetylcholine-Cl (ACh) (Sigma, Darmstadt,
Germany) in Na+ buffer (described in Section 4.3). The effects of the toxin were determined by spiking
the buffer with either GYM A or SPX 1 resulting in final concentrations of 0.005, 0.05, and 0.5 µM.
In addition, AChR subtype blockers, atropine and turbocurarine, were utilized in order to investigate
the mechanism of action against nAChR and mAChR, respectively. Both substances were used at a
final concentration of 100 µM.
Author Contributions: Conceptualization, B.K., U.T., J.T. and U.B.; Data curation, J.A.N.; Investigation, J.A.N. and
U.B.; Methodology, J.A.N., C.Z. and U.B.; Supervision, U.B.; Visualization, J.A.N.; Writing—original draft,
J.A.N. and B.K.; Writing—review & editing, B.K., U.T., J.T. and U.B. All authors have read and agreed to the
published version of the manuscript.
Funding: Financial support was provided by the PACES research program of the Alfred Wegener Institute
Helmholtz Centre for Polar and Marine Research. C.Z. was funded by the BMBF (DE) project PROMISE as part
of ERA4CS, an ERA-NET marine Biotech initiative with co-funding by the European Union (Grant 031B0561).
We acknowledge support by the Open Access Publication Funds of Alfred-Wegener-Institut Helmholtz-Zentrum
für Polar- und Meeresforschung.
Conflicts of Interest: The authors declare no conflict of interest.
References
1. Gobler, C.J. Climate change and harmful algal blooms: Insights and perspective. Harmful Algae 2020, 91.
[CrossRef] [PubMed]
2. Guéret, S.M.; Brimble, M.A. Synthetic studies toward the spiroimine unit of the spirolides. Pure Appl. Chem.
2011, 83, 425–433. [CrossRef]
3. Cembella, A.D.; Lewis, N.I.; Quilliam, M.A. The marine dinoflagellate Alexandrium ostenfeldii (Dinophyceae)
as the causative organism of spirolide shellfish toxins. Phycologia 2000, 39, 67–74. [CrossRef]
4. Van Wagoner, R.M.; Misner, I.; Tomas, C.R.; Wright, J.L.C. Occurrence of 12-methylgymnodimine in a
spirolide-producing dinoflagellate Alexandrium peruvianum and the biogenetic implications. Tetrahedron Lett.
2011, 52, 4243–4246. [CrossRef]
5. Van de Waal, D.B.; Tillmann, U.; Martens, H.; Krock, B.; van Scheppingen, Y.; John, U. Characterization of
multiple isolates from an Alexandrium ostenfeldii bloom in The Netherlands. Harmful Algae 2015, 49, 94–104.
[CrossRef]
6. Harju, K.; Koskela, H.; Kremp, A.; Suikkanen, S.; de la Iglesia, P.; Miles, C.O.; Krock, B.; Vanninen, P.
Identification of gymnodimine D and presence of gymnodimine variants in the dinoflagellate Alexandrium
ostenfeldii from the Baltic Sea. Toxicon 2016, 112, 68–76. [CrossRef]
7. Martens, H.; Tillmann, U.; Harju, K.; Dell’Aversano, C.; Tartaglione, L.; Krock, B. Toxin Variability Estimations
of 68 Alexandrium ostenfeldii (Dinophyceae) Strains from The Netherlands Reveal a Novel Abundant
Gymnodimine. Microorganisms 2017, 5, 29. [CrossRef]
8. Zurhelle, C.; Nieva, J.; Tillmann, U.; Harder, T.; Krock, B.; Tebben, J. Identification of Novel Gymnodimines
and Spirolides from the Marine Dinoflagellate Alexandrium ostenfeldii. Mar. Drugs 2018, 16, 446. [CrossRef]Toxins 2020, 12, 751 10 of 11
9. Seki, T.; Satake, M.; MacKenzie, L.; Kaspar, H.F.; Yasumoto, T. Gymnodimine, a new marine toxin of
unprecedented structure isolated from New Zealand oysters and the dinoflagellate, Gymnodinium sp.
Tetrahedron Lett. 1995, 36, 7093–7096. [CrossRef]
10. Van Wagoner, R.M.; Satake, M.; Wright, J.L.C. Polyketide biosynthesis in dinoflagellate: What makes it
different? Nat. Prod. Rep. 2014, 31, 1101. [CrossRef]
11. Otero, P.; Alfonso, A.; Rodríguez, P.; Rubiolo, J.A.; Cifuentes, J.M.; Bermúdez, R.; Vieytes, M.R.; Botana, L.M.
Pharmacokinetic and toxicological data of spirolides after oral and intraperitoneal administration. Food Chem.
Toxicol. 2012, 50, 232–237. [CrossRef] [PubMed]
12. Gill, S.; Murphy, M.; Clausen, J.; Richard, D.; Quilliam, M.; MacKinnon, S.; LaBlanc, P.; Mueller, R.; Pulido, O.
Neural Injury Biomarkers of Novel Shellfish Toxins, Spirolides: A Pilot Study Using Immunochemical and
Transcriptional Analysis. Neurotoxicology 2003, 24, 593–604. [CrossRef]
13. Munday, R.; Towers, N.R.; Mackenzie, L.; Beuzenberg, V.; Hollan, P.T.; Miles, C.O. Acute toxicity of
gymnodimine to mice. Toxicon 2004, 44, 173–178. [CrossRef] [PubMed]
14. Kharrat, R.; Servent, D.; Girard, E.; Ouanounou, G.; Amar, M.; Marrouchi, R.; Benoit, E.; Molgo, J. The marine
phycotoxin gymnodimin targets muscular and neuronal nicotinic acetylcholine receptor subtypes with high
affinity. J. Neurochem. 2008, 107, 952–963. [CrossRef]
15. Aráoz, R.; Ouanounou, G.; Iorga, B.I.; Goudet, A.; Alili, D.; Amar, M.; Benoit, E.; Molgó, J.; Servent, D.
The Neurotoxic Effect of 13,19-Didesmethyl and 13-Desmethyl Spirolide C Phycotoxins Is Mainly Mediated
by Nicotinic Rather Than Muscarinic Acetylcholine Receptors. Toxicol. Sci. 2015, 147, 156–157. [CrossRef]
16. Bourne, Y.; Radić, Z.; Aráoz, R.; Talley, T.T.; Benoit, E.; Servent, D.; Taylor, P.; Molgó, J.; Marchot, P. Structural
determinants in phycotoxins an AChBP conferring high affinity binding and nicotinic AChR antagonism.
Proc. Natl. Acad. Sci. USA 2010, 107, 6076–6081. [CrossRef]
17. Hauser, T.A.; Hepler, C.D.; Kombo, D.C.; Grinevich, V.P.; Kiser, M.N.; Hooker, D.N.; Zhang, J.; Mountfort, D.;
Selwood, A.; Akireddy, S.R.; et al. Comparison of acetylcholine receptor interactions of the marine toxins,
13-desmethylspirolide C and gymnodimine. Neuropharmacology 2012, 62, 2239–2250. [CrossRef]
18. Wandscheer, C.B.; Vilariño, N.; Espiña, B.; Louzao, M.C.; Botana, L.M. Human muscarinic acetylholine
receptors are a target of the marine toxin 13-desmethyl C spirolide. Chem. Res. Toxicol. 2010, 11, 1753–1761.
[CrossRef]
19. Friis, S.; Mathes, C.; Sunesen, M.; Bowlby, M.R.; Dunlop, J. Characterization of compounds on nicotinic
acetylcholine receptor alpha7 channels using high throughput electrophysiology. J. Neurosci. Methods 2009,
177, 142–148. [CrossRef]
20. Shafer, T.J.; Atchison, W.D. Transmitter, ion channel and receptor properties of pheochromocytoma (PC12)
cells: A model for neurotoxicological studies. Neurotoxicology 1991, 12, 473–492.
21. Seta, K.; Kim, H.W.; Ferguson, T.; Kim, R.; Pathrose, P.; Yuan, Y.; Lu, G.; Spicer, Z.; Millhorn, D.E. Genomic
and Physiological Analysis of Oxygen Sensitivity and Hypoxia Tolerance in PC12 Cells. Ann. N. Y. Acad. Sci.
2002, 971, 379–388. [CrossRef] [PubMed]
22. Catterall, W.A. Structure and function of voltage-gated ion channels. Annu. Rev. Biochem. 1995, 64, 493–531.
[CrossRef] [PubMed]
23. Gotti, C.; Zoli, M.; Clementi, F. Brain nicotinic acetylcholine receptors: Native subtypes and their relevance.
Trends Pharmacol Sci. 2006, 27, 482–491. [CrossRef] [PubMed]
24. Hurst, R.; Rollema, H.; Bertrand, D. Nicotinic acetylcholine receptors: From basic science to therapeutics.
Pharmacol. Therapeut. 2013, 1, 22–54. [CrossRef]
25. Brann, M.R.; Ellis, J.; Jørgensen, H.; Hill-Eubanks, D.; Jones, S.V.P. Chapter 12: Muscarinic acetylcholine
receptor subtypes: Localization and structure/function. Prog. Brain Res. 1993, 98, 121–127. [CrossRef]
26. Takahashi, T.; Yamashita, H.; Nakamura, S.; Ishiguro, H.; Nagatsu, T.; Kawakami, H. Effects of nerve growth
factor and nicotine on the expression of nicotinic acetylcholine receptor subunits in PC12 cells. J. Neurosci.
Sci. 1999, 35, 175–181. [CrossRef]
27. Michel, A.D.; Stefanich, E.; Whiting, R.L. PC12 phaeochromocytoma cells contain an atypical muscarinic
receptor binding site. Br. J. Pharmacol. 1989, 97, 914–920. [CrossRef]
28. Berridge, M.J.; Lipp, P.; Bootman, M.D. The versatility of calcium signaling. Nat. Rev. Mol. Cell Biol. 2000, 1,
11–21. [CrossRef]Toxins 2020, 12, 751 11 of 11
29. Bickmeyer, U.; Grube, A.; Klings, K.W.; Pawlick, J.R.; Köck, M. Siphonodictyal B1 from a Marine Spong
Increases Intracellular Calcium Levels Comparable to Ca2+-ATPase (SERCA) Inhibitor Thapsigargin.
Mar. Biotechnol. 2010, 12, 267–272. [CrossRef]
30. Spalding, T.A.; Burstein, E.S. Constitutive activity of muscarinic acetylcholine receptors. J. Recept. Sig. Transd.
2006, 26, 61–65. [CrossRef]
31. Zwart, R.; Vijverberg, H.P.M. Potentiation and inhibition of neuronal nicotinic receptors by atropine:
Competitive and non-competitive effects. Mol. Pharmacol. 1997, 52, 886–895. [CrossRef] [PubMed]
32. Parker, J.C.; Sarkar, D.; Quick, M.W.; Lester, R.A.J. Interactions of atropine with heterogously expressed and
native α3 subunit-containing nicotine acetylcholine receptors. Br. J. Pharmacol. 2003, 138, 801–810. [CrossRef]
[PubMed]
33. Albuquerque, E.X.; Pereira, E.F.R.; Alkondon, M.; Rogers, S.W. Mammalian Nicotinic Acetylcholine Receptors:
From Structure to Function. Physiol. Rev. 2008, 89, 73–120. [CrossRef] [PubMed]
34. Eglen, R.M. Muscarinic Receptor Subtype Pharmacology and Physiology. Prog. Med. Chem. 2005, 43, 105–136.
[CrossRef]
Publisher’s Note: MDPI stays neutral with regard to jurisdictional claims in published maps and institutional
affiliations.
© 2020 by the authors. Licensee MDPI, Basel, Switzerland. This article is an open access
article distributed under the terms and conditions of the Creative Commons Attribution
(CC BY) license (http://creativecommons.org/licenses/by/4.0/).You can also read