Quantification of Volatile Acetone Oligomers Using Ion-Mobility Spectrometry
←
→
Page content transcription
If your browser does not render page correctly, please read the page content below
Hindawi
Journal of Analytical Methods in Chemistry
Volume 2021, Article ID 6638036, 6 pages
https://doi.org/10.1155/2021/6638036

Research Article
Quantification of Volatile Acetone Oligomers Using
Ion-Mobility Spectrometry

          Tobias Hüppe , Dominik Lorenz, Felix Maurer, Tobias Fink, Ramona Klumpp,
          and Sascha Kreuer
          Center of Breath Research, Department of Anaesthesiology, Intensive Care and Pain Therapy,
          Saarland University Medical Center, Homburg, Saarland 66424, Germany

          Correspondence should be addressed to Tobias Hüppe; tobias.hueppe@uks.eu

          Received 12 November 2020; Accepted 27 July 2021; Published 3 August 2021

          Academic Editor: Krishna K Verma

          Copyright © 2021 Tobias Hüppe et al. This is an open access article distributed under the Creative Commons Attribution License,
          which permits unrestricted use, distribution, and reproduction in any medium, provided the original work is properly cited.
          Background. Volatile acetone is a potential biomarker that is elevated in various disease states. Measuring acetone in exhaled
          breath is complicated by the fact that the molecule might be present as both monomers and dimers, but in inconsistent ratios.
          Ignoring the molecular form leads to incorrect measured concentrations. Our first goal was to evaluate the monomer-dimer ratio
          in ambient air, critically ill patients, and rats. Our second goal was to confirm the accuracy of the combined (monomer and dimer)
          analysis by comparison to a reference calibration system. Methods. Volatile acetone intensities from exhaled air of ten intubated,
          critically ill patients, and ten ventilated Sprague-Dawley rats were recorded using ion-mobility spectrometry. Acetone con-
          centrations in ambient air in an intensive care unit and in a laboratory were determined over 24 hours. The calibration reference
          was pure acetone vaporized by a gas generator at concentrations from 5 to 45 ppbv (parts per billion by volume). Results. Acetone
          concentrations in ambient laboratory air were only slightly greater (5.6 ppbv; 95% CI 5.1–6.2) than in ambient air in an intensive
          care unit (5.1 ppbv; 95% CI 4.4–5.5; p < 0.001). Exhaled acetone concentrations were only slightly greater in rats (10.3 ppbv; 95% CI
          9.7–10.9) than in critically ill patients (9.5 ppbv; 95% CI 7.9–11.1; p < 0.001). Vaporization yielded acetone monomers
          (1.3–5.3 mV) and dimers (1.4–621 mV). Acetone concentrations (ppbv) and corresponding acetone monomer and dimer in-
          tensities (mV) revealed a high coefficient of determination (R2 � 0.96). The calibration curve for acetone concentration (ppbv) and
          total acetone (monomers added to twice the dimers; mV) was described by the exponential growth 3-parameter model, with an
          R2 � 0.98. Conclusion. The ratio of acetone monomer and dimer is inconsistent and varies in ambient air from place-to-place and
          across individual humans and rats. Monomers and dimers must therefore be considered when quantifying acetone. Combining
          the two accurately assesses total volatile acetone.

1. Introduction                                                          clinicians and patients. For example, diabetics might use
                                                                         expired breath to determine whether they are becoming
Acetone is one of the most volatile molecules in human                   ketotic.
breath and responsible for the odor of decaying apple in                     Measuring acetone in exhaled air is complicated by the
expired air. Decarboxylation of acetoacetate and oxidation               fact that the molecule might be present as both monomers
of isopropanol are the two major physiological sources of                and dimers [8], and the relationship is inconsistent. Our first
acetone in humans [1]. Acetone is an important physio-                   goal was therefore to evaluate the monomer-dimer ratio in
logical marker of lipolysis starvation [2]. It is elevated in            ambient air of an intensive care unit and a laboratory, as well
various disease states including diabetes mellitus [3], iso-             as in exhaled breath of critically ill patients and rats.
propyl-alcohol intoxication [4], ketogenic and Atkins diets                  To the extent that the monomer-dimer ratio varies,
[5], lung tumors [6], and infections [7]. Assessing blood                accurate assessment of total acetone in expired breath will
acetone concentration from exhaled gas might be useful for               require determining the concentrations of each species and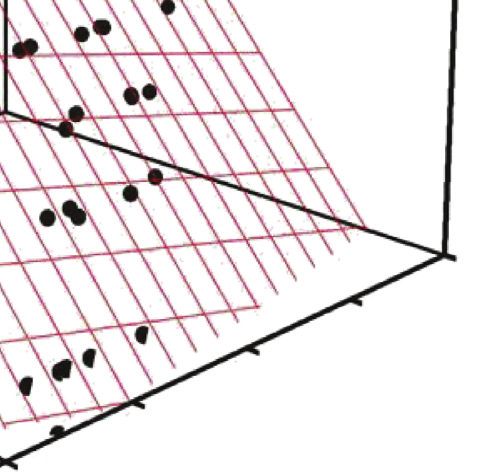
2                                                                                 Journal of Analytical Methods in Chemistry

adding the monomer concentration to twice the dimer               tube was connected near each patient’s endotracheal tube.
concentration. Our second goal was thus to confirm that this       10 ml mixed inspired and expired gas samples were aspirated
combined analysis approach is accurate using a reference          from the breathing circuit at 30-minute intervals for a period
calibration system.                                               of twelve hours.
    Our study addresses two important issues: (1) simple
quantification of volatile acetone oligomers in exhaled air
using ion-mobility spectrometry and (2) quantification of
                                                                  2.5. Animals. With authorization by the local agency of
accuracy by comparison to values from a calibration gas
                                                                  animal protection (approval number 41/2014, Ministerium
generator. Our results will facilitate future investigations of
                                                                  für Umwelt und Verbraucherschutz, Saarbrücken, Ger-
volatile acetone as a biomarker.
                                                                  many) and in accordance with the German Animal Welfare
                                                                  Act and ARRIVE guidelines, we studied ten male Sprague-
2. Materials and Methods                                          Dawley rats (200–300 g bodyweight, age 8–10 weeks, Charles
2.1. Multicapillary Column Ion-Mobility Spectrometry.             River, Sulzfeld, Germany). Each was anaesthetized, tra-
Volatile acetone intensities were recorded as described           cheotomized, and ventilated for a period of 24 hours as
previously using a MCC-IMS (BreathDiscovery, B&S                  described previously [9, 10]. 10 ml expired gas samples were
Analytik, Dortmund, Germany) [9, 10]. Preseparation of            aspirated from the ventilator tubing system through poly-
volatile acetone by multicapillary columns resulted in            tetrafluoroethylene tubes every 20 min and analyzed using
compound retention time (RT), analysis by ion-mobility            MCC-IMS [13].
spectrometry in drift time (1/K0). Acetone monomers and
dimers were identified in the chromatogram by Visual Now
3.6 (B&S Analytik, Dortmund, Germany) and comparison              2.6. Statistics. We used SigmaPlot (version 12.5, Systat
with an existing database (BS-MCC/IMS-analytes database,          Software, Erkrath, Germany) for statistical analyses. The
version 1209, B&S Analytik, Dortmund, Germany) [11] as            correlation between voltages and concentrations was cal-
well as pure substance measurements. Intensity of total           culated using Pearson correlation. Monomer and dimer
volatile acetone was calculated:                                  fraction versus concentration in ppbv was plotted on a 3D-
    Total acetone intensity (V) � acetone monomer intensity       graph. We used t or Mann–Whitney rank sum tests to
(V) + (2 ∗ acetone dimer intensity (V)).                          compare ambient acetone concentrations from intensive
                                                                  care unit and laboratory air. To compare patients and rats,
                                                                  we used one-way ANOVA. A two-tailed p value < 0.05 was
2.2. Calibration Gas Generator. Acetone pure substance
                                                                  considered statistically significant.
(99.9%, Sigma Aldrich, Seelze, Germany) was vaporized at a
relative humidity of 100% and a temperature of 37°C in steps
of 5 ppbv and concentrations ranging from 5 to 45 ppbv using
a calibration gas generator (HovaCAL, Inspire Analytical          3. Results
Systems, Oberursel, Germany) as previously described [12].        Acetone concentration in ambient air was slightly higher in
At each concentration, five 10 ml gas samples were aspirated       laboratory (5.6 ppbv; 95% CI 5.1–6.2) than in intensive care
from the calibration gas generator through a polytetra-           unit (5.1 ppbv; 95% CI 4.4–5.5; p < 0.001). Intensities of
fluoroethylene tube (Bohlender, Grünsfeld, Germany). Blank        monomers and dimers as well as dimer fraction and con-
measurements were interposed between each concentration           centrations of volatile acetone in ambient air are presented
step.                                                             in Table 1.
                                                                       Exhaled acetone concentration was slightly higher in rats
2.3. Room Air. Acetone concentrations in ambient air from         (10.3 ppbv; 95% CI 9.7–10.9) than in critically ill patients
an intensive care unit and from a laboratory were deter-          (9.5 ppbv; 95% CI 7.9–11.1; p < 0.001). Seven patients had
mined using MCC-IMS, each over a period of 24 hours with          concentrations between 4 and 6 ppbv, whereas three patients
a sampling interval of 30 minutes.                                displayed substantially greater concentrations in exhaled air
                                                                  (8.3, 12.9, and 48.3 ppbv). Dimer fraction was comparable in
                                                                  the rats (95%, 95% CI 95-96) and critically ill patients (90%,
2.4. Patients. With approval from the responsible ethics          95% CI 89–91) (Table 1).
committee (identification number 232/14, Ärztekammer                   Acetone vaporization resulted in 45 data triplets con-
Saarland, Saarbrücken, Germany) and in accordance with           taining concentration (ppbv), monomer intensity (volts),
the STROBE guidelines, volatile acetone concentrations            and dimer intensity (volts). Monomers yielded intensities
were evaluated in ten sedated, intubated, and mechanically        from 1.3 to 5.3 mV and dimers intensities from 1.4 to
ventilated adults from a surgical intensive care unit. Written    621 mV. Calibration curve of acetone concentration (ppbv)
consent was obtained from either patients or legal guardians.     vs. total acetone intensity (mV) fits an exponential growth 3-
    Patients were ventilated with an intensive care respirator    parameter model with an R2 � 0.98 (Figure 1).
(EVITA 4, Dräger, Lübeck, Germany) with ventilation pa-              Correlation analysis of calibration of monomer (mV)
rameters and oxygen concentrations adjusted to maintain           versus dimer (mV) versus concentration (ppbv) revealed the
physiological blood gas values. A polytetrafluoroethylene          coefficient of determination of R2 � 0.96 (Figure 2).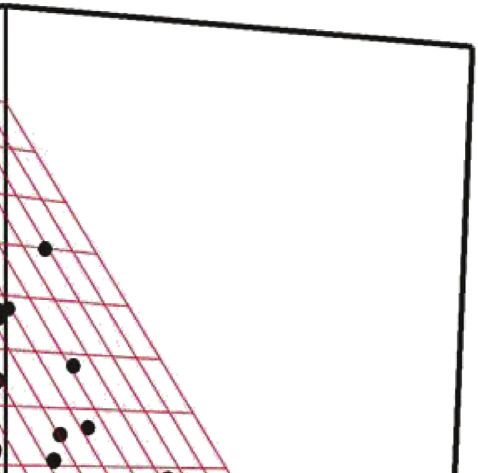
Journal of Analytical Methods in Chemistry 3
Table 1: Monomer, dimer, and total acetone intensity (mV).
Intensity (mV)
Dimer (%) Concentration (ppbv)
Monomer Dimer Total
Intensive care unit 40 (37–46) 22 (18–27) 84 (70–97) 48 (46–50) 5.1 (4.4–5.5)
Laboratory 74 (52–96) 21 (17–25) 116 (88–144) 44 (39–48) 5.6 (5.1–6.2)#
Critically ill patients 15 (12–18)∗ 106 (85–126)∗ 226 (185–268)∗ 90 (89–91) 9.5 (7.9–11.1)∗
Rats 6 (6-6)∗ 127 (118–135)∗ 259 (241–276)∗ 95 (95-96) 10.3 (9.7–10.9)∗
Monomer, dimer, and total acetone intensity ((mV); total acetone intensity (mV) � acetone monomer intensity (mV) + (2∗ acetone dimer intensity (mV))),
dimer peak fraction of total acetone peak intensity, and concentrations (ppbv) in ambient air of intensive care unit, laboratory, critically ill patients, and rats.
Data are expressed as means (95% CI); # p < 0.001 significant higher concentration of volatile acetone in laboratory vs. intensive care unit (Mann–Whitney
rank sum test); ∗ p < 0.001 significant different intensities and concentrations of volatile acetone in critically ill patients vs. rats (one-way ANOVA).
4. Discussion
60
The monomer-dimer ratios varied slightly across locations
50 and in the exhaled breath of critically ill patients and rats.
However, we detected comparable concentrations of volatile
acetone in laboratory and intensive care unit. Dimer fraction
Concentration (ppb)
40
was slightly increased in the intensive care ward without
reaching a statistical significance. Thus, concentrations and
30
the distribution pattern of volatile acetone oligomer vary,
but only to a small extent. Although our results show sig-
20
nificant differences with narrow confidence intervals be-
tween different environments, these findings are specific for
10 our building and might be clinical negligible. They merely
reflect a snapshot of specific daytime with individual staff
0 and equipment and might differ at another point in time
0 200 400 600 800 1000 1200 1400 limiting our data. There are multiple plausible sources of
Monomer + 2∗ dimer (mV) acetone emission in laboratories including chemical prod-
ucts, cleaning and disinfection solutions, pharmaceuticals,
Figure 1: Calibration curve of acetone concentration (ppbv) vs.
acetone monomer and 2∗ acetone dimer (mV); R2 � 0.98. Acetone antiseptics, and the human exhalome [14]. However, almost
concentration (ppbv) � -10.3 + 13.8 ∗ exp (1.1 ∗ total acetone in- identical dimer fractions in ambient air might be the result of
tensity (V)). comparable humidity and temperature in laboratory and
intensive care unit.
Acetone concentration in ambient air can be rapidly
determined using MCC-IMS but might be dependent on
60
numerous influencing factors. Confirming our results,
Bessonneau et al. reported widely variable acetone con-
centrations between different sampling sites in hospital
50
using gas chromatography-mass spectrometry. In addition,
they observed a significant temporal variability in concen-
Concentration (ppb)
40 trations levels of acetone due to multiples sources of
emissions [14]. Compared to public building and private
30 houses, hospital showed higher acetone concentrations in
ambient air [15].
20 We demonstrated substantial higher expired acetone
concentrations in rats compared to ventilated critically ill
10 patients. Dimer fractions were similar in both groups but
almost twice as high as in ambient air. Our data indicate
0 narrow confidence intervals for the most standardized
6
600 5 model in rats, receiving a continuous glucose solution and
2 ∗ 400 4 V) slightly greater interindividual variability in ventilated pa-
dim
er (m
er (
mV
200 3
nom
tients suggesting numerous influencing factors during
) 0 2 Mo critical illness. Nevertheless, critically ill patients are nour-
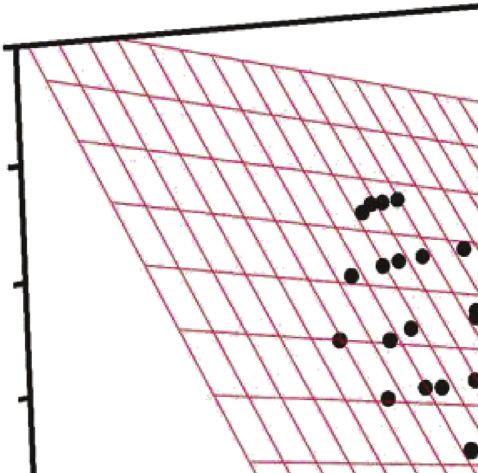
Figure 2: Acetone concentrations (ppbv) and corresponding acetone ished artificial. Continuous supply via the gastric tube
monomer and dimer intensities (mV) measured by MCC-IMS; provides sufficient energy intake preventing marked keto-
R2 � 0.96. Acetone concentration (ppbv) � 8.41–2928 ∗ acetone genesis and acetone production [16]. However, interindi-
monomer intensity (mV) + 74 ∗ acetone dimer intensity (mV). vidual variability in exhaled acetone might be caused by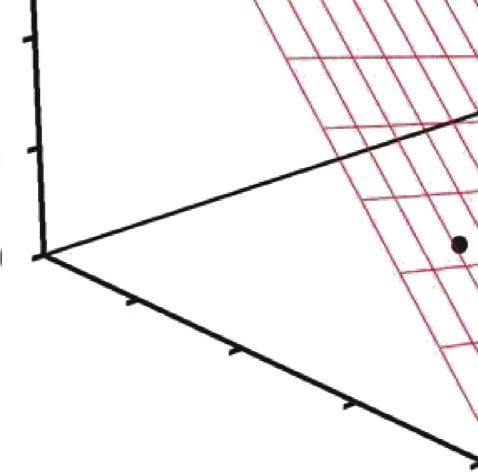
4                                                                                 Journal of Analytical Methods in Chemistry

postaggression syndrome, increased lipolysis, and accu-           formation depends on several influencing factors: high
mulation of fatty acids and ketones during critical illness.      concentration [24, 25], low humidity [26], and low tem-
We were able to show that volatile acetone concentrations         perature [27] result in increased dimer formation. Forma-
differ in expired air of various subjects. Additionally, MCC-      tion of protonated dimer could be observed for several
IMS enables sufficient quantification of acetone even in             volatile compounds, depending on further physicochemical
humid expired air.                                                properties that are not completely understood and pre-
    There is widespread evidence for the correlation between      dictable [26]. Acetone dimer can be expected to be a proton
blood glucose levels and exhaled acetone concentrations in        bound, two-fold ionic complex [28]. However, the pro-
critically ill patients [17]. Acetone derives from acetoacetate   tonation leads to higher carbonyl activity side reactions such
and degradation of ketone bodies explaining these findings         as aldol addition and even aldol condensation can occur.
[18]. However, large variation in expired acetone levels in       Nevertheless, it has been proven (with ab initio calculations
critically ill patients has been described before [19–21],        and semiempirically) that the most likely and most stable
limiting the accuracy of acetone as a marker for blood            isomer is the proton bound dimer [29]. Acetone is known to
glucose prediction in critical care medicine. Furthermore,        have a higher proton affinity (812 kJ/mol) compared to water
coexisting diabetes mellitus [3] and infections [7] during        (697 kJ/mol). Therefore, acetone can be detected with great
critical illness influence the acetone metabolism and result in    sensitivity using the atmospheric pressure chemical ioni-
unpredictable expired acetone concentrations. This might          zation process in MCC-IMS [30].
explain findings of Scholpp and colleagues, detecting                   Although higher protonated oligomers of acetone are
comparable exhaled acetone concentrations between healthy         theoretically possible, we did not observe higher oligomers
volunteers and critically ill, mechanically ventilated patients   than the dimer. Presumably, the acetone dimer water
[22]. In contrast to humans, we demonstrated in a previous        clusters are stable at given conditions and atmospheric
study, a poor correlation between volatile acetone and blood      pressure. Due to short time being ionized, not even the next
glucose levels in rats but a trend toward lower acetone           higher oligomer, the acetone trimer, can be formed in a
concentrations with the cumulative input of glucose [23].         measurable amount for our given method. It is apparent
However, differences in exhaled acetone concentrations             from our results that MCC-IMS is suitable for bedside and
between critically ill patients and rats are speculative and      near real-time quantification of volatile acetone even in
might depend on several influencing factors.                       exhaled humid breath on condition that monomer is not
    Different subjects showed various distribution patterns        neglected. Real-time measurement and low-instrumental
of acetone monomer and dimer. Variations were significant          requirement (atmospheric pressure) of MCC-IMS is a huge
between groups with relatively narrow confidence intervals         advantage against the gold standard method gas chroma-
in the highly standardized rat model but greater spread           tography-mass spectrometry for quantification of acetone in
among the inhomogeneous group of patients. Usually,               human breath. Latter needs a vacuum where molecules get
breathing tubes of ventilated patients were connected to a        ionized. At this, protonated acetone molecules have less time
heat-and-moisture exchanging filter. This results in in-           to form dimers and undergo side reactions caused by short
creased humidity and higher temperature of inspired air.          lifespan after ionization in vacuum. Signals of dimer and
Thus, higher fraction of acetone monomer is the conse-            potential isomers are much smaller using gas chromatog-
quence explaining our findings. Compared to this, rats were        raphy-mass spectrometry. Furthermore, since proton bound
ventilated without breathing filters. Therefore, lower tem-        dimer and aldol adduct have the same m/z � 117 and the
perature and less humidity of inhaled air are responsible for     same retention time, it is challenging to separate those two
higher dimer fraction. Furthermore, it can be expected that       species using gas chromatography-mass spectrometry, since
oxygen and nitrogen content, respectively, might influence         they can only be formed after ionization and therefore have
acetone monomer and dimer formation as well; the higher           same retention times.
humidity of oxygen compared to nitrogen accelerates the                We selected MCC-IMS for quantification of volatile
formation of acetone water clusters, so less dimer is observed    acetone and analysis of expired air in both, humans and rats.
using higher oxygen fractions. In our study, we ventilated        Advantages compared to other technologies include bedside
rats with 21% oxygen. Usually, critically ill patients need       online-measurements with near real-time data acquisition,
higher oxygen fractions explaining our findings. It is ap-         low technical and financial expenditure, and high sensitivity
parent from our results that the condition of inspired air        with detection limit down to the ng L−1 and pg L−1 range
contributes to a considerable extent to the distribution          [31]. Direct investigation of humid exhaled air, minimal
pattern of monomer and dimer in expired air. Consequently,        weight, size, and power consumption, and no required
monomer formation might have a significant impact in               vacuum are major benefits of this technology over gas
breath gas analysis of ventilated critically ill patients.        chromatography-mass spectrometry. This approach enables
    Acetone monomer and dimer have a significant impact            serial bedside measurements even on the intensive care ward
on total acetone concentration. We demonstrated a sub-            and during long-term measurements in ventilated rats [10].
stantial correlation between monomer, dimer, and acetone          MCC-IMS provides intensities (millivolt) as a surrogate of
concentrations exhibiting a high coefficient of determina-          quantity rather than concentrations, but calibration reveals
tion. Considering total acetone intensity consisting of           an excellent correlation between monomer, dimer, and
monomer and double dimer intensity correlation yielded            acetone concentration with a high coefficient of
even superior dependency. Ratio of monomer to dimer               determination.
Journal of Analytical Methods in Chemistry 5
The acetone concentrations we observed in ambient and References
expired air are specific for our setting and will presumably
differ at least somewhat in other settings. It can be assumed [1] V. Ruzsányi and M. P. Kalapos, “Breath acetone as a potential
that especially critically ill patients exhibit numerous marker in clinical practice,” Journal of Breath Research,
vol. 11, 2017.
influencing and contributing factors in quantification of
[2] M. D. McCue, “Starvation physiology: reviewing the different
volatile acetone. Thus, comparing concentrations of expired
strategies animals use to survive a common challenge,”
acetone between different subjects must be performed with Comparative Biochemistry and Physiology Part A: Molecular &
caution. Second, we conducted gas sampling in mixed, in- Integrative Physiology, vol. 156, no. 1, pp. 1–18, 2010.
spired, and expired air of the tubing system of ventilated [3] A. W. Jones, A. Sagarduy, E. Ericsson, and H. J. Arnqvist,
humans and rats. Alveolar sampling during expiration might “Concentrations of acetone in venous blood samples from
result in considerable higher intensities, higher concentra- drunk drivers, type-I diabetic outpatients, and healthy blood
tions, and more reliable results. Therefore, comparing our donors,” Journal of Analytical Toxicology, vol. 17, no. 3,
results to other studies might be challenging. Indeed, other pp. 182–185, 1993.
authors reported higher concentrations of expired acetone [4] D. Jerrard, V. Verdile, D. Yealy, E. Krenzelok, and
[19–21]. Third, outlined calibration curves and correlations J. Menegazzi, “Serum determinations in toxic isopropanol
between acetone monomer and dimer are specific for our ingestion,” The American Journal of Emergency Medicine,
individual device and not transferable in general. Other vol. 10, no. 3, pp. 200–202, 1992.
devices require individual calibration. Different circum- [5] B. G. K. Beisswenger, E. M. Delucia, N. Lapoint, R. J. Sanford,
stances with divergent humidity, temperature, and gas and P. J. Beisswenger, “Ketosis leads to increased methyl-
glyoxal production on the Atkins diet,” Annals of the New
composition might reveal different findings. And finally, it
York Academy of Sciences, vol. 1043, no. 1, pp. 201–210, 2005.
remains unclear to what extent dimers are formed during
[6] P. J. Mazzone, “Analysis of volatile organic compounds in the
ionization in the IMS device and to what extent endogenous exhaled breath for the diagnosis of lung cancer,” Journal of
dimers contribute to this. Nevertheless, we were able to show Thoracic Oncology, vol. 3, no. 7, pp. 774–780, 2008.
that oligomers are sufficiently quantifiable using IMS re- [7] M. Sohrabi, L. Zhang, K. Zhang, A. Ahmetagic, and
gardless of their origin. M. Q. Wei, “Volatile organic compounds as novel markers for
the detection of bacterial infections,” Clinical Microbiology,
5. Conclusions vol. 03, pp. 1–6, 2014.
[8] P. Mochalski, J. Rudnicka, A. Agapiou, M. Statheropoulos,
In summary, acetone may be a clinically meaningful bio- A. Amann, and B. Buszewski, “Near real-time VOCs analysis
marker. However, the ratio of acetone monomer and dimer using an aspiration ion mobility spectrometer,” Journal of
is inconsistent and varies (slightly) in ambient air from Breath Research, vol. 7, Article ID 026002, 2013.
[9] F. W. Albrecht, T. Hüppe, T. Fink et al., “Influence of the
place-to-place and across individual humans and rats.
respirator on volatile organic compounds: an animal study in
Monomers and dimers must therefore be considered when
rats over 24 hours,” Journal of Breath Research, vol. 9, Article
quantifying volatile acetone. Ion-mobility spectrometry ID 016007, 2015.
combines monomers and dimers in the analysis, and precise [10] A. Wolf, J. I. Baumbach, A. Kleber et al., “Multi-capillary
measurements require that each be quantified. column-ion mobility spectrometer (MCC-IMS) breath
analysis in ventilated rats: a model with the feasibility of long-
Data Availability term measurements,” Journal of Breath Research, vol. 8,
Article ID 016006, 2014.
The data used to support the findings of this study are [11] F. Maurer, A.-C. Hauschild, K. Eisinger, J. Baumbach,
available from the corresponding author upon request. A. Mayor, and J. I. Baumbach, “MIMA-a software for analyte
identification in MCC/IMS chromatograms by mapping ac-
companying GC/MS measurements,” International Journal
Disclosure for Ion Mobility Spectrometry, vol. 17, no. 2, pp. 95–101, 2014.
[12] W. Vautz and M. Schmäh, “HovaCAL-a generator for multi-
This study contains data taken from the thesis presented by component humid calibration gases,” International Journal
Ramona Klumpp as part of the requirements for a “Doctor of for Ion Mobility Spectrometry, vol. 12, no. 4, pp. 139–147, 2009.
Medicine” degree at Saarland University Medical Center and [13] T. Hüppe, D. Lorenz, F. Maurer et al., “Exhalation of volatile
Saarland University Faculty of Medicine. organic compounds during hemorrhagic shock and reper-
fusion in rats: an exploratory trial,” Journal of Breath Research,
vol. 10, 2016.
Conflicts of Interest [14] V. Bessonneau, L. Mosqueron, A. Berrubé et al., “VOC
The authors declare that there are no conflicts of interest. contamination in hospital, from stationary sampling of a large
panel of compounds, in view of healthcare workers and pa-
tients exposure assessment,” PLoS One, vol. 8, pp. e55535–
Acknowledgments e55614, 2013.
[15] O. Geiss, G. Giannopoulos, S. Tirendi, J. Barrero-Moreno,
The authors thank Mr. Martin Geiger for his scientific B. R. Larsen, and D. Kotzias, “The AIRMEX study-VOC
support and advice in the discussion of acetone oligomer measurements in public buildings and schools/kindergartens
formation. in eleven European cities: statistical analysis of the data,”6 Journal of Analytical Methods in Chemistry
Atmospheric Environment, vol. 45, no. 22, pp. 3676–3684, [30] E. P. L. Hunter and S. G. Lias, “Evaluated gas phase basicities
2011. and proton affinities of molecules: an update,” Journal of
[16] M. Righettoni, “Schmid a, Amann a, Pratsinis SE. Correla- Physical and Chemical Reference Data, vol. 27, no. 3,
tions between blood glucose and breath components from pp. 413–656, 1998.
portable gas sensors and PTR-TOF-MS,” Journal of Breath [31] J. I. Baumbach, “Ion mobility spectrometry coupled with
Research, vol. 7, Article ID 37110, 2013. multi-capillary columns for metabolic profiling of human
[17] J. H. Leopold, R. T. van Hooijdonk, P. J. Sterk, A. Abu-Hanna, breath,” Journal of Breath Research, vol. 3, Article ID 034001,
M. J. Schultz, and L. D. Bos, “Glucose prediction by analysis of 2009.
exhaled metabolites - a systematic review,” BMC Anesthesi-
ology, vol. 14, no. 1, p. 46, 2014.
[18] P. R. Galassetti, B. Novak, D. Nemet et al., “Breath ethanol and
acetone as indicators of serum glucose levels: an initial re-
port,” Diabetes Technology & Therapeutics, vol. 7, no. 1,
pp. 115–123, 2005.
[19] P. Spaněl, K. Dryahina, and D. Smith, “Acetone, ammonia and
hydrogen cyanide in exhaled breath of several volunteers aged
4-83 years,” Journal of Breath Research, vol. 1, 2007.
[20] C. Deng, J. Zhang, X. Yu, W. Zhang, and X. Zhang, “De-
termination of acetone in human breath by gas chromatog-
raphy-mass spectrometry and solid-phase microextraction
with on-fiber derivatization,” Journal of Chromatography B,
vol. 810, no. 2, pp. 269–275, 2004.
[21] M. Storer, J. Dummer, H. Lunt et al., “Measurement of breath
acetone concentrations by selected ion flow tube mass
spectrometry in type 2 Diabetes,” Journal of Breath Research,
vol. 201, no. 5, Article ID 046011, 2011.
[22] J. Scholpp, J. K. Schubert, K. Geiger, W. Miekisch, and
K. Geiger, “Breath markers and soluble lipid peroxidation
markers in critically III patients,” Clinical Chemistry and
Laboratory Medicine, vol. 40, pp. 587–594, 2002.
[23] T. Fink, F. W. Albrecht, F. Maurer et al., “Exhalation pattern
changes during fasting and low dose glucose treatment in
rats,” Analytical and Bioanalytical Chemistry, vol. 407, no. 13,
pp. 3763–3773, 2015.
[24] R. Cumeras, E. Figueras, C. E. Davis, J. I. Baumbach, and
I. Gràcia, “Review on ion mobility spectrometry. Part 1:
current instrumentation,” The Analyst, vol. 140, no. 5,
pp. 1376–1390, 2015.
[25] G. A. Eiceman, “Advances in ion mobility spectrometry: 1980-
1990,” Critical Reviews in Analytical Chemistry, vol. 22, no. 1-
2, pp. 471–490, 1991.
[26] R. Cumeras, E. Figueras, C. E. Davis, J. I. Baumbach, and
I. Gràcia, “Review on ion mobility spectrometry. Part 2:
hyphenated methods and effects of experimental parameters,”
The Analyst, vol. 140, no. 5, pp. 1391–1410, 2015.
[27] J. Glosı́k and R. Plasil, “The recombination rate coefficient of a
protonated acetone dimer with electrons: indication of a
temperature dependence,” Journal of Physics B: Atomic,
Molecular and Optical Physics, vol. 33, no. 20, pp. 4483–4493,
2000.
[28] G. E. Douberly, A. M. Ricks, B. W. Ticknor, and
M. A. Duncan, “The structure of protonated acetone and its
dimer: infrared photodissociation spectroscopy from 800 to
4000 cm−1,” Physical Chemistry Chemical Physics, vol. 10,
no. 1, pp. 77–79, 2008.
[29] K. Norrman, T. I. Sølling, and T. B. McMahon, “Isomerization
of the protonated acetone dimer in the gas phase,” Journal of
Mass Spectrometry, vol. 40, no. 8, pp. 1076–1087, 2005.You can also read