A case control study examining the feasibility of using eye tracking perimetry to differentiate patients with glaucoma from healthy controls
←
→
Page content transcription
If your browser does not render page correctly, please read the page content below
www.nature.com/scientificreports
OPEN A case control study examining
the feasibility of using eye tracking
perimetry to differentiate patients
with glaucoma from healthy
controls
Andrew J. Tatham1,2*, Ian C. Murray1, Alice D. McTrusty1,3, Lorraine A. Cameron1,3,
Antonios Perperidis1,4, Harry M. Brash1, Brian W. Fleck1,2,5 & Robert A. Minns1,5
To explore the feasibility of using Saccadic Vector Optokinetic Perimetry (SVOP) to differentiate
glaucomatous and healthy eyes. A prospective case–control study was performed using a convenience
sample recruited from a single university glaucoma clinic and a group of healthy controls. SVOP
and standard automated perimetry (SAP) was performed with testing order randomised. The
reference standard was a diagnosis of glaucoma based a comprehensive ophthalmic examination
and abnormality on standard automated perimetry (SAP). The index test was SVOP. 31 patients
with glaucoma and 24 healthy subjects were included. Mean SAP mean deviation (MD) in those with
glaucoma was − 8.7 ± 7.4 dB, with mean SAP and SVOP sensitivities of 23.3 ± 0.9 dB and 22.1 ± 4.3 dB
respectively. Participants with glaucoma were significantly older. On average, SAP sensitivity was
1.2 ± 1.4 dB higher than SVOP (95% limits of agreement = − 1.6 to 4.0 dB). SVOP sensitivity had good
ability to differentiate healthy and glaucomatous eyes with a 95% CI for area under the curve (AUC)
of 0.84 to 0.96, similar to the performance of SAP sensitivity (95% CI 0.86 to 0.97, P = 0.60). For 80%
specificity, SVOP had a 95% CI sensitivity of 75.7% to 94.8% compared to 77.8% to 96.0% for SAP.
SVOP took considerably longer to perform (514 ± 54 s compared to 267 ± 76 s for SAP). Eye tracking
perimetry may be useful for detection of glaucoma but further studies are needed to evaluate SVOP
within its intended sphere of use, using an appropriate design and independent reference standard.
Standard Automated Perimetry (SAP) has become the prevailing modality for assessing visual function in glau-
coma. The test uses a white static stimulus displayed against a white background, with the contrast of the stimulus
varied according to a staircase strategy to determine Differential Light Sensitivity (DLS). SAP has become the
‘gold standard’ perimetric test, yet patients often find it difficult to perform. Although patients accept that visual
field testing is important, they find it more demanding than other common glaucoma tests and a qualitative
investigation discovered a perception among patients that multiple tests were needed to become comfortable
and to gain an accurate representation of their vision1,2.
SAP is also subject to considerable test–retest variability with the result that patients may need multiple tests
to confidently identify change. Although research on the optimal frequency of clinical tests is limited, it has
been suggested that to detect patients progressing at a rapid rate (≥ − 2 dB per year), 3 visual field tests should be
conducted per year for the first 2 years of follow up, with more frequent testing required to detect slower rates of
change3. In reality, visual field testing is often performed less frequently, with a multicentre review of glaucoma
clinics in England showing most patients have only one visual field test per y ear4. Similar findings were reported
in the US, where even in an academic medical centre, patients had an average of only 1.24 visual tests per year5.
Despite the guidance highlighting the importance of perimetry, there is evidence that the frequency of visual
field testing has decreased, perhaps due to overreliance on imaging. A review of over 150,000 patients with
glaucoma, found the odds of having an automated visual field test decreased by 44% from 2001 to 2009, whilst
1
University of Edinburgh, Edinburgh, UK. 2Princess Alexandra Eye Pavilion, 45 Chalmers Street, Edinburgh EH3
9HA, UK. 3Glasgow Caledonian University, Glasgow, UK. 4Heriot Watt University, Edinburgh, UK. 5Royal Hospital
for Sick Children, Edinburgh, UK. *email: andrewjtatham@gmail.com
Scientific Reports | (2021) 11:839 | https://doi.org/10.1038/s41598-020-80401-2 1
Vol.:(0123456789)
www.nature.com/scientificreports/
over the same time period there was a 147% increased odds of undergoing computer-based optic disc i maging6.
Although many factors, particularly organisational and resource constraints, may affect the frequency of visual
field testing, the perception that SAP is difficult to perform and unpopular with patients, may contribute to the
discrepancy between recommended and observed frequencies of testing.
Over the last decade several groups have explored the possibility of performing perimetry by tracking eye
movements7–13. Eye trackers have long been used to monitor fixation during visual field assessment, but eye
tracking may also be useful for determining whether a stimulus has been seen. We have previously developed
a suprathreshold eye tracking perimeter for use in children known as saccadic vector optokinetic perimetry
(SVOP)11. SVOP was inspired by the work of Damato and colleagues, who in 1989 described a method of com-
puterized perimetry using a moving fixation target presented on a computer monitor14,15. Patients were required
to position a cursor over a fixation target using a mouse, and stimuli were presented when the cursor was in the
correct position. By moving the fixation target, and by using the preceding stimulus as a fixation spot for the
next stimulus, a large area of visual field could be tested using a standard computer monitor. A similar approach
is used by the more recent Melbourne Rapid Fields test, an FDA approved application that allows testing of 30°
of field using the 9.7-inch screen of a tablet c omputer16.
Damato’s perimeter and the Melbourne Rapid Fields require responses to stimuli to be registered by pressing
a response button, similar to SAP; however, eye tracking could be used to determine if a stimulus is seen, by
detecting eye movements towards the stimulus that occur within a prespecified time of stimuli presentation11,14–20.
Eye trackers can also determine the position of the eyes relative to the screen to automatically adjust the size
and position of stimuli allowing the patient to move their head during testing. Therefore, eye tracking perimetry
may provide a more comfortable experience for patients that is likely to be particularly beneficial for those that
struggle to maintain fixation for a prolonged period or have difficulty pressing a button to register a response.
The suprathreshold version of SVOP for use in children showed mixed r esults11,21,22. Tailor et al. reported
many children were unable to complete testing and agreement with confrontational and Goldmann perimetry
was moderate to p oor21. In contrast, Simkin and colleagues reported a higher proportion of children were able
to successfully complete SVOP compared to Goldmann perimetry, with SVOP significantly f aster22. The differ-
ences in results may be due to the inherent difficulty of assessing visual fields in children or due to differences
in characteristics of those included in the studies. As adults also report difficulty performing conventional
perimetry, we have modified SVOP to develop a threshold version of the test. An advantage of evaluating the
test in adults is it is easier to establish a reliable comparison to SAP, and in a previous investigation we found
good correlation between threshold sensitivity values obtained with SVOP and SAP and demonstrated SVOP
to have good r epeatability19. Most patients found SVOP comfortable and almost three quarter preferred SVOP
compared to standard testing.
The aim of this study was to explore the feasibility of using SVOP to differentiate eyes with glaucoma from
healthy controls and compare performance to SAP. Like many evaluations of diagnostic devices, the study was
limited by a case–control design and so results may not be generalisable to other settings or groups, and it would
be premature to recommend use of eye tracking perimeters in clinical practice23; however, the study provides
useful data supporting further larger scale evaluation of SVOP.
Materials and methods
This was a prospective case–control study including patients with glaucoma and healthy volunteers. A two-gate
design was used, with patients with glaucoma recruited from the glaucoma clinic at the Princess Alexandra
Eye Pavilion, Edinburgh, UK, and healthy participants recruited using the Scottish Health Research Register
(SHARE), a national register of volunteers interested in participating in research. Patients attending the glaucoma
clinic were invited to participate by their treating clinician. All participants provided written informed consent
prior to enrolment and all study methods were prospectively approved by the South-East Scotland Research
Ethics Committee (reference 13/SS/0045). The study adhered to the tenets of the Declaration of Helsinki.
Patients attending the glaucoma clinic underwent a comprehensive ophthalmic examination, including best-
corrected visual acuity, slit lamp biomicroscopy, intraocular pressure (IOP) measurement using Goldmann
applanation tonometry, gonioscopy and dilated fundoscopy. The reference standard was a diagnosis of glaucoma
made by the treating glaucoma consultant based on the comprehensive ophthalmic examination and all patients
with glaucoma were required to have a glaucomatous visual field defect on SAP using the Humphrey Field Ana-
lyzer (HFA) SITA Fast 24-2 test (Carl Zeiss Meditec, Inc., Dublin, CA). The treating glaucoma consultant did
not have access to the SVOP test results. Patients with non-glaucomatous ocular or non-ocular conditions, such
as neurological disease, that might affect the visual field were excluded. Healthy participants were required to
have no previous history of significant eye disease, no known history of visual field defect and no neurological
conditions that might affect the visual field.
All participants had SAP using a Humphrey Field Analyzer (HFA) 750i (Carl Zeiss Meditec, Dublin, CA) with
the 24-2 test pattern and the SITA Fast algorithm. The index test, SVOP, was performed at the same visit using a
threshold SVOP research device, described in detail in previous p ublications19. All patients completed SAP and
SVOP in both eyes, with the order of testing randomised. A random group of participants then performed repeat
SAP and SVOP in one eye, randomly chosen for healthy subjects and with the worse affected eye selected in those
with glaucoma. Visual field tests were reviewed for reliability and artefacts. SAP tests with ≥ 15% false positives
or ≥ 20% fixation losses were considered unreliable and excluded. False negative rates were not considered due
to evidence indicating false negative rates are more strongly indicative of glaucoma severity than a ttentiveness24.
SVOP does not provide information about false positives or fixation losses as it does not require the patient to
maintain fixation on a single point or register a response with a button. Inherent to the test, SVOP accounts for
fixation by not presenting a further stimulus until fixation is achieved.
Scientific Reports | (2021) 11:839 | https://doi.org/10.1038/s41598-020-80401-2 2
Vol:.(1234567890)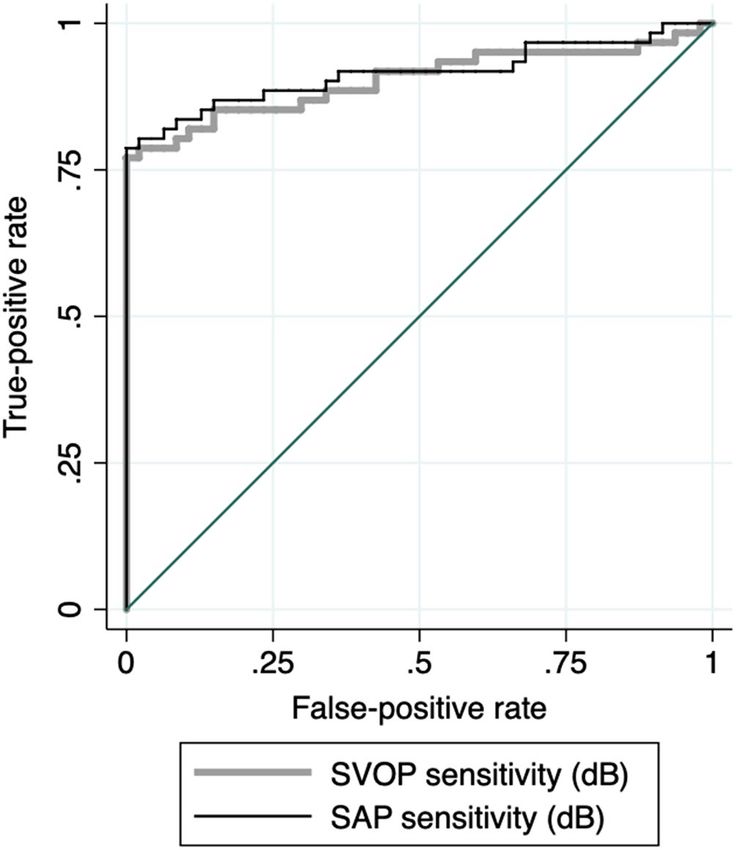
www.nature.com/scientificreports/
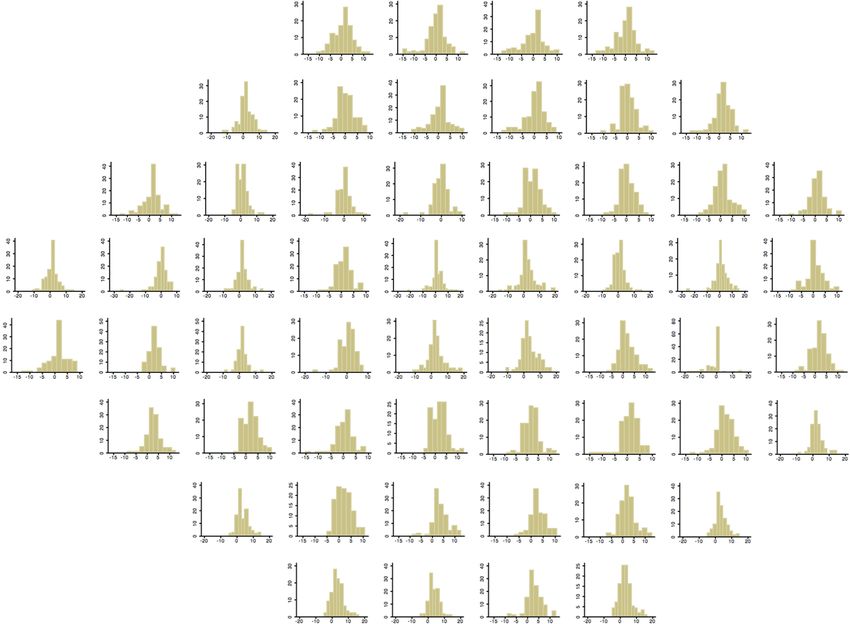
Figure 1. The threshold saccadic vector optokinetic perimetry (SVOP) instrument showing the patient screen,
eye tracker position and examiner screen.
Saccadic vector optokinetic perimetry (SVOP). The threshold SVOP device consists of a personal
computer with a 24″ high-resolution Liquid Crystal Display (LCD) screen (Eizo ColorEdge CG243W, Hakusan,
Japan) and a 60 Hz eye tracker (X2-60 model, Tobii Technology, Stockholm, Sweden)19,20. A 60 Hz eye tracker
has a sampling rate of 1 data point every 16 ms.
Participants were seated in front of an LCD screen with their eyes aligned with the screen’s centre at an initial
distance of 55 cm (Fig. 1). Written informed consent was obtained for publication of this identifying image in
an open-access publication. Each eye was tested separately using custom made spectacles, which occluded the
non-test eye with a darkened infrared bandpass filter. This filter enabled the eye tracker to detect the position
of the occluded eye, while blocking the occluded eye from seeing the stimuli. Before testing commenced there
was a 20 s demonstration followed by an eye-tracker calibration sequence. Calibration enabled the geometric
characteristics of eyes to be estimated for accurate gaze point calculation. During calibration the user was asked
to look at specific points on the screen, with the sequence taking approximately 30 s. The calibration sequence
was included in the reported SVOP test time.
During testing participants were instructed to look towards any peripheral stimulus seen. The eye tracker
evaluated gaze responses to the stimuli and software determined whether the stimulus had been seen based on
the direction and amplitude of the gaze response. Whether or not the stimulus was seen was determined based
on the direction and amplitude of the change in eye position relative to the stimulus and the point of fixation.
The start of a fixation change was defined as the start point of a greater than 50 pixels change in gaze and the end
location was defined by the point at which 5 consecutive gaze data samples were separated by a distanced of < 50
pixels after the detection of a fixation change. Stimuli were equivalent to Goldmann size III and each stimulus
was presented for 200 ms using coordinates equivalent to the SAP 24–2 test pattern. As the eye tracker provides
data on eye location, the size and position of stimuli were able to be automatically adjusted to compensate for
changes head position during testing. A stimulus duration of 200 ms was selected as it is the same duration as
HFA and previous work has shown visual processing speed and speed of the saccade response is sufficiently fast
to reach a stimulus within this time p eriod25,26. Saccades larger than 5° take only approximately 20 to 30 ms, with
an additional 2 ms for each additional degree.
Grey-scale level colours were produced by the LCD screen by setting red, green and blue (RGB) levels to equal
each other and luminance was varied by adjusting RGB levels. The maximum level of luminance was obtained
by setting the RGB level to 255, 255, 255 and the minimum to 0, 0, 0. Screen calibration was performed using
a Look-Up Table to pair grey levels of each pixel to the corresponding required background (10 Cd/m2) and
stimulus luminance levels. To minimize the risk of variability in luminance affecting results, uniformity of the
display screen was assessed using a luminance meter (L203 photometer, Macam Photometrics Ltd, Livingston,
UK). Luminance values were examined for different grey-scale levels to ensure LCD RGB values corresponded
to stimulus luminance used by SAP. For example, a stimulus of 20 dB (41.9 Cd/m2) was found to be equivalent
to an LCD RGB value of 136, 136, 136. Stimuli luminance replicated the luminance values corresponding to 14
to 40 dB with SAP, with the background to stimuli luminance ratio also replicated. The LCD display was unable
to display stimuli with luminance < 14 dB due to the maximum intensity being limited by the maximum lumi-
nance of the LCD backlight.
Thresholds were obtained using a 4–2 bracketing strategy and began by testing four seed locations (one in
each quadrant), which were then used to set the starting stimulus luminance levels for neighbouring locations
which in-turn were used to calculate the remaining starting luminance levels. The SVOP stimulus intensity and
background intensity values were matched in luminance to those of SAP to allow direct comparison. Version
2.0 of the SVOP threshold software was used for all participants.
Data analysis. The relationship between SAP and SVOP visual field sensitivity was examined using scatter
plots and pointwise linear regression. Histograms were also constructed to survey the distribution of differences
in sensitivity between SAP and SVOP for each visual field test location. All results were transposed to right eye
Scientific Reports | (2021) 11:839 | https://doi.org/10.1038/s41598-020-80401-2 3
Vol.:(0123456789)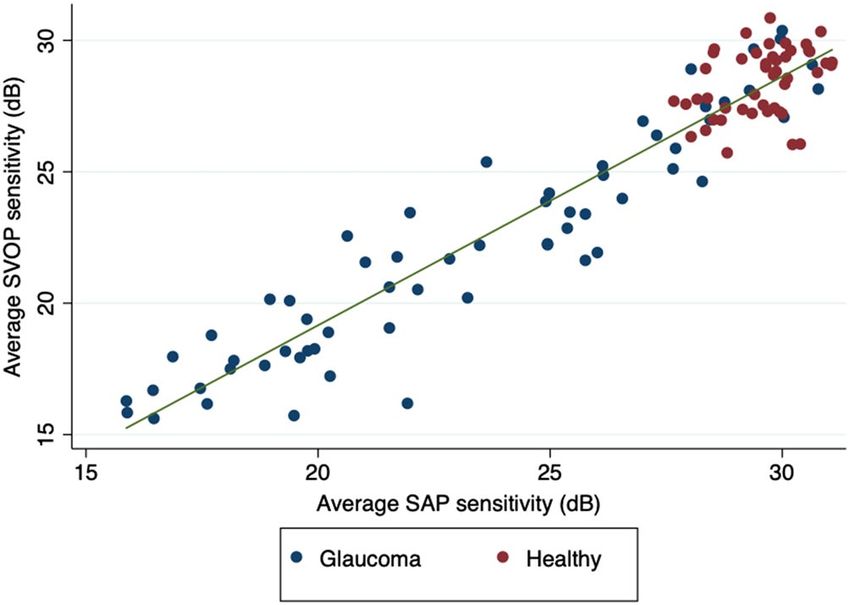
www.nature.com/scientificreports/
Normal Glaucoma
(n = 47 eyes, 24 subjects) (n = 61 eyes, 31 subjects) P-value
Age (years) 66.0 ± 5.6 72.3 ± 7.9 < 0.001
Gender (female, n) 9 (37.5%) 17 (54.8%) 0.122
SAP MD (dB) 0.0 ± 0.8 − 8.7 ± 7.4 < 0.001
Mean SAP sensitivity (dB) 29.6 ± 0.9 23.3 ± 4.4 < 0.001
Mean SVOP sensitivity (dB) 28.4 ± 1.3 22.1 ± 4.3 < 0.001
SAP test duration (s) 190 ± 34 267 ± 76 < 0.001
SVOP test duration (s) 533 ± 167 514 ± 154 0.545
Table 1. Demographic and clinical details of all participants included in the study. SAP standard automated
perimetry, MD mean deviation, dB decibels, SVOP saccadic vector optokinetic perimetry, s seconds.
Figure 2. Relationship between average standard automated perimetry (SAP) and saccadic vector optokinetic
perimetry (SVOP) sensitivity for healthy and glaucomatous participants.
format. Bland–Altman plots were used to compare results from SAP and SVOP and determine 95% limits of
agreement.
Receiver Operating Characteristic (ROC) curves were constructed to assess the ability of SVOP and SAP
to differentiate participants with glaucoma from healthy c ontrols27. A ROC curve is a plot of sensitivity versus
1-specificity across threshold values, showing the intrinsic capacity of the test to discriminate diseased and
nondiseased status28. The area under the ROC curve (AUC) was used to summarise the diagnostic accuracy. To
account for differences in age between participants with glaucoma and controls, the covariate effect of age was
adjusted for using the ROC generalised linear regression method described by Pepe et al.27,28 and first described
for evaluation of glaucoma diagnostic tests by Medeiros et al.29 Results were reported with age set at the sample
mean.
ROC regression used a 1000 repetition bootstrap technique to estimate 95% confidence intervals. As measure-
ments from both eyes of the same subject are likely to be correlated, the cluster of data for each participants was
used as the unit of resampling when calculating confidence intervals29. All statistical analyses were performed
with commercially available software (STATA version 12; StataCorp LP, College Station, TX). The α level (type
I error) was set at 0.05.
Results
61 eyes of 31 participants with glaucoma and 47 eyes of 24 healthy participants were included in the study. 26
of 55 participants (47.3%) were female. There was no difference in gender between healthy and glaucomatous
participants, however those with glaucoma were significantly older (P < 0.001). Demographic and clinical details
of all participants are shown in Table 1.
Mean SAP mean deviation (MD) in glaucomatous eyes was − 8.7 ± 7.4 dB, with mean SAP and SVOP sen-
sitivities of 23.3 ± 0.9 dB and 22.1 ± 4.3 dB respectively. There was strong correlation between mean SAP and
SVOP sensitivities (r = 0.951, P < 0.001) (Fig. 2). On average, SAP sensitivity was 1.2 ± 1.4 dB higher than SVOP
sensitivity, with 95% limits of agreement of − 1.6 to 4.0 dB (Fig. 3). Bland–Altman analysis may lead to propor-
tional bias, which is present when the difference in values is related to their average. There was no evidence of
proportional bias demonstrated by the lack of a significant relationship between the mean of mean SVOP and
SAP sensitivity and the difference between SVOP and SAP sensitivities ( R2 = 0.0002, P = 0.886)30.
Scientific Reports | (2021) 11:839 | https://doi.org/10.1038/s41598-020-80401-2 4
Vol:.(1234567890)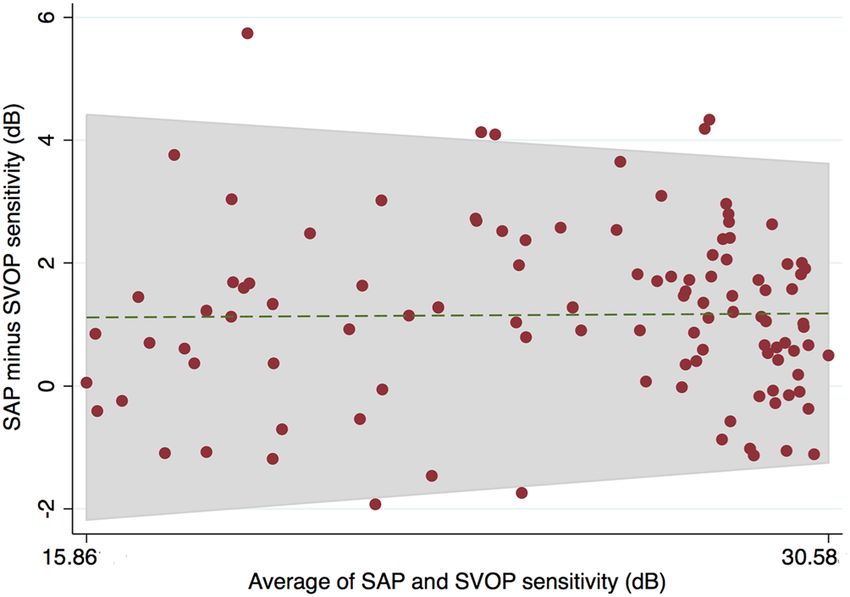
www.nature.com/scientificreports/
Figure 3. Bland Altman plot for visual field sensitivity comparing standard automated perimetry (SAP) and
saccadic vector optokinetic perimetry (SVOP).
SVOP had good repeatability with a concordance correlation coefficient (rho_c) of 0.98 (95% CI 0.97 to 1.00,
P < 0.001, Pearson’s r = 0.987) and a mean difference between repeat measures of 0.37 ± 0.91 dB (95% limits of
agreement of − 1.41 to 2.16 dB). In comparison, SAP had concordance correlation coefficient of 0.99 (95% CI
0.98 to 1.0, P < 0.001, Pearson’s r = 0.991) and a mean difference between repeat measures of 0.13 ± 0.87 dB (95%
limits of agreement of − 1.56 to 1.83 dB).
Pointwise analysis showed the average (± SD) difference in SAP and SVOP sensitivities ranged from a low
of 0 ± 3.28 dB to a high of 3.35 ± 5.00 dB (Fig. 4A), with correlation between tests ranging from 0.58 to 0.91,
excluding the blind spot (Fig. 4B). Excluding the blind spot, all but 5 test locations had a correlation of greater
than 0.7. Histograms showing the distribution of differences in sensitivity between SVOP and SAP for each test
location are shown in Fig. 5. Agreement between tests was worse in the four most central test locations than
at other locations. The mean differences in sensitivity were 1.16 ± 4.76 dB, 2.19 ± 5.38 dB, 2.53 ± 4.88 dB and
3.35 ± 5.00 dB for the central 4 test locations compared to a mean difference of 0 ± 3.28 dB in the test location
with best agreement (Fig. 4A).
SVOP mean sensitivity had good ability to differentiate healthy and glaucomatous eyes included in the study
with an AUC of 0.90 (95% CI 0.84 to 0.96), which was not significantly different to the performance of SAP mean
sensitivity (AUC = 0.92, 95% CI 0.0.86 to 0.97, P = 0.602) (Fig. 6). SVOP had 85.2% (95% CI 75.7% to 94.8%)
sensitivity for 80% specificity, compared to 86.9% sensitivity (95% CI 77.8% to 96.0%) for 80% specificity for
SAP. For 90% specificities, sensitivities were 80.3% (95% CI 69.2% to 91.4%) and 83.6% (95% CI 73.4% to 93.8%)
for SVOP and SAP respectively.
Despite its good performance, SVOP tests took signficantly more time to complete than SAP with average
test times of 522 ± 159 s and 233 ± 72 s (P < 0.001) respectively. There was no significant relationship between age
and test time for SVOP (R2 = 0.003, P = 0.554) but older participants were slower at SAP (R2 = 0.271, P < 0.001).
Each decade of increasing age was associated with 49 s slower SAP test time (95% CI 24 to 65 s, P < 0.001). SAP
also took longer in those with worse disease severity, on average taking 12 s longer for every 1 dB worse average
SAP sensitivity (95% CI 14 to 10 s, P < 0.001). In multivariable analysis, disease severity remained signficantly
associated with SAP test duration (P < 0.001), whereas age did not (P = 0.092). The duration of SVOP was not
influenced by average sensitivity (P = 0.697) meaning the difference in test times between SAP and SVOP was
greater in healthy participants compared to those with glaucoma (Table 1).
Discussion
The results of this study suggest that eye tracking perimetry could have a future role in aiding the detection of
glaucoma, though limitations of the study design, particularly the small sample size and case–control design,
mean there remains insufficient evidence for use in current clinical practice. Overall, threshold sensitivities
obtained from SVOP and SAP showed good agreement, and both SVOP and SAP had similar ability to dif-
ferentiate healthy and glaucomatous eyes, despite inclusion of SAP in the diagnostic reference standard. SVOP
mean sensitivity achieved an AUC of 0.90 compared to 0.92 for SAP, with 85.2% and 86.9% sensitivities for 80%
specificity for SVOP and SAP respectively, though due to the small sample size confidence intervals were wide.
Were it possible to replicate this performance in clinical practice, SVOP would likely be a useful diagnostic
aid, however, it is important to acknowledge that case–control studies tend to overestimate performance, particu-
larly when including patients with advanced disease, and when excluding patients with certain characteristics,
some of which may be risk factors for the disease, e.g. high myopia. The average SAP MD of patients included
in this study was − 8.72 dB, however, the study included patients with a wide range of visual field loss (Fig. 2).
Due to the limited sample size we were unable to explore the performance of SVOP across the range of disease
severities and this would be an important area for future study given that performance is likely to be reduced in
early disease. Overall, the performance of SVOP and SAP may be similar but if SVOP has worse performance
in detecting early disease, it may be of less value.
Scientific Reports | (2021) 11:839 | https://doi.org/10.1038/s41598-020-80401-2 5
Vol.:(0123456789)www.nature.com/scientificreports/
Figure 4. Mean (± standard deviation (SD)) differences (in decibels) between threshold sensitivities from
standard automated perimetry (SAP) and saccadic vector optokinetic perimetry (SVOP) at each location of the
visual field (A) and correlation between SVOP and SAP sensitivity for each test location (B). Negative values
indicate threshold sensitivity measured by SVOP was lower than that measured by SAP.
The diagnostic accuracy of a test is not a fixed property and will vary depending on setting, prior testing and
articipants23. These are important considerations when deciding whether to adopt a test in a
characteristics of p
specific environment. As a case control study is an artificial construct, it does not replicate the use of a test in the
setting of proposed used, and therefore does not provide sufficient evidence to justify use of SVOP in clinical
practice. Nevertheless, the results, coupled with previous studies showing a patient preference for S VOP20, suggest
that larger scale studies of use of eye tracking perimeters in a clinical pathway are warranted.
The performance of a test is highly influenced by choice of reference standard and the ideal reference standard
would be independent of perimetry, for example, classification on optical coherence tomography, or progressive
changes on masked observation of optic disc stereophotographs. The chosen reference standard for the current
study was a diagnosis of glaucoma made by the treating glaucoma consultant based on a comprehensive oph-
thalmic examination, with all patients required to have a glaucomatous visual field defect on SAP. The require-
ment for a defect on SAP would introduce positive bias in assessment of the ability of SAP mean sensitivity to
differentiate glaucomatous and healthy eyes and would also introduce bias in favour of any perimetric device in
which results correlated with SAP. If a structural marker of glaucoma had been selected as the reference standard,
the performance of SAP and SVOP would likely have been reduced. However, in this pilot study, it was deemed
most important to determine whether SVOP was able to identify patients with glaucoma with a visual field defect
on SAP, and to determine the number of false positives. It is patients with a defect on SAP that are at most risk
of visual impairment from glaucoma, though we acknowledge that the choice of reference standard meant we
were unable to determine whether SVOP might have better ability to detect glaucoma than SAP or examine the
potential for SVOP to detect glaucoma before it is evident on conventional perimetry (pre-perimetric glaucoma).
McTrusty and colleagues previously evaluated the ability of threshold SVOP to identify normal versus abnor-
mal SAP, reporting a sensitivity of 98% and specificity of 78%20. The lower sensitivity in the present study likely
Scientific Reports | (2021) 11:839 | https://doi.org/10.1038/s41598-020-80401-2 6
Vol:.(1234567890)www.nature.com/scientificreports/
Figure 5. Histograms showing the distribution of point by point differences in sensitivity (in decibels) between
standard automated perimetry (SAP) and saccadic vector optokinetic perimetry (SVOP) for all participants
and for all test locations. The difference in sensitivity between SVOP and SAP is shown on the x-axis and the
frequency of differences on the y-axis.
reflects the difference in reference standard, with McTrusty and colleagues evaluating the ability to detect and
abnormal visual field rather than the ability to differentiate glaucomatous and healthy individuals. In addition,
McTrusty and colleagues defined an abnormal SVOP based on masked grading rather than the summary index
of average sensitivity and did not perform ROC analysis.
The good performance of SVOP likely reflects a high level of agreement with SAP. On average, DLS measured
by SAP was 1.16 dB higher than DLS measured by SVOP, with 95% limits of agreement of − 1.64 to 3.96 dB
(Fig. 3). Pointwise analysis revealed similarly good agreement between SVOP and SAP as the analysis of mean
sensitivity, however, from Fig. 4 it is apparant that agreement was worse for the four central test loctations, which
are arguably the most important for visual function. Figure 4A shows that SAP sensitivity was on average 3.35 dB
higher than SVOP in the inferotemporal central test location, with a corresponing correlation of only 0.58. In
contrast, other test points had average differences of 0 dB between SAP and SVOP and correlation as high as
0.91. Due to the lack of an independent measure of DLS it is not possible to be certain which of SAP or SVOP
was closest to actual DLS, however, we observed that the eye tracker used with the SVOP device sometimes
failed to detect small amplitude eye movements in the central field. The eye gaze error reported by the eye tracker
manufacturer is 0.58 degrees, however error may be greater in more uncontrolled conditions, such as during an
SVOP test where a patient’s head may move. The result is that some stimuli that were perceived by the subject
may not have been recorded as ‘‘seen’’ by SVOP. The eye tracker used in this study was only 60 Hz and it is likely
that agreement between SVOP and SAP in the central field locations could be improved by improvements in eye
tracking technology but this would need formal evaluation.
A further limitation of SVOP was the longer test time compared to the SAP SITA Fast strategy. SVOP took
over twice as long to perform as SAP, with an average test time per eye of 8.7 min for SVOP compared to 3.9 min
for SAP. In addition, SVOP test times were similar in patients with glaucoma and healthy individuals, whereas
SAP was faster in healthy subjects. Were SVOP to be used in a screening setting where a large number of healthy
subjects would be tested, this would have significant implications for total test times and would likely make the
current SVOP test strategy impractical outside of a research setting. The difference in test times is a consequence
of the exhaustive staircase search strategy employed by SVOP rather than the optimised threshold estimate
provide by SITA Fast and similar strategies could potentially be adopted to improve the SVOP test duration. It
Scientific Reports | (2021) 11:839 | https://doi.org/10.1038/s41598-020-80401-2 7
Vol.:(0123456789)www.nature.com/scientificreports/
Figure 6. Receiver operating characteristic curve comparing the ability of standard automated perimetry (SAP)
and saccadic vector optokinetic perimetry (SVOP) average sensitivities to differentiate eyes with and without
glaucoma (area under the receiver operating characteristic curve (AUC) = 0.90, 95% CI 0.84 to 0.96 for SVOP
versus 0.92, 95% CI 0.86 to 0.97 for SAP, P = 0.602).
is interesting that despite the significantly longer test time, a previous study reported 71% of patients preferred
SVOP to SAP20.
A further potential limitation of eye tracking perimetry is the sampling error inherent in eye trackers, which
may mean that small eye movements go undetected. A 60 Hz eye tracker has a sampling rate of 1 data point
every 16 ms, meaning that fast saccades, which take only 20 to 30 ms, may not have been detected. Use of an eye
tracker with a higher temporal frequency would reduce sampling error and may improve accuracy; however,
an eye tracking perimeter may not need to detect every small saccade, as long as it can determine whether a
stimulus has been perceived and that it has been perceived while the patient is fixing on a fixation spot. Stimuli
were presented for 200 ms giving a potential of 200/16 = 12.5 data points during each stimulus presentation. 5
consecutive data samples (80 ms of sampling) separated by < 50 pixels were required to define an endpoint of
change in gaze, meaning the maximum time available for an eye movement between first appearance of a stimulus
and fixation on the stimulus was only 200–80 = 120 ms. This was deemed sufficient time for a saccade to each the
stimulus but insufficient for smooth pursuit.
Using an ealier suprathreshold version of SVOP, Tailor and colleagues highlighted that patients with abnormal
saccades may have artefactual non-specific visual field d efects9. Performing any form of automated perimetry
in patients with abnormal eye movements is lilkely to be challenging, however, eye tracking perimetry may be
particularly unrelaible in such individuals. As no participants in the current study had eye movement disorders
we were not able to evaluate their effect on SVOP relaiblity but this is likely to be a limitation of the test.
In summary, this study provides evidence that eye tracking perimetry using SVOP may be useful for aiding
glaucoma detection, with performance in this case control study, similar to conventional automated perimetry.
The eye tracking perimeter has the advantage of not requiring the patient to place their chin on a rest or press
a button when a stimulus is seen and in previous studies has been found to be preferred by patients, however, a
major limitation was that SVOP took considerably longer to perform. The study was limited by a case–control
design, small sample size, and imperfect reference standard, but nevertheless the results show that eye track-
ing perimetry is feasbile and provide a foundation for potential further studies examining performance of eye
tracking perimetry in a clinical pathway.
Data availability
The datasets generated during and/or analysed during the current study are available from the corresponding
author on reasonable request.
Scientific Reports | (2021) 11:839 | https://doi.org/10.1038/s41598-020-80401-2 8
Vol:.(1234567890)www.nature.com/scientificreports/
Received: 4 April 2020; Accepted: 10 September 2020
References
1. Glen, F. C., Baker, H. & Crabb, D. P. A qualitative investigation into patients’ views on visual field testing for glaucoma monitoring.
BMJ Open. 4, e003996 (2014).
2. Gardiner, S. K. & Demirel, S. Assessment of patient opinions of different clinical tests used in the management of glaucoma.
Ophthalmology 115, 2127–2131 (2008).
3. Chauhan, B. C. et al. Practical recommendations for measuring rates of visual field change in glaucoma. Br J Ophthalmol. 92,
569–573 (2008).
4. Fung, S. S., Lemer, C., Russell, R. A., Malik, R. & Crabb, D. P. Are practical recommendations practiced? A national multi-centre
cross-sectional study on frequency of visual field testing in glaucoma. Br. J. Ophthalmol. 97, 843–847 (2013).
5. Griffith, J. F. & Goldberg, J. L. The frequency of optical coherence tomography testing in glaucoma at a Single Academic Medical
Center. J. Glaucoma. 25, e241-247 (2016).
6. Stein, J. D., Talwar, N., Laverne, A. M., Nan, B. & Lichter, P. R. Trends in use of ancillary glaucoma tests for patients with open-angle
glaucoma from 2001 to 2009. Ophthalmology 119, 748–758 (2012).
7. Mazumdar, D. et al. Comparison of saccadic reaction time between normal and glaucoma using an eye movement perimeter.
Indian J. Ophthalmol. 62, 55–59 (2014).
8. Pel, J. J. M., van Beijsterveld, M. C. M., Thepass, G. & van der Steen, J. Validity and repeatability of saccadic response times across
the visual field in eye movement perimetry. Transl. Vis. Sci. Technol. 2, 3 (2013).
9. Wroblewski, D., Francis, B. A., Sadun, A., Vakili, G. & Chopra, V. Testing of visual field with virtual reality goggles in manual and
visual grasp modes. Biomed. Res. Int. 2014, 206082 (2014).
10. Jones, P. R., Smith, N. D., Bi, W. & Crabb, D. P. Portable perimetry using eye-tracking on a tablet computer: A feasibility assessment.
Transl. Vis. Sci. Technol. 8, 17 (2019).
11. Murray, I. C. et al. Feasibility of saccadic vector optokinetic perimetry: a method of automated static perimetry for children using
eye tracking. Ophthalmology 116, 2017–2026 (2019).
12. Deiner, M. S., Damata, B. E. & Ou, Y. Implementing and moniotring at-home virtual reality oculo-kinetic perimetry during
COVID-19. Ophthalmology S0161–6420, 2030554–2030556 (2020).
13. Jones, P. R., Linfield, D. & Crabb, D. P. Using an open-source tablet perimeter (Eyecatcher) as a rapid triage measure for glaucoma
clinic waiting areas. Br. J. Ophthalmol. 2020, 316018 (2020).
14. Mutlukan, E. & Damato, B. E. Computerized perimetry with moving and steady fixation in children. Eye. 7, 554–561 (1993).
15. Johnston, S. C., Damato, B. E., Evans, A. L. & Allan, D. Computerised visual-field test for children using multiple moving fixation
targets. Med. Biol. Eng. Comput. 27, 612–616 (1989).
16. Kong, Y. X. G. et al. A comparison of perimetric results from a tablet perimeter and humphrey field analyzer in glaucoma patients.
Transl. Vis. Sci. Technol. 5, 2 (2016).
17. Murray, I. C. et al. Saccadic Vector Optokinetic Perimetry (SVOP): a novel technique for automated static perimetry in children
using eye tracking. Conf Proc IEEE Eng Med Biol Soc. 2013, 3186–3189 (2013).
18. Murray, I. C. et al. Feasibility, accuracy, and repeatability of suprathreshold saccadic vector optokinetic perimetry. Transl. Vis. Sci.
Technol. 5, 15 (2016).
19. Murray, I. C. et al. Comparison of saccadic vector optokinetic perimetry and standard automated perimetry in glaucoma. Part I:
Threshold values and repeatability. Transl. Vis. Sci. Technol. 6, 3 (2017).
20. McTrusty, A. D. et al. Comparison of threshold saccadic vector optokinetic perimetry (SVOP) and standard automated perimetry
(SAP) in glaucoma. Part II: Patterns of visual field loss and acceptability. Transl. Vis. Sci. Technol. 6, 4 (2017).
21. Tailor, V. et al. Saccadic vector optokinetic perimetry in children with neurodisability or isolated visual pathway lesions: observa-
tional cohort study. Br. J. Ophthalmol. 100, 1427–1432 (2016).
22. Simkin, S. K. et al. Clinical applicability of the Saccadic Vector Optokinetic Perimeter in children with and without visual impair-
ment. Clin. Exp. Optom. 102, 70–78 (2019).
23. Cohen, J. F. et al. STARD 2015 guidelines for reporting diagnostic accuracy studies: explanation and elaboration. BMJ Open. 6,
e012799 (2016).
24. Bengtsson, B. & Heijl, A. False-negative responses in glaucoma perimetry: indicators of patient performance or test reliability?.
Am. J. Ophthalmol. 130, 689 (2000).
25. Hyde, J. E. Some characteristics of voluntary human ocular movements in the horizontal plane. Am. J. Ophthalmol. 48, 85–94
(1959).
26. Wheeless, L. L., Cohen, G. H. & Boynton, R. M. Luminance as a parameter of the eye movement control system. J. Opt. Soc. Am.
57, 394–400 (1967).
27. Pepe, M. S. The Statistical Evaluation of Medical Tests for Classification and Prediction (Oxford University Press, New York, 2013).
28. Pepe, M. S. A regression modelling framework for receiver operating characteristic curves in medical diagnostic testing. Biometrika
84, 595–609 (1997).
29. Medeiros, F. A. et al. A statistical approach to the evaluation of covariate effects on the receiver operating characteristic curves of
diagnostic tests in glaucoma. Investig. Ophthalmol. Vis. Sci. 47, 2520–2527 (2006).
30. Ludbrook, J. Confidence in Altman-Bland plots: A critical review of the method of differences. Clin. Exp. Pharmacol. Physiol. 37,
143–149 (2010).
Author contributions
A.J.T., H.M.B., B.W.F., and R.A.M. had the concept for the study; I.C.M., A.P., A.D.M. and L.A.C. conducted the
testing and collected data; A.J.T., H.M.B., B.W.F., and R.A.M. wrote the manuscript text and prepared the figures.
All authors reviewed the manuscript.
Funding
The Wellcome Trust (London, UK—research grant reference: 049574). International Glaucoma Association
(Ashford, Kent, UK). The sponsor or funding organization had no role in the design or conduct of this research.
Competing interests
A.J. Tatham, Research support (Allergan), Speaker (Allergan, Heidelberg Engineering, Santen, Thea); A.D.
McTrusty, None; L.A. Cameron, None; A. Perperidis, None; H.M. Brash, author on a related patent; I.C. Mur-
ray, author on a related patent; B.W. Fleck, None; R.A. Minns, author on a related patent.
Scientific Reports | (2021) 11:839 | https://doi.org/10.1038/s41598-020-80401-2 9
Vol.:(0123456789)www.nature.com/scientificreports/
Additional information
Correspondence and requests for materials should be addressed to A.J.T.
Reprints and permissions information is available at www.nature.com/reprints.
Publisher’s note Springer Nature remains neutral with regard to jurisdictional claims in published maps and
institutional affiliations.
Open Access This article is licensed under a Creative Commons Attribution 4.0 International
License, which permits use, sharing, adaptation, distribution and reproduction in any medium or
format, as long as you give appropriate credit to the original author(s) and the source, provide a link to the
Creative Commons licence, and indicate if changes were made. The images or other third party material in this
article are included in the article’s Creative Commons licence, unless indicated otherwise in a credit line to the
material. If material is not included in the article’s Creative Commons licence and your intended use is not
permitted by statutory regulation or exceeds the permitted use, you will need to obtain permission directly from
the copyright holder. To view a copy of this licence, visit http://creativecommons.org/licenses/by/4.0/.
© The Author(s) 2021
Scientific Reports | (2021) 11:839 | https://doi.org/10.1038/s41598-020-80401-2 10
Vol:.(1234567890)You can also read