Determination of Six Eugenol Residues in Aquatic Products by Gas Chromatography-Orbitrap Mass Spectrometry
←
→
Page content transcription
If your browser does not render page correctly, please read the page content below
Hindawi
Journal of Food Quality
Volume 2021, Article ID 9438853, 9 pages
https://doi.org/10.1155/2021/9438853

Research Article
Determination of Six Eugenol Residues in Aquatic Products by Gas
Chromatography-Orbitrap Mass Spectrometry

          Yunxia Huang , Qiang Li , Yali Zhang , Zhijuan Meng , Xiaoxuan Yuan ,
          Sufang Fan , and Yan Zhang
          Hebei Food Inspection and Research Institute, Heibei Food Safety Key Laboratory, Shijiazhuang 050227, Hebei, China

          Correspondence should be addressed to Sufang Fan; fansufang840502@sina.com and Yan Zhang; snowwinglv@126.com

          Yunxia Huang and Qiang Li contributed equally to this work.

          Received 10 June 2021; Revised 13 August 2021; Accepted 24 August 2021; Published 6 September 2021

          Academic Editor: Yuan Liu

          Copyright © 2021 Yunxia Huang et al. This is an open access article distributed under the Creative Commons Attribution License,
          which permits unrestricted use, distribution, and reproduction in any medium, provided the original work is properly cited.

          Eugenol compounds are widely used in the circulation and transportation of fresh aquatic products because of their good
          anesthetic effects. However, some studies have shown that eugenol compounds are potential carcinogens. Therefore, in order to
          ensure the edible safety of aquatic products, eugenol compounds in aquatic products need to be screened quickly. A method for
          determination of six eugenol residues in aquatic products was established by multiplug filtration cleanup (m-PFC), combined with
          gas chromatography-Orbitrap mass spectrometry (Orbitrap GC-MS). Samples were ultrasonically extracted with acetonitrile, and
          the extracts were frozen at −18°C for 1 h, then purified with the m-PFC column, and detected by Orbitrap GC-MS in full scan
          mode. The results showed the linear relationships for six eugenols were good in the range of 0.001–0.1 μg/mL, and the correlation
          coefficients (R2) were above 0.9950. The limits of detection (LODs) were 2–10 μg/kg, and the limits of quantitation (LOQs) were
          5–20 μg/kg. The average recoveries at the spiked levels of 5–200 μg/kg were in the range of 76.4%–105.1%, with relative standard
          deviations (RSDs) of 1.2%–7.5%. Eighty aquatic products were detected by this method, of which only eugenol was detected in 12
          samples, and eugenol and isoeugenol were detected in two samples at the same time. The other eugenol compounds were not
          detected in any sample. The detection rate of positive samples was 17.5%. The method is simple, accurate, and suitable for the rapid
          screening of eugenol compounds in aquatic products.

1. Introduction                                                          carcinogens [5]. Some countries imposed restrictions on the
                                                                         use of eugenol compounds. Japan stipulates that the max-
Eugenols are phenylpropanoid compounds, mainly in-                       imum residue limit of eugenol is 0.05 mg/kg in aquatic
cluding eugenol, isoeugenol, methyl eugenol, methyl iso-                 products. New Zealand established a residue limit of 0.1 mg/
eugenol, eugenol acetate, and acetyl isoeugenol [1]. Eugenol             kg, which was later revoked. The United States and Canada
compounds have a good anesthetic effect on fish, which can                 prohibit the use of eugenol compounds in aquatic products
keep them dormant by reducing the metabolic rate, thereby                [6]. In China, eugenol, isoeugenol, and methyl eugenol are
reducing injury and death caused by the stress reaction and              allowed to be used in food as spices, but not in raw and fresh
the deterioration of environment during storage and                      meat and fresh aquatic products. However, there is no clear
transportation. At the same time, they have the advantages               provision on the use of eugenol compounds as fishing an-
of low cost, good effect, and short residual period, so they are          esthetics. According to domestic reports in China, eugenol
widely used in the living transportation of aquatic products             compounds have been detected in aquatic products, such as
[2, 3]. However, the safety of eugenols as the fishing an-                fish, shrimps, and crabs. It shows that eugenol compounds
esthetic is controversial in the world. It had been reported             are being illegally used in aquatic products in China.
that eugenol is a potential carcinogen, and it can cause                 Therefore, the establishment of detection methods for eu-
damage to human liver [4]. International Agency for Re-                  genol compounds in aquatic products can provide strong
search on Cancer (IARC) listed it as the third category of               technical support and guarantee for China to supervise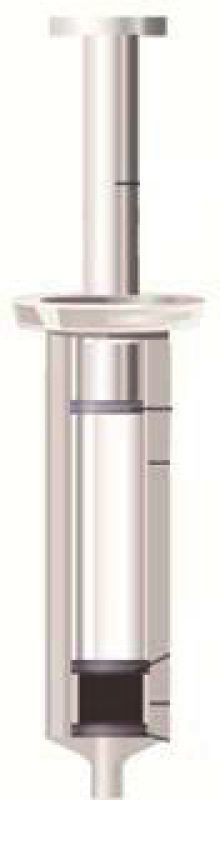
2 Journal of Food Quality
eugenol compounds residues in fresh aquatic products and
formulate relevant standards.
In the current research, the preprocessing methods of
eugenol residues include derivative [7], solid-phase ex-
m-PFC Syringe
traction [8], and QuEChERS [5]. The main detection
methods include liquid chromatography (LC) [9], liquid
chromatography-tandem mass spectrometry (LC-MS/MS)
[6], gas chromatography-mass spectrometry (GC-MS) [10],
and gas chromatography-tandem mass spectrometry (GC- Sealing Piston
MS/MS) [11]. Sun et al. [12] established a new method for m-PFC Column
the determination of eugenols in aquatic products by dis-
persive solid-phase extraction with graphitized carbon black Sieve plates 1
as absorbent coupled with ultra-high-performance liquid
chromatography-tandem mass spectrometry (UHPLC-MS/
MS). Ni et al. [13] determined the residues of four eugenol Sorbents (MWCNTs+PSA+MgSO4)
anesthetics in aquatic products by HLB solid-phase column
combined with UHPLC-MS/MS. Ke et al. [14] determined
the residues of eugenol, methyl eugenol, and isoeugenol in Sieve plates 2
fish by phenyl solid-phase column combined with GC-MS/ Figure 1: Structure diagram of m-PFC column.
MS. The SPE involves activation, leaching, and elution.
QuEChERS requires vortex and centrifugation. These two
methods are not suitable for batch processing of a large provides an effective technical support for the supervision of
number of samples. Multiplug filtration cleanup (m-PFC) is eugenol compounds in aquatic products.
a new and rapid method for sample pretreatment based on
the QuEChERS method. As shown in Figure 1, this method 2. Materials and Methods
places purification packing in the syringe. The extraction
solution is pushed through the packing layer containing 2.1. Reagent. Eugenol, methyl eugenol, isoeugenol, methyl
multiwalled carbon nanotubes (MWCNTs), primary sec- isoeugenol, eugenol acetate, and acetyl isoeugenol were used
ondary amine (PSA), and MgSO4. The filler adsorbs the as standards, with a purity more than 98%; they were
interfering substances in the matrix, such as pigments, lipids, purchased from Shanghai Anpu Experimental Technology
some sugars, sterols, and organic acids. However, it does not Co., Ltd. Acetonitrile, methanol, acetone, ethyl acetate, n-
adsorb the target compounds. By realizing one-step puri- hexane, and ether were all in HPLC grade and were pur-
fication, the purification time is greatly shortened, and the chased from Merck, Germany. Anhydrous sodium sulfate
pretreatment efficiency can be greatly improved. At present, was used as the analytical reagent, purchased from Tianjin
m-PFC column has been used to detect pesticides [15–20], Guangfu Science and Technology Development Co., Ltd.
antibiotics [21], and veterinary drugs [22] in foods. Aquatic QuEChERS pipe 1 (2 mL) included 150 mg MgSO4, 50 mg
products are rich in proteins and fats and contain pigments, PSA, and 50 mg C18, and QuEChERS pipe 2 (2 mL) included
organic acids, fatty acids, and other impurities. Ordinary 150 mg MgSO4, 50 mg PSA, 50 mg C18, and 50 mg GCB,
mass spectrometry analysis is prone to interference and false purchased from Thermo, USA. The m-PFC column included
positive. Gas chromatography-Orbitrap mass spectrometry 150 mg MgSO4, 15 mg PSA, and 15 mg MWCNTs, pur-
(Orbitrap GC-MS) is a new technology for mass spec- chased from Beijing Lvmian Technology Co., Ltd.
trometry emerged in recent years, which has high resolution,
high quality accuracy, and high sensitivity. So, it can ac-
curately determine the target compounds in complex matrix. 2.2. Materials. All the aquatic products used in the exper-
At present, Orbitrap GC-MS has been used in environment iment were purchased from the local supermarket.
analysis [23, 24], pharmaceutical research [25], and food
analysis [26–28]. So far, there are no reports on the de-
termination of eugenol compounds in aquatic products by 2.3. Preparation of Sample. 2.0 g crushed samples were
m-PFC column combined with Orbitrap GC-MS. weighed, and then, 1 g anhydrous sodium sulfate was added
In order to screen eugenol residues in aquatic products to the samples. Then, the samples were stirred and mixed,
accurately and quickly, the sample was prepared by m-PFC and 5 ml acetonitrile was added. Next, the sample was
column with MWCNTs as purification packing and detected vortexed for 1 min and extracted by ultrasound for 10 min.
by Orbitrap GC-MS in full scan mode through retention After centrifugation at 9500 rpm for 3 min, the extract was
time and accurate molecular mass. In this study, it was the transferred to another 50 mL centrifuge tube, and the sample
first time that m-PFC column combined with Orbitrap GC- was repeatedly extracted with 5 mL acetonitrile. Last, all the
MS was applied to detect six eugenol residues in aquatic extracts were combined and frozen for 1 h at −18°C. As
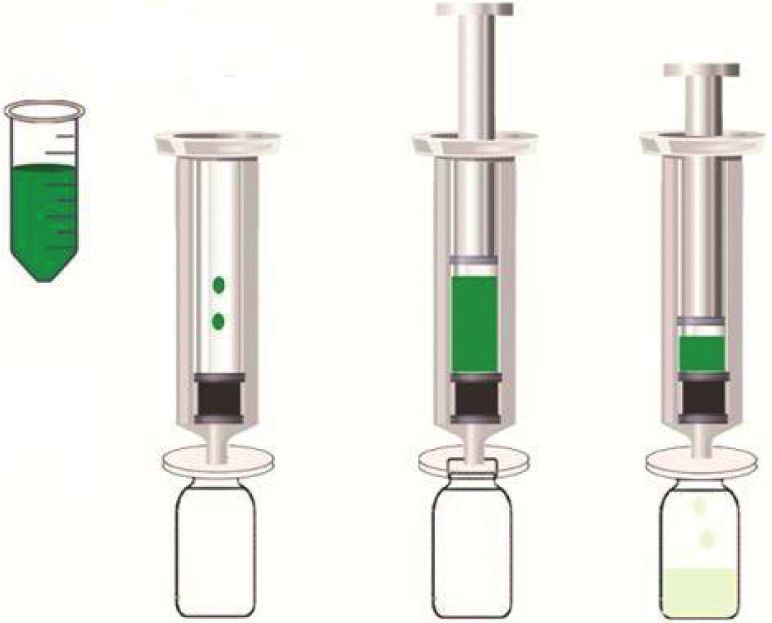
products. This method can not only achieve rapid pre- shown in Figure 2, 2 mL extracts were added to the m-PFC
treatment of samples but also has a strong ability to resist column, which was connected with a 0.22 μm organic filter
matrix interference and achieve accurate detection, which membrane placed on top of the sample bottle. The injectionJournal of Food Quality 3
set at 300°C. The mass spectrometry parameters are shown in
Table 1.
3. Results and Discussion
3.1. Establishment of Database. The standard solution
(0.2 μg/mL) of eugenol compounds was injected into
PUSH Orbitrap GC-MS, and the data were collected in full scan
mode to obtain the retention time for the target compounds,
the exact molecular mass, and the chemical formula of the
fragment ions. Figure 3 shows the full-scan mass spectro-
gram of six eugenol compounds. Three fragment ions with
high response were selected as quantitative and qualitative
ions for each compound. Then, the retention time for each
compound and ion information (exact molecular mass,
chemical formula) were imported into the database.
Figure 2: Purification procedure diagram of m-PFC column. According to the established database, the rapid qualitative
and quantitative determination of eugenol compounds can
rod was slowly pushed (1–1.5 s/drop) to get the filtrate, be realized. Compared with GC-MS/MS, Orbitrap GC-MS
which was used for detection by Orbitrap GC-MS. does not need to optimize ion pairs and collision voltages
and can establish the database in full scan mode. So, the
method is simpler to establish.
2.4. Preparation of Standard Solution
2.4.1. Preparation of Mixed Standard Solution. Six eugenol 3.2. Optimization of Extraction Solvent. Eugenol com-
standards were accurately weighed and diluted with ace- pounds are weak in polarity, slightly soluble in water, and
tonitrile to prepare a mixed standard solution containing easily soluble in some organic solvents. In this study, the
1000 μg/mL and 10 μg/mL. extraction effects of six kinds of solvents (acetonitrile, ac-
etone, methanol, ethyl acetate, n-hexane, and ether) for
eugenol compounds (the spiked level of 200 μg/kg) were
2.4.2. Preparation of Matrix-Matched Standard Solution. compared (Figure 4). The results showed that when aceto-
2.0 g blank sample was accurately weighed and pretreated nitrile and methanol were used as extraction solvents, the
according to Section 2.3, to obtain a blank matrix solution. recoveries of six eugenol compounds were 81.4%–95.7% and
The mixed standard solution (10 μg/mL) was diluted into a 82.7%–94.1%, respectively, and the RSDs were in the range
series of standard working solutions of 0.001 μg/mL, of 3.2%–6.8% and 3.7%–7.1%, respectively. When extracting
0.002 μg/mL, 0.003 μg/mL, 0.004 μg/mL, 0.01 μg/mL, with n-hexane, the recovery rate of each compound was
0.02 μg/mL, 0.05 μg/mL, and 0.1 μg/mL with blank matrix poor, ranging from 29.7% to 75.8%, and RSD was 2.5% to
solution. 6.6%. When extracting with ethyl acetate, acetone, and ether,
the recovery rates of eugenol and isoeugenol were all over
75%, while the recovery rates of the other four compounds
2.5. Orbitrap GC-MS Analytical Conditions. The chroma- were poor, ranging from 35.6% to 68.7%. In addition, the
tography assay was performed on Orbitrap GC-MS system solution color after extraction with methanol, acetone, ethyl
equipped with an auto sample manager (Thermo acetate, and ether was darker than the solution color after
Scientific, Bremen, Germany). The chromatographic sepa- extraction with acetonitrile and n-hexane. Therefore, con-
ration was performed on Agilent DB-5MS column, sidering the recovery rate and the subsequent purification,
30 m × 0.25 mm × 0.25 μm. The injection port temperature acetonitrile was selected as the extraction solvent for sub-
was set to 230°C, and the injection mode was splitless. The sequent experiments.
helium (purity ≥ 99.999%) was used as carrier gas. The
column flow was set to 1.0 mL/min. The temperature of the
column was set as follows: maintain the initial temperature 3.3. Optimization of Extraction Method. In this study,
at 100°C for 1 min, first, increase the temperature to 200°C at negative prawns were selected to investigate the extraction
a rate of 6°C/min; increase the temperature to 300°C at a rate effects of oscillation extraction, ultrasonic extraction, and
of 25°C/min; finally, hold for 5 min. The injection volume homogeneous extraction for six eugenol compounds at the
was 1 μL. The detector was electrostatic field Orbitrap high spiked level of 200 μg/kg (in Figure 5). The result showed
resolution mass spectrometry. The Orbitrap resolving power that the recoveries of oscillation extraction were in the range
was set at 60,000 full width at half maxima (FWHM) at 200 of 69.5%–82.7%, and the RSDs were in the range of 3.4%–
m/z. The dates were collected in the range of 50–550 m/z by 6.6%. The recoveries of ultrasonic extraction and homoge-
full scan mode. Ion source was electron ionization (EI), and neous extraction were in the range of 84.7%–96.6% and
the electron energy was 70 eV. The ion source temperature 82.4%–94.9%, respectively, and the RSDs were in the range
was set at 230°C, and the MS transfer line temperature was of 2.6%–7.3% and 2.0%–6.4%, respectively, which were4 Journal of Food Quality
Table 1: The retention time and MS parameters of six eugenols.
CAS
Compound Retention time (min) Quantitative ion (m/z) Qualitative ion 1 (m/z) Qualitative ion 2 (m/z)
registry number
Eugenol 97-53-0 7.94 164.08318 131.04914 149.05971
Methyl eugenol 93-15-2 8.76 178.09883 147.08044 107.04914
Isoeugenol 97-54-1 9.70 164.08318 131.04914 149.05971
Methyl isoeugenol 93-16-3 10.55 178.09883 163.07536 107.04914
Eugenol acetate 93-28-7 11.10 164.08318 131.04914 149.05971
Acetyl isoeugenol 93-29-8 12.77 164.08318 149.05971 131.04914
140 140
164.08292
178.09865
120 120
Relative Abundance
Relative Abundance
100 100
147.08035
107.04911
80 80
131.04904
149.05951
60 60
40 40
20 20
0 0
60 80 100 120 140 160 180 200 220 240 260 280 300 60 80 100 120 140 160 180 200 220 240 260 280 300
m (z) m (z)
(a) (b)
140 140
164.08305
178.09857
120 120
Relative Abundance
Relative Abundance
100 100
107.04906
80 80
163.07516
149.05965
131.04916
60 60
40 40
20 20
0 0
60 80 100 120 140 160 180 200 220 240 260 280 300 60 80 100 120 140 160 180 200 220 240 260 280 300
m (z) m (z)
(c) (d)
140 140
164.08321
164.08295
120 120
Relative Abundance
Relative Abundance
100 100
80 80
149.05980
149.05957
131.04929
60 60
131.04909
40 40
20 20
0 0
60 80 100 120 140 160 180 200 220 240 260 280 300 60 80 100 120 140 160 180 200 220 240 260 280 300
m (z) m (z)
(e) (f )
Figure 3: Mass spectrogram of six eugenols. (a) Eugenol. (b) Methyleugenol. (c) Isoeugenol. (d) Methyl isoeugenol. (e) Eugenol acetate.
(f ) Acetyl isoeugenol.Journal of Food Quality 5
120 extraction is small. The ultrasonic instrument is not only
easy to maintain but also can deal with a large number of
100 samples at one time, which is suitable for batch processing of
samples. Considering the recovery rate and pretreatment
80 efficiency, the ultrasonic extraction method was selected in
subsequent experiments.
Recovery (%)
60
40
3.4. Optimization of Purification Conditions. The matrix of
aquatic products is complex, which is rich in proteins, fats,
organic acids, pigments, and other substances. During the
20
pretreatment, these impurities would be extracted with the
target substances, which not only interfere the determina-
0
Acetonitrile Acetone Methanol Ethyl Acetate n-Hexane Ether tion but also pollute the instrument, so it is necessary to
Extraction Solvent purify the extracts effectively. Before the purification, the
Eugenol Methyl Isoeugenol
extracts were frozen for 1 h at −18°C to make some proteins
Methyl Eugenol Eugenol Acetate
and fats condensed and precipitated. However, the impu-
Isoeugenol Acetyl Isoeugenol
rities could not be completely removed, which needed
further purification. The matrix mixed standard solution
Figure 4: Selection of the extraction solvents. The error bars (0.1 μg/mL) was prepared with the extracts of negative
represent the standard deviation of measurements for each com- prawns to investigate the purification effects of QuEChERS
pound (n � 6).
pipes, m-PFC column, and n-hexane saturated with aceto-
nitrile (Table 2).
120 After purification by QuEChERS pipe 1 and QuEChERS
pipe 2, the recoveries of six eugenols were 87.2%–102.4%
100 and 77.0%–90.5%, respectively. After purification by m-PFC
column and n-hexane saturated with acetonitrile, the re-
80 coveries of six eugenols were 93.8%–103.7% and 93.2%–
Recovery (%)
102.5%, respectively. PSA is a kind of weak anion exchange
60
packing, which can adsorb polar compounds through hy-
drogen bonds and remove polar substances, such as pig-
ments, organic acids, and sugars. However, the purification
40
ability is limited, and the interfering substances in the matrix
cannot be effectively removed [29]. Because of the high
20
specific surface area, GCB can effectively adsorb impurities
such as pigments, sterols, and fats. However, because of the
0
Oscillation Ultrasound Homogenization hexagonal structure on its surface, GCB has a strong ad-
Extraction Method sorption effect on molecules containing planar aromatic
rings. Eugenol compounds contain benzene rings, so their
Eugenol Methyl Isoeugenol recovery rates were lower when GCB was used for purifi-
Methyl Eugenol Eugenol Acetate cation. MWCNTs are a kind of nanometer hollow material
Isoeugenol Acetyl Isoeugenol with higher specific surface area and more excellent me-
Figure 5: Selection of extraction methods. The error bars represent chanical properties and chemical stability than traditional
the standard deviation of measurements for each compound adsorption materials. It can adsorb interfering substances,
(n � 6). such as pigments, fatty acids, organic acids, and fats, in
samples through electrostatic interaction and π-π bond
interaction among MWCNTs [30, 31]. It can also reduce the
better than oscillation extraction. During ultrasonic ex- adsorption of substances with planar structure. Therefore,
traction, ultrasonic wave produced the high-speed and the recovery rate of eugenol compounds after purification by
strong cavitation effect on the samples, and the sample cells m-PFC column was higher than QuEChERS pipe 2. In
were broken, which could release the target compounds addition, compared with QuEChERS, because the m-PFC
better and faster, thus realizing the full extraction of the column adopts injector design, the purification does not
target compounds. During homogenization extraction, the require vortex oscillation and centrifugation. So, the oper-
samples could be completely broken by the homogenizer ation is simple and the purification process takes less than 2
and fully homogenized with the extraction solvent, so that min. N-hexane saturated with acetonitrile is a kind of ef-
the target compounds could be well extracted. These two fective organic reagent for purification, but it not only
methods can extract the target compounds well, but the pollutes the environment but also is harmful to health. The
homogenized cutter head needs to be cleaned after use, and purification process of m-PFC column does not consume
the number of samples treated by homogenization any organic reagents, which is convenient to operate and6 Journal of Food Quality
Table 2: Effects of different purification methods on the recoveries of six eugenols (n � 6).
Recovery (RSD) (%)
Compound QuEChERS 1 QuEChERS 2 m-PFC column N-hexane saturated
(PSA + C18) (PSA + C18 + GCB) (PSA + MWCNTs) with acetonitrile
Eugenol 87.2 (3.4) 88.4 (2.4) 99.1 (3.2) 98.7 (2.9)
Methyl eugenol 102.4 (2.9) 90.5 (1.8) 103.7 (2.4) 102.5 (2.2)
Isoeugenol 92.8 (3.9) 78.2 (2.3) 93.8 (1.8) 93.2 (3.0)
Methyl isoeugenol 99.6 (3.2) 77.0 (3.0) 99.3 (2.5) 98.6 (2.8)
Eugenyl acetate 97.4 (2.6) 90.0 (2.7) 101.5 (3.4) 100.2 (2.7)
Acetyl isoeugenol 93.7 (3.7) 82.1 (3.1) 101.1 (1.7) 99.8 (2.4)
suitable for batch processing of a large number of samples. addition resulting in a signal-to-noise ratio of 10 : 1 (Table 3).
Therefore, m-PFC column was selected for purification in The correlation coefficients (R2) for each compound were all
subsequent experiments. above 0.9950. The LODs and the LOQs were in the range of
2–10 μg/kg and 5–20 μg/kg, respectively, which were lower
than those of the references (the LODs and the LOQs of six
3.5. Matrix Effect. Negative pomfrets, prawns, and crabs eugenols were all 0.01 mg/kg and 0.02 mg/kg, respectively)
were selected to obtain the corresponding blank matrix [32, 33].
solutions according to Section 2.3. The matrix effects of six
eugenol compounds in the three substrates were investigated
through comparing 0.1 μg/mL matrix standard solutions and 3.6.2. Accuracy and Precision of Method. To test accuracy
0.1 μg/mL acetonitrile standard solutions. The relative in- and precision of the developed method, recovery experi-
tensity of matrix effect (ME) � (peak area of matrix standard ments were performed for each matrix (pomfret, prawn, and
solution/peak area of solvent standard solution) × 100%. The crab) in sextuplicate at three spiked levels (1 × LOQ,
results showed that six eugenol compounds showed different 2 × LOQ, and 10 × LOQ). The accuracy was estimated by
matrix enhancement effects in pomfrets, prawns, and crabs, recoveries (%) and the precision was evaluated by RSDs (%)
with the ME ranging from 106% to 152%. It was found that of the spiked samples (Table 4). The results showed that the
the matrix effects of six eugenol compounds were different in mean recoveries of six compounds were in the range of
the same matrix. For example, the matrix effects of six 76.4%–105.1% at three levels. The average RSDs were 1.2%–
eugenol compounds were in the range of 111.6%–148.1% in 7.5%. The results met the requirements of experimental
the prawns, and the ME of isoeugenol was the strongest. In analysis.
addition, the matrix effects of the same compound were also
different in different substrates. For example, the matrix
3.7. The Advantages of the Method. To compare this ex-
effects of eugenol in pomfrets, prawns, and crabs were
perimental method with BJS 201908 [33] method, the re-
116.7%, 131.3%, and 151.2%, respectively. This result is
covery rates of six eugenol compounds were investigated at
basically consistent with the research result of Yu et al. [32],
the spiked level of 100 μg/kg in prawns. The results showed
which may be caused by the differences of proteins, fats,
that the recoveries of two methods were in the range of
pigments, and organic acids in different aquatic products.
75.6%–106.1% and 76.7%–104.3%, respectively, without
However, when Xiaoqin Yu used n-hexane saturated with
significant difference. However, the LODs and LOQs of this
acetonitrile to purify samples, the ME of eugenol, methyl
method are lower than BJS 201908. In addition, all six eu-
eugenol, and isoeugenol was in the range of 148%–211%,
genol compounds are liquid at room temperature, with low
which was much greater than that of m-PFC column. This
boiling point and strong volatility. Many steps for purifi-
showed that m-PFC column can effectively remove the
cation and nitrogen blowing concentration can easily cause
interfering substances, obviously reduce the matrix effect,
loss of eugenol compounds. In this study, the extracts were
ensure a good recovery rate, and make the quantification
directly purified by m-PFC column after being frozen and
more accurate. Considering the existence of matrix effect,
degreased. The purification did not need organic reagents,
the corresponding matrix standard solutions were prepared
vortex vibration, and elution. The purified solution did not
for quantitative analysis.
need to be concentrated and could be directly analyzed by
the instrument. Compared with QuEChERS and SPE, the
3.6. Method Validation purification by m-PFC column is simple and fast, which can
avoid the loss of eugenol compounds and ensure a higher
3.6.1. Linearity and Sensitivity. A series of matrix mixed recovery rate. In addition, the study used Orbitrap GC-MS
standard working solutions (0.001–0.1 μg/mL) were pre- to collect data in full scan mode. Compared with ordinary
pared. The standard curves were drawn between the peak mass spectrometry, Orbitrap GC-MS has the advantages of
area (Y) and the injection mass concentration (X, μg/mL) of high resolution, sensitivity, and quality accuracy, which can
each compound. The limit of detection (LOD) was defined as reduce interference, avoid false positives, and achieve ac-
the lowest addition resulting in a signal-to-noise ratio of 3 : 1. curate determination in complex matrix. On the basis of
The limit of quantification (LOQ) was defined as the lowest ensuring the sensitivity, accuracy, and precision of theJournal of Food Quality 7
Table 3: Linearity, LODs, and LOQs of six eugenols.
Compound Linear range (μg/mL) Substrate Linear equation R2 LOD (μg/kg) LOQ (μg/kg)
Pomfret Y � 6.456 × 10⁷X + 5.571 × 10⁴ 0.9991
Eugenol 0.003–0.1 Prawn Y � 7.460 × 10⁷X + 6.102 × 10⁴ 0.9993 5 15
Crab Y � 8.906 × 10⁷X + 4.201 × 10⁴ 0.9987
Pomfret Y � 6.058 × 10⁷X + 1.545 × 10³ 0.9984
Methyl eugenol 0.002–0.1 Prawn Y � 5.042 × 10⁷X + 3.711 × 10³ 0.9981 3 10
Crab Y � 7.011 × 10⁷X + 6.143 × 10³ 0.9990
Pomfret Y � 4.141 × 10⁷X + 3.957 × 10⁴ 0.9981
Isoeugenol 0.004–0.1 Prawn Y � 4.969 × 10⁷X + 1.745 × 10⁴ 0.9974 10 20
Crab Y � 5.590 × 10⁷X + 3.002 × 10⁴ 0.9987
Pomfret Y � 1.183 × 10⁸X + 9.997 × 10³ 0.9976
Methyl isoeugenol 0.001–0.1 Prawn Y � 1.689 × 10⁸X + 1.151 × 10³ 0.9991 2 5
Crab Y � 1.301 × 10⁸X + 3.147 × 10³ 0.9977
Pomfret Y � 1.489 × 10⁸X + 6.276 × 10³ 0.9998
Eugenyl acetate 0.001–0.1 Prawn Y � 2.322 × 10⁸X + 4.307 × 10³ 0.9980 2 5
Crab Y � 1.786 × 10⁸X + 4.112 × 10³ 0.9983
Pomfret Y � 1.727 × 10⁸X + 4.174 × 10³ 0.9989
Acetyl isoeugenol 0.001–0.1 Prawn Y � 2.172 × 10⁸X + 3.014 × 10³ 0.9986 2 5
Crab Y � 1.986 × 10⁸X + 5.751 × 10³ 0.9971
Table 4: The recoveries of six eugenols at three spiked levels (n � 6).
Recovery (RSD) (%)
Compound Spiked level (μg/kg)
Pomfret Prawn Crab
15 101.2 (4.1) 95.2 (5.5) 100.2 (5.2)
Eugenol 30 98.7 (4.8) 99.7 (3.8) 102.7 (7.2)
150 105.1 (7.5) 103.4 (3.3) 101.8 (6.6)
10 89.4 (5.3) 83.1 (6.3) 86.3 (4.9)
Methyl eugenol 20 81.5 (3.3) 88.9 (3.7) 84.3 (7.1)
100 81.9 (2.5) 84.4 (7.4) 85.1 (5.8)
20 100.4 (6.7) 96.6 (4.8) 98.7 (4.9)
Isoeugenol 40 93.5 (3.4) 93.8 (5.5) 92.6 (2.1)
200 91.3 (3.5) 96.5 (2.8) 95.2 (4.6)
5 84.6 (5.2) 86.1 (5.4) 83.0 (5.7)
Methyl isoeugenol 10 79.7 (1.2) 80.6 (3.1) 81.2 (1.9)
50 88.4 (4.1) 82.9 (4.4) 84.6 (2.3)
5 81.7 (5.5) 82.8 (6.8) 85.8 (2.6)
Eugenyl acetate 10 87.2 (2.8) 84.7 (4.6) 78.4 (4.9)
50 86.7 (4.6) 82.8 (2.9) 83.5 (6.3)
5 82.6 (1.5) 84.6 (7.2) 76.4 (2.7)
Acetyl isoeugenol 10 77.9 (6.2) 80.8 (5.2) 84.8 (1.8)
50 83.4 (2.8) 81.4 (4.5) 81.3 (1.9)
Table 5: Detection value of eugenol compounds in positive samples.
Contents (μg/kg)
No. Sample
Eugenol Isoeugenol
1 Grouper 1 44.2 102.5
2 Grouper 2 105.1 80.3
3 Grouper 3 331.4 —
4 Grouper 4 98.3 —
5 Perch 1 189.7 —
6 Perch 2 225.2 —
7 Perch 3 75.4 —
8 Pomfret 1 136.4 —
9 Pomfret 2 209.1 —8 Journal of Food Quality
Table 5: Continued.
Contents (μg/kg)
No. Sample
Eugenol Isoeugenol
10 Pomfret 3 36.4 —
11 Turbot 1 48.1 —
12 Turbot 2 111.9 —
13 Tilapia 1 84.8 —
14 Tilapia 2 17.0 —
“—” indicates undetected.
method, the usability and analysis efficiency of the method Acknowledgments
are greatly improved.
The work was supported by the National Key Research and
Development Program of China (2018YFC1603400), High-
3.8. Testing of Actual Samples. Eighty samples (50 fish, 15 Level Talent Funding Project (A201901008), and Science and
shrimps, and 15 crabs) were detected by the established Technology Project of Hebei Market Supervision Admin-
method, and the results are shown in Table 5. Eugenol was istration (2020ZD12).
detected in 14 samples with concentrations ranging from
17.0 to 331.4 μg/kg. Isoeugenol was detected only in two References
samples at concentrations of 80.3 μg/kg and 102.5 μg/kg,
[1] S. M. Wu, X. M. Cai, and P. Zhou, “Determination of 6
respectively. The other eugenol compounds were not de-
eugenol residues in aquatic products by ultra-high perfor-
tected in any sample. The incidence of anesthetic residue in mance liquid chromatography-tandem mass spectrometry,”
all the samples was 17.5%. The positive samples included 12 Food Science, vol. 41, no. 16, pp. 320–326, 2020.
seawater fish (grouper, perch, pomfret, and turbot) and two [2] S. J. Cooke, C. D. Suski, K. G. Ostrand, B. L. Tufts, and
freshwater fish (tilapia), and six eugenol compounds were D. H. Wahl, “Behavioral and physiological assessment of low
not detected in shrimps and crabs. The frequencies of eu- concentrations of clove oil anaesthetic for handling and
genol compounds were higher in seawater fish than fresh- transporting largemouth bass (Micropterus salmoides),”
water fish. According to the test results, eugenol compounds Aquaculture, vol. 239, no. 1, pp. 509–529, 2004.
have been widely used in fisheries as anesthetics in China, [3] S. Akbari, M. J. Khoshnod, H. Rajaian, and M. Afsharnasab,
and the detection and supervision of eugenol compounds in “The use of eugenol as an anesthetic in transportation of with
aquatic products should be strengthened. Indian shrimp (Fenneropenaeus indicus) post larvae,” Turkish
Journal of Fisheries and Aquatic Sciences, vol. 10, no. 3,
pp. 423–429, 2010.
4. Conclusions [4] D. C. Thompson, R. Barhoumi, and R. C. Burghardt,
“Comparative toxicity of eugenol and its quinone methide
The method for determination of six eugenol compounds in
metabolite in cultured liver cells using kinetic fluorescence
aquatic products was established by m-PFC column combined bioassays,” Toxicology and Applied Pharmacology, vol. 149,
with Orbitrap GC-MS and applied to detect actual samples. The no. 1, pp. 55–63, 1998.
samples were ultrasonically extracted with acetonitrile and [5] W. Huang, H. Q. Li, and J. F. Liu, “Determination of 6 kinds of
purified by m-PFC column, which was easy to operate. The eugenol derivatives residues in aquatic products by
compounds could be identified accurately by Orbitrap GC-MS QuEChERS-gas chromatography-mass spectrometry,” Jour-
through the retention time and precise molecular mass, which nal of Food Safety and Quality, vol. 9, no. 2, pp. 422–428, 2018.
could avoid false positive samples. The method provides a new [6] D. H. Zhao, Q. Wang, and X. F. Wang, “Determination of
technical support for rapid and accurate determination of six eugenol in fish and farming water by ultra performance liquid
eugenol compounds in aquatic products. chromatography-tandem mass spectrometry,” Food Science,
vol. 37, no. 24, pp. 252–256, 2016.
[7] Y. Lin, “Development and validation of a LC-MS/MS method
Data Availability for the determination of isoeugenol in finfish,” Food Chem-
istry, vol. 228, pp. 70–76, 2017.
The data used to support this study are available within the
[8] H. Liu, J. Li, and C. Wang, “Development of a SIDA-SPE-GC-
article. MS/MS isotope dilution assay for the quantification of eu-
genol in water samples,” Aquaculture Research, vol. 49, no. 1,
Conflicts of Interest pp. 582–585, 2017.
[9] C. X. Wang, G. Q. Xiong, and C. Bai, “Determination of
The authors declare that there are no conflicts of interest eugenol residues in channel catfish by high performance
regarding the publication of this paper. liquid chromatography,” Journal of Food Safety and Quality,
vol. 35, no. 6, pp. 301–307, 2019.
Authors’ Contributions [10] K. Schulz, K. Schlenz, S. Malt et al., “Headspace solid-phase
microextraction–gas chromatography–mass spectrometry for
Yunxia Huang and Qiang Li contributed equally to this the quantitative determination of the characteristic flavouring
work. agent eugenol in serum samples after enzymatic cleavage toJournal of Food Quality 9
validate post-offence alcohol drinking claims,” Journal of Orbitrap based gas chromatography-mass spectrometry,”
Chromatography A, vol. 1211, no. 1, pp. 113–119, 2008. Analytical and Bioanalytical Chemistry, vol. 408, no. 13,
[11] T. W. Lu, C. L. Ke, and Q. Liu, “Determination of three pp. 3401–3411, 2016.
eugenol anesthetics residues in culture pond water by gas [24] M. P. Li, R. Li, Z. J. Wang et al., “Determination of 16 kinds of
chromatography-mass spectrometry,” Chinese Journal of N-Nitrosamines in water by gas chromatography-quadrapole-
Analysis Laboratory, vol. 40, no. 5, pp. 518–522, 2021. orbitrap high resolution mass spectrometry,” Chinese Journal
[12] P. Sun, Y. Gao, and Y. Lian, “Determination of eugenol in of Analytical Chemistry, vol. 47, no. 2, pp. 288–296, 2019.
aquatic products by dispersive solid-phase extraction and [25] S. Baldwin, T. Bristow, A. Ray et al., “Applicability of gas
ultra-high-performance liquid chromatography-tandem mass chromatography/quadrupole-Orbitrap mass spectrometry in
spectrometry,” Food Analytical Methods, vol. 10, no. 10, support of pharmaceutical research and development,” Rapid
pp. 3217–3224, 2017. Communications in Mass Spectrometry, vol. 30, no. 7,
[13] Z. F. Ni, Y. Gu, Y. W. Feng, and Q.-H. Xue, “Simultaneous pp. 873–880, 2016.
determination of 4 eugenol derivatives anesthetics residues in [26] M. Tienstra and H. G. J. Mol, “Application of gas chroma-
aquatic products by UPLC-MS/MS,” Journal of Chinese Mass tography coupled to quadrupole-orbitrap mass spectrometry
Spectrometry Society, vol. 39, no. 4, pp. 451–458, 2018. for pesticide residue analysis in cereals and feed ingredients,”
[14] C. Ke, Q. Liu, L. Li, J. Chen, X. Wang, and K. Huang, “Si- Journal of AOAC International, vol. 101, no. 2, pp. 342–351,
multaneous determination of eugenol, isoeugenol and 2018.
methyleugenol in fish fillet using gas chromatography coupled [27] H. G. J. Mol, M. Tienstra, and P. Zomer, “Evaluation of gas
to tandem mass spectrometry,” Journal of Chromatography B, chromatography—electron ionization—full scan high reso-
vol. 1031, pp. 189–194, 2016. lution Orbitrap mass spectrometry for pesticide residue
[15] Z. J. Meng, Y. X. Huang, and P. Y. Di, “Rapid screening of 234 analysis,” Analytica Chimica Acta, vol. 935, pp. 161–172, 2016.
pesticide residues in vegetables and fruits by multi-plug fil- [28] Y. Z. Feng, T. Zhou, Y. Cai, Z. Chen, and M. Zhao, “Iden-
tration cleanup method combined with gas chromatography- tification of unknown aroma-active compounds of soy sauce
ouadrupole time of flight mass spectrometry,” Food Science, by gas chromatography-orbitrap-mass spectrometry,” Food
vol. 41, no. 16, pp. 272–285, 2020. Science, vol. 41, no. 18, pp. 218–225, 2020.
[16] Y. Qin, J. Zhang, Y. He et al., “Automated multiplug filtration [29] X. M. Liang, W. Y. Zhang, and W. Zhang, “Simultaneous
cleanup for pesticide residue analyses in kiwi fruit (actinidia determination of residues of 38 pesticides in fruits by
chinensis) and kiwi juice by gas chromatography-mass QuEChERS combined with high performance liquid chro-
spectrometry,” Journal of Agricultural and Food Chemistry, matography-tandem mass spectrometr,” Food Science, vol. 41,
vol. 64, no. 31, pp. 6082–6090, 2016. no. 8, pp. 288–296, 2020.
[17] N. Zou, Y. Han, Y. Li et al., “Multiresidue method for de- [30] X. Xu, X. Xu, M. Han, S. Qiu, and X. Hou, “Development of a
termination of 183 pesticide residues in leeks by rapid modified QuEChERS method based on magnetic multiwalled
Multiplug Filtration Cleanup and gas chromatography-tan- carbon nanotubes for the simultaneous determination of
dem mass spectrometry,” Journal of Agricultural and Food veterinary drugs, pesticides and mycotoxins in eggs by UPLC-
Chemistry, vol. 64, no. 31, pp. 6061–6070, 2016. MS/MS,” Food Chemistry, vol. 276, pp. 419–426, 2019.
[18] P. Y. Zhao, B. Y. Huang, Y. J. Li et al., “Rapid multiplug [31] S.-X. Guan, Z.-G. Yu, H.-N. Yu, C.-H. Song, Z.-Q. Song, and
filtration cleanup with multiple-walled carbon nanotubes and Z. Qin, “Multi-walled carbon nanotubes as matrix solid-phase
gas chromatography-triple-quadruple mass spectrometry dispersion extraction adsorbent for simultaneous analysis of
detection for 186 pesticide residues in tomato and tomato residues of nine organophosphorus pesticides in fruit and
products,” Journal of Agricultural and Food Chemistry, vol. 62, vegetables by rapid resolution LC-MS-MS,” Chromatogra-
no. 17, pp. 3710–3725, 2014. phia, vol. 73, no. 1-2, pp. 33–41, 2011.
[19] Y. Han, L. Song, N. Zou, Y. Qin, X. Li, and C. Pan, “Rapid [32] X. Q. Yu, K. Y. Fang, and M. Shao, “Determination of six clove
multiplug filtration cleanup method for the determination of phenol drug residues in aquatic products by using DMSO
124 pesticide residues in rice, wheat, and corn,” Journal of assisted concentration and gas chromatography-tandem mass
Separation Science, vol. 40, no. 4, pp. 878–884, 2017. spectrometry,” Science and Technology of Food Industry,
[20] Y. Han, L. Song, S. Liu et al., “Simultaneous determination of vol. 41, no. 17, pp. 258–262, 2020.
124 pesticide residues in Chinese liquor and liquor-making [33] State Administration of Market Supervision and Adminis-
raw materials (sorghum and rice hull) by rapid multi-plug tration of China, BJS201908: Determination of Eugenol
filtration cleanup and gas chromatography-tandem mass Compounds in Aquatic Products and Water, State Adminis-
spectrometry,” Food Chemistry, vol. 241, pp. 258–267, 2018. tration of Market Supervision and Administration of China,
[21] Y. Qin, F. Jatamunua, J. Zhang et al., “Analysis of sulfon- Beijing, China, 2019.
amides, tilmicosin and avermectins residues in typical animal
matrices with multi-plug filtration cleanup by liquid chro-
matography-tandem mass spectrometry detection,” Journal of
Chromatography B, vol. 1053, pp. 27–33, 2017.
[22] C. Tian, J. Xu, F. Dong et al., “Determination of sulfoxaflor in
animal origin foods using dispersive solid-phase extraction
and multiplug filtration cleanup method based on multiwalled
carbon nanotubes by ultraperformance liquid chromatogra-
phy/tandem mass spectrometry,” Journal of Agricultural and
Food Chemistry, vol. 64, no. 12, pp. 2641–2646, 2016.
[23] C. Postigo, C. I. Cojocariu, S. D. Richardson, P. J. Silcock, and
D. Barcelo, “Characterization of iodinated disinfection by-
products in chlorinated and chloraminated waters usingYou can also read