The Impact of the Coronavirus (COVID-19) Outbreak on Asia-Pacific Airways Stocks Prices: An Event-Study Approach
←
→
Page content transcription
If your browser does not render page correctly, please read the page content below
The Impact of the Coronavirus (COVID-19) Outbreak on
Asia-Pacific Airways Stocks Prices: An Event-Study
Approach
Musab Talha Akipinara , Keziban Seckin Codala
a Management                               Information Systems Ankara Yildirim Beyazit University

                                          Abstract
                                          Coronavirus SARS-CoV-2 (formerly 2019-nCoV) reported the first deadly infectious disease of on 11 January 2020. First
                                          cases were detected and China has alerted the World Health Organization (WHO) of several flu-like cases in Wuhan, the
                                          capital of Central China’s Hubei province with 11 million population. Patients have been quarantined and health authorities
                                          commenced work on tracing the source of the flu in last day of 2019. WHO has announced that 83,774 confirmed coronavirus
                                          cases (primarily in mainland China) and 2,867 deaths have been linked to the virus in 28 February 2020. This paper tries
                                          to describes the spread of the disease in Asia and discusses its impact on the airlines economy. Corona was an unexpected
                                          negative shock. The most significant negative effects were on the demand side, with national and international flights related
                                          to civil aviation severely affected in the short run. Fear and panic continuing once the outbreak was not under control.
                                          Treatment or vaccine was not found yet and the air transportation stock market has collapsed.

                                          Keywords
                                          Civil Aviation, Asia-Pacific Stock Markets, Coronavirus, Transportation Economy, Data Analytics

1. Introduction                                                                                                    while China plans to invest USD 130 billion in airports
                                                                                                                   which is supported the claim of the rise of both full ser-
Air transportation is a major industry in its own right                                                            vice and low-cost airlines [5]. The hubs like USA, EU,
and it also provides important inputs into wider eco-                                                              UAE, Singapore, China mutually supports and benefits
nomic, social and political processes. The aviation in-                                                            from their aviation sector and other sector such as ro-
dustry supports $2.7 trillion (3.5%) of the world’s GDP                                                            bust industrial, trading, maritime and tourism ecosys-
thus; it has always been seen to have an inherently                                                                tem. Leading aviation hubs drive the hinterland econ-
strategic role [1]. With 35 million flight departures per                                                          omy [6]. However, some hubs in Asia-Pacific weakly
year, data is critically important for any planning deci-                                                          deploy the hinterland economy, national carrier is weak,
sion made by airlines and airports [2]. To understand                                                              the tourism is inadequate, airport transfers are ineffi-
the structure of aviation sector the dominated interna-                                                            cient and no open skies agreement with other coun-
tional mega-hubs by Asia-Pacific, Europe, Middle East                                                              tries [5]. The literal meaning of this, Asia-Pacific re-
and Africa, North America and Latin America should                                                                 gion becomes the attractive aviation markets for other
be individually investigated. The most connected in-                                                               players due to the competitive strength of local carri-
ternational hubs in the Asia Pacific are the most con-                                                             ers. The three main sub-regions of Asia that is North-
nected Mega hub in the world for low-cost carriers.                                                                east Asia, Southeast Asia and South Pacific is attracted
According to IATA forecast to 2034, the routes to, from,                                                           foreign capital withal soaring the air traffic. The avi-
and within Asia-Pacific will carry 42% of all world traf-                                                          ation sector may confront the challenge that lead to
fic. The network airlines in Asia have reacted to low-                                                             inflict mass casualties, damage of economy or tourism
cost carriers (LLCs) in multiple ways, and competition                                                             and weakness of high safety and security standards [7].
increases to depend on the firm’s internal resources                                                               This challenge encompasses terrorist attack, sabotage,
and external environment [3]. Asia-Pacific comprises                                                               cyber-attack, biological, chemical and radiological at-
China and India, which is in developing markets in                                                                 tack and other airborne threat. In addition, this sec-
global aviation [4]. India’s investment pipeline for air-                                                          tor is frequently affected by pandemic causes compare
port upgrading and expansion is around USD 5 billion                                                               with other threat. The threat resulted with collateral
IVUS 2020: Information Society and University Studies, 23 April 2020,                                              damage for many sectors in the region. In the next fu-
KTU Santaka Valley, Kaunas, Lithuania                                                                              ture, the forecast of similar events could be done with
" takpinar@ybu.edu.tr (M.T. Akipinar); kscodal@ybu.edu.tr (K.S.                                                    the help of Artifial Intelligence Algorithms mostly by
Codal)
                                                                                                                   using high performance systems as described in [8, 9,

                                    © 2020 Copyright for this paper by its authors. Use permitted under Creative   10]. The spread of severe acute respiratory syndrome
                                    Commons License Attribution 4.0 International (CC BY 4.0).
 CEUR
 Workshop
 Proceedings
               http://ceur-ws.org
               ISSN 1613-0073       CEUR Workshop Proceedings (CEUR-WS.org)                                        coronavirus 2 (SARS-CoV-2) has taken on pandemic
proportions, affecting over 100 countries in a matter edge on the incident and confusing and contradictory
of weeks. In march 2020 Italy has rapidly become the reports voiced by numerous spokespeople. The disap-
country hit second hardest in the world by the coro- pearance of Malaysia Airlines’ flight MH370 has been
navirus pandemic [11, 12]. In this study, the impact one of the most highly discussed and debated crises
of COVID-19 epidemic on transportation economy is in last decade. The company’s net loss rose by 59%
examined. to $138M in the January-to-March period, marking its
fifth straight quarter of losses in 2014.
This loss caused significant financial problems for
2. The Threats Facing The Malaysia Airlines [19]. The endemic of a disease demon-
Aviation Industry strates how a single person could spread disease via
air travel and SARS was one of a number of outbreak
The first change was the deregulation of the airline global events in 2003 [20]. Air China Flight 112 was a
industry in 1978. A fundamental change in airline ser- scheduled international passenger flight on 15 March
vices was occurred after the Civil Aeronautics Board 2003 that carried a 72-year-old man infected with se-
eliminated restrictions on routes and fares. The sec- vere acute respiratory syndrome [21]. This man in-
ond major change was the dramatic downturn in the fected 20 passengers and two aircraft crew, resulting
US airline industry following the attacks of Septem- in the dissemination of SARS to northern Mongolia
ber 11, 2001. Although revenues had decreased at the and southern Thailand [22]. When SARS hit, global
major airlines before the 9/11 attacks, the subsequent passenger traffic fell by 18.5% in April 2003 compared
changes in travel behavior resulted in a 10 to 20 per- to a year earlier, with a drop of almost 45% in Asia-
cent decrease in national air transport capacity in just Pacific [23]. The COVID-19 outbreak will continue
a matter of weeks. This dramatic change has high- to be centered in China and spread to other markets.
lighted the key interdependencies between the econ- Thus, it expects the impact on airlines will be severe
omy and the airline industry [13]. The airline industry for those particularly exposed to the China market.
lost about $1.1 billion because of the decline, which is IATA estimates that global traffic will be reduced by
11 percent of the loss attributed directly to 9/11 [14]. 4.7% by the virus in 2019, which will more than off-
There is a clear and accepted securitizing move in re- set the growth the industry group previously forecast
sponse to the attacks of 9/11, the creation of new rules. and cause the first overall decline in demand since the
The 9/11 attacks were directly linked to airport secu- Global Financial Crisis of 2008-2009 [17]. That sce-
rity deficiencies, especially passenger screening, the nario would translate into lost passenger revenues of
securitization of civil aviation. The external threat of $29.3 billion [24]. In an attempt to better understand
terrorists using aircraft as weapons of mass destruc- COVID-19 external influences, this paper tries to ex-
tion resonated widely across the community, the po- amines some aspects of how the air transportation sys-
litical elite, the technocrats and the scientific commu- tem has had an impact on the airlines stock market and
nity. In particular, the real-time broadcast of the sec- transportation economy.
ond plane hitting the World Trade center, and the rep-
etition of those images, gave aviation security a dom-
inant position in the public imagination of homeland 3. COVID-19 Outbreak
security [15]. Between 2004 and 2007, several other
In December 2019, China informed the World Health
securitization and de-securitization steps took place,
Organization (WHO) that an infection by an unknown
involving mainstream, political, technocratic and sci-
agent, labelled as COVID-19, was detected in Wuhan,
ence communities [16]. Most airline crashes are char-
the capital city of the Hubei province. And by the
acterized by “the suddenness and fatal consequences
first week of this year, Chinese President Xi Jinping or-
of the triggering event” [17], which demand from an
dered his top officials to take all necessary measures to
airline an immediate response and high level of com-
fight COVID-19, leading to the complete lockdown of
munication with its stakeholders. Exceptionally, the
Wuhan city and Hubei province. While the COVID-19
disappearance of flight Malaysian Airlines 370 (MH370)
outbreak has currently infected almost 83,721 people
still remains one of the aviation’s greatest mysteries.
and caused 2868 casualties (as of 28 February) within
On March 8, 2014, a Boeing 777 with 239 people went
China, the number of confirmed infection and casual-
missing on a flight between Kuala Lumpur and Bei-
ties outside of China has reached 4,361 and 67 respec-
jing [18]. Malaysia Airlines was unable to provide con-
tively [23].
sistent crisis communication, due to the lack of knowl-
30shows that the percentage of change in flight traffic
based on year over year data. China’s three largest air-
lines reported declines in January passenger traffic due
to the coronavirus outbreak, with the shortfalls likely
to deepen this month through the epidemic contin-
ues to disrupt travel for millions of people. Air China
Ltd’s numbers slipped 2.9% from a year earlier, while
China Southern Airlines Co’s fell 4.6% and China East-
ern Airlines Corp.’s dropped 5.4%, according to state-
ments filed to Hong Kong’s stock exchange [2].
In this study, the loss on decreasing stock-exchange
value of some of the largest Asia-Pacific Airlines has
been monitored during the spread of the coronavirus
COVID-19. It is assumed that these sample; Singa-
Figure 1: Coronavirus: Global Confirmed Coronavirus pore Stock, Air China Ltd (0753), China Eastern Air-
Cases, Deaths and Recovered Numbers lines Corp Ltd (0670), China Southern Airlines Co Ltd
(1055), Hainan Airlines Co Ltd B (900945), Singapore
Airlines Ltd (SIAL), Air Asia Bhd (AIRA), Garuda In-
4. Methodology donesia Persero Tbk (GIAA), ANA Holdings Inc (9202),
Japan Airlines Co Ltd (9201) is represented the Asia-
The COVID-19 virus has been found in 30 countries, Pacific region. The starting point is determined as a
and growth of COVID-19 cases has kept on rising across December 31 that is first cases detected China and the
the world. In the Fig. 1, global confirmed coronavirus World Health Organization (WHO) was alerted for sev-
cases, deaths and number of recovered are seen. eral flu-like cases in Wuhan.
The pandemic’ social and economic effects may bring For this reason, all active stock days from January
to the shutdown in Asia-Pacific airlines to prevent the 1st to the present day have been analyzed and illus-
spread of coronavirus in homeland and overseas. The trated. Table 3 introduces the Asia- Pacific Airlines
International Air Transport Association has published stock exchange securities for round forty days. Airline
an initial assessment of the impact of COVID-19 which stocks are taking a hit in premarket trading Monday,
estimates total global lost airline revenue could be as amid growing worries about how the global spread
high as $29.3 billion, with a potential 13% full-year loss of COVID-19 will impact travel. The largest drop in
of passenger demand and $27.8 billion revenue loss in history occurred on February 2020 due panic over the
2020 for carriers in the Asia-Pacific region [25]. Air- 2019-2020 coronavirus outbreak.
lines registered in China would be most affected with Garuda Indonesia posted the biggest loss in the most
$12.8 billion lost in the China domestic market [26]. recent month, it will continue to lost money over time.
China is currently the world’s second-largest civil avi- The stock exchange securities of Air Asia, China East-
ation market, behind the United States, hauling in $151 ern Airlines, China Southern Airlines, Air China, Japan
billion in revenue last year, according to Xinhua. Ma- Airlines, ANA Holdings, Hainan Airlines, and Singa-
jor Chinese carriers Air China (AIRYY), China South- pore Airlines sharply dropped.
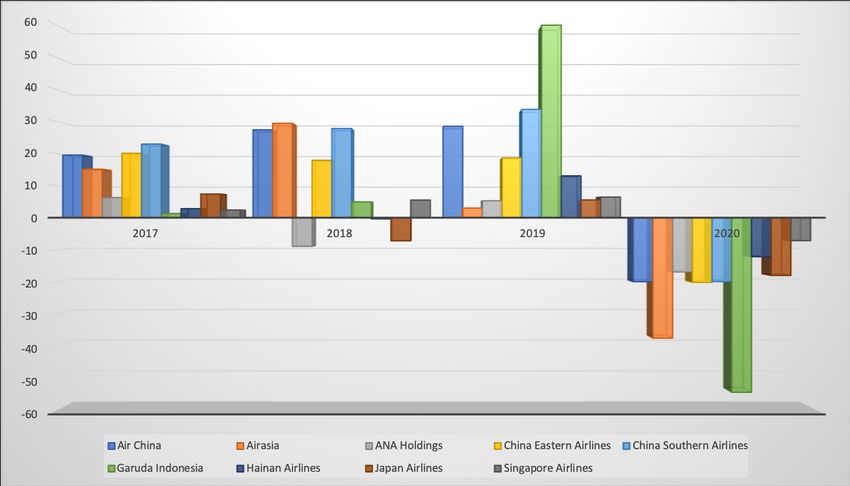
ern (ZNH) and China Eastern (CEA) have grown five The Fig. 2 shows below the 9 biggest Asia-Pacific
to six-fold compared to 2003 (Frost, 2020). It is shown Airways Stocks Prices for the last 5 years in January-
that China Air which is the flag carrier and one of the February. It is clearly shown that Asia Pacific airlines,
major airlines of the China based on last five-year Jan- which have always been profit taking in the last 4 years
uary flight traffics. Table 1 display the information of with 2 exceptions, faced dramatic declines in 2020.
Revenue Passenger-Kilometers (RPK), Revenue Tons - Especially, Garuda Indonesia and Air Asia compa-
Kilometers (RTK) and Revenue Freight Tons - Kilome- nies really affected Coronavirus (COVID-19) outbreak
ters (RFTK). in Asia.
Air China Flight traffic, which consists domestic and
international flight, dwindled unusually on the basis
of the previous year data on RTKs, RPKs, RFTKs and 5. Conclusion
number of passengers carried. Besides, freight trans-
portation via air cargo that has always been an integral Coronavirus fears drive stocks down especially in Asia
component of economy drastically reduced. Table 2 markets. The virus, which has now spread to 47 coun-
31Table 1
Air China Flights Traffic in last 5 years
Traffic Jan 2020 Jan 2019 Jan 2018 Jan 2017 Jan 2016
1. RTKs (in millions) 1999.2 2066.235 2208.4 2031.3 1893.1
Domestic 1098 1104.6 1077.5 1029 936.7
International 841.7 884.60 1064.30 938.40 890.00
Regional 59.5 77.10 66.70 63.90 66.40
2. RPKs (in millions) 18880 18930.60 17468.30 16803.90 15149.60
Domestic 11176.6 10960.50 10456.50 10186.20 8994.10
International 7106 7216.30 6395.00 6012.70 5537.10
Regional 597.3 753.70 616.80 605.00 618.40
3. RFTKs (in millions) 351 404.20 662.60 556.60 554.20
Domestic 123.8 144.00 154.10 138.60 144.30
International 224.3 252.70 499.10 409.70 400.20
Regional 3 43466.00 9.05 8.03 9.07
4. Number of Passengers carried (in thousands) 9188.8 9156.50 8590.30 8411.20 7523.70
Domestic 7334 7243.80 6980.80 6838.50 6038.20
International 1471.2 1441.10 1218.80 1191.70 1100.90
Regional 383.6 471.60 390.70 381.00 384.70
5. Total Cargo Tons Carried 110836.4 128179.40 165130.20 145413.20 148683.70
Domestic 76644.4 88339.60 95915.20 89029.40 92720.40
International 32022.8 35245.60 62275.40 50337.10 49164.80
Regional 2169.2 4594.10 6939.50 6046.60 6798.50
Load Factor Jan 2020 Jan 2019 Jan 2018 Jan 2017 Jan 2016
1. Passenger Load Factor (%) 76.6 79.90 79.00 81.70 79.50
Domestic 76.3 79.60 80.30 82.30 80.70
International 77.5 80.10 76.90 81.30 78.30
Regional 70.5 81.90 79.30 76.20 74.00
2. Cargo Load Factor (%) 35.3 40.60 55.20 49.80 52.60
Domestic 29.7 35.20 40.20 37.50 51.40
International 40 45.10 62.90 56.60 53.50
Regional 16.3 29.60 40.00 33.00 36.90
3, Overall Load Factor (%) 62.1 66.00 69.10 68.30 68.30
Domestic 63.3 67.10 69.30 69.40 73.00
International 60.6 64.40 68.90 67.50 64.20
Regional 59.9 68.70 68.70 63.90 63.30
tries (28 February), has put pressure on businesses and Not only Asian airlines but also Among the more-
supply chains around the world. Because of the coro- active carriers stock price dropped such as shares of
navirus, Asian markets closed sharply lower and Eu- United Airlines (Holdings Inc. UAL) -26%, Delta Air
ropean stocks tumbled at the start of trading. (Lines Inc. DAL) -21%, American Airlines (Group Inc.
The widening scope of the health crisis threatens to AAL) -31%, Southwest Airlines (Co. LUV) -15%, Deutsche
overwhelm global supply chains, especially in China, Lufthansa (AG LHAG) -29%, Air France KLM (SA AIRF)
the world’s second-largest economy after the United -30%.
States. In addition, the outbreak could crush consumer Initially, many businesses, investors, and companies
demand, as people limit travel or stay home even with- expected the coronavirus outbreak to be similar to the
out a government order to do so. Due to the coron- 2003 eruption of SARS, if perhaps a bit more painful.
avirus outbreak consumers change their behavior so However now that the virus has spread to the Middle
they stop flying, they don’t take the vacation, they can- East (Especially Iran) and Europe (closing big chunks
cel even the business trip. As a consequence, airlines of Italy’s northern economic heartland and even spread-
particularly Asian airways flight and their load factor ing into Spain) the worry is that what began as a con-
fall down as it mentioned above now therefore their tained outbreak could turn into a pandemic, as the World
stock prices collapsed [27]. Health Organization warned in February 2020. And fi-
32Table 2
Air China Flights Traffic % change in last 5 years
Traffic% change vs Jan 2019 % change vs Jan 2018 % change vs Jan 2017 % change vs Jan 2016 % change vs Jan 2015
1. RTKs -5.60% 7.80% 8.07% 7.10% 14.08%
Domestic -4.80% 7.10% 4.07% 9.08% 6.08%
International -5.10% 7.90% 13.04% 5.03% 24.03%
Regional -22.80% 18.00% 4.01% -3.80% 17.03%
2. RPKs -2.90% 10.90% 4.00% 10.09% 18.06%
Domestic -2.40% 8.90% 2.07% 13.02% 6.08%
International -1.90% 13.00% 6.04% 8.06% 43.70%
Regional -20.70% 20.80% 1.07% -2.20% 21.09%
3. RFTKs -14.20% -0.30% 19.00% 0.30% 7.07%
Domestic -16.90% 0.90% 11.02% -4.00% 10.04%
International -11.30% -1.00% 21.08% 2.02% 7.01%
Regional -60.30% -0.60% 13.01% -14.40% -3.70%
4. Passengers carried -4.10% 11.30% 2.01% 11.08% 11.08%
Domestic -4.20% 9.40% 2.01% 13.02% 6.09%
International 0.90% 18.70% 2.03% 8.02% 43.30%
Regional -18.70% 20.70% 2.03% -0.90% 21.06%
5. Total Cargo tons carried -15.50% 2.00% 13.06% -2.40% 8.04%
Domestic -16.10% 1.10% 7.07% -4.20% 9.05%
International -9.20% 4.90% 23.07% 2.02% 7.07%
Regional -52.80% -2.90% 14.08% -11.10% -0.90%
Table 3
Stock Change Securities for Airlines in Asia-Pacific Region in 2020 January/February
Airlines Stock Change between 02.01.2020-27.02.2020
Air China -19.94%
Air Asia -37.54%
ANA Holdings -16.91%
China Eastern Airlines -20.15%
China Southern Airlines -19.90%
Garuda Indonesia -54.39%
Hainan Airlines -12.17%
Japan Airlines -18.00%
Singapore Airlines -7.17%
References
[1] A. C., IATA, I. ICCAIA, Aviation benefits report,
19 (2019).
[2] W. Davies, China’s biggest airlines
report early hit from virus outbreak,
https://www.bloomberg.com/news/articles/2020-
02-17/chinese-airlines-begin-reporting-impact-
from-coronavirus (2020).
[3] M. B. Salter, Securitization and desecuritiza-
tion: a dramaturgical analysis of the canadian air
Figure 2: Stock change securities for airlines in asia-pacific transport security authority., Journal of interna-
region in 2020 january/february tional relations and development 11 (2008) 321–
349.
[4] K. Christidis, M. Devetsikiotis, Blockchains and
nally, stock markets are starting to recognize the un- smart contracts for the internet of things, Ieee
certainty. Access (2016) 2292–2303.
[5] P. K. Agrawal, Opportunities and financing out-
look for aviation sector. new delhi : Yes bank
33(2019). [18] Malaysia airlines losses worsen on mh370 disap-
[6] M. A. Coogan, Ground access to major airports pearance, https://www.bbc.com/news/business-
by public transportation, Transportation Re- 27435455 (2020).
search Board 4 (2008). [19] J. Bowen, Airline hubs in southeast asia: na-
[7] J. C. Henderson, Communicating in a crisis: tional economic development and nodal accessi-
flight sq 006, Tourism Management 24 (2003) bility, Journal of Transport Geography 8 (2000)
279–287. 25–41.
[8] S. Spanò, G. Cardarilli, L. Di Nunzio, R. Fazzolari, [20] Update 95 - sars: Chronology of a serial
D. Giardino, M. Matta, A. Nannarelli, M. Re, An killer, https://www.who.int/csr/don/2003 07
efficient hardware implementation of reinforce- 04/en (2015).
ment learning: The q-learning algorithm, IEEE [21] S. J. Olsen, H. L. Chang, T. Cheung, A. Tang,
Access 7 (2019) 186340–186351. doi:10.1109/ T. L. Fisk, S. Ooi, K. H. Hsu, at all, Transmis-
ACCESS.2019.2961174. sion of the severe acute respiratory syndrome on
[9] F. Beritelli, G. Capizzi, G. Lo Sciuto, C. Napoli, aircraft, New England Journal of Medicine 349
F. Scaglione, Rainfall estimation based on the in- (2003) 2416–2422.
tensity of the received signal in a lte/4g mobile [22] S. Pham, Sars cost global airlines $7 billion.
terminal by using a probabilistic neural network, the coronavirus outbreak will likely be much
IEEE Access 6 (2018) 30865–30873. worse, https://edition.cnn.com/2020/ 02/05/busi-
[10] F. Beritelli, G. Capizzi, G. Lo Sciuto, C. Napoli, ness/ coronavirus-airline-cost/index.html (2020).
M. Woźniak, A novel training method to preserve [23] L. F. S. Baker, The coronavirus death toll has
generalization of rbpnn classifiers applied to ecg surpassed 2,760, with more than 81,000 infected.
signals diagnosis, Neural Networks 108 (2018) here’s everything we know about the outbreak,
331–338. https://www.businessinsider.com/china-virus-
[11] M. Ciotti, S. Angeletti, M. Minieri, M. Giovan- everything-we-know-deadly-2019-ncov-wuhan-
netti, D. Benvenuto, S. Pascarella, C. Sagnelli, spread-2020-1 (2020).
M. Bianchi, S. Bernardini, M. Ciccozzi, Covid-19 [24] S. Folinas, T. Metaxas, Tourism: The great patient
outbreak: an overview, Chemotherapy 64 (2019) of coronavirus covid-2019 (2020).
215–223. [25] M. Garcia, Coronavirus could
[12] S. I. Illari, S. Russo, R. Avanzato, C. Napoli, A cost airlines $30 billion, but that’s
cloud-oriented architecture for the remote as- not the whole story for aviation,
sessmentand follow-up of hospitalized patients, https://www.forbes.com/sites/marisagarcia/2020/
in: Symposium for Young Scientists in Technol- 02/21/iata-forecasts-potential-lost-revenue-of-
ogy, Engineering and Mathematics (SYSTEM), 293-billion-from-covid-19-but-thats-not-the-
volume 2694 of CEUR Workshop Proceedings, whole-story/#2b1c8d0d1464 (2020).
2020, pp. 29–35. [26] N. Frost, Coronavirus has struck at the ab-
[13] G. Topham, Malaysia airlines ’technically solute worst time for china’s tourism sector,
bankrupt’ as new chief seeks to shed 6,000 jobs, https://qz.com/1790775/coronavirus-has-struck-
https://www.theguardian.com/business/2015/jun at-the-worst-time-for-chinese-tourism/ (2020).
/01/malaysia-airlines-technically-bankrupt- [27] J. Pearson, D. Pitfield, T. Ryley, Intangible re-
christoph-mueller-cuts-boss (2020). sources of competitive advantage: Analysis of 49
[14] G. Blalock, V. Kadiyali, D. Simon, The impact asian airlines across three business models, Jour-
of post-9/11 airport security measures on the de- nal of Air Transport Management 47 (2015) 179–
mand for air travel, The Journal of Law and Eco- 189.
nomics 50 (2007) 731–55.
[15] R. Tam, R. J. Hansman, An analysis of the dy-
namics of the us commercial air transportation
system (2003).
[16] R. Tam, R. J. Hansman, Impact of air transporta-
tion on regional economic and social connectiv-
ity in the united states (2002).
[17] M. Moodie, The first overall decline in demand
since the global financial crisis of 2008-09, IATA
projects a very tough year for airlines (2020).
34You can also read