NEW FRONTIERS - SPECIAL FOCUS: Knight Frank

 
CONTINUE READING
NEW FRONTIERS - SPECIAL FOCUS: Knight Frank
NEW
 FRONTIERS
        PROSPECTS FOR REAL ESTATE ALONG
        THE BELT AND ROAD INITIATIVE

 SPECIAL FOCUS:
  Southeast Asia Industrial & Logistics
NEW FRONTIERS - SPECIAL FOCUS: Knight Frank
CONTENTS

      NEW FRONTIERS: SUMMARY

                                            FOREWORD
                                                     2
                                                                    3          RANKING THE MARKETS

                                                    4
                                                                    BELT AND ROAD INDEX 2019

           INDUSTRIAL OVERVIEW

                                    MARKET UPDATE

                                                                    5          MAJOR RECENT SOUTHEAST ASIA
                                                                               BRI DEALS

                                                    6
                                                                    MAP
MAJOR RECENT SOUTHEAST ASIA
                  BRI DEALS

                                                                    7
                                                   TABLE

                                                                               BRIGHT INDUSTRIAL OUTLOOK

                                                     8
                                                                    PHILIPPINES
       TAPERING SUPPLY TO KEEP
               RENTS IN CHECK

                                             THAILAND

                                                                    9          ON TRACK DESPITE THE DETOUR

                                              10
                                                                    MALAYSIA
                         ON THE RISE

                                                                    11
                                            CAMBODIA

                                                                               THE BELT AND ROAD INDEX (BARI)

                                               12
                                                                    METHODOLOGY

 NEW FRONTIERS KEY CONTACTS

                                             CONTACTS

N E W FRO N TI E RS   Special Focus: Southeast Asia Industrial & Logistics                            PG. 01
NEW FRONTIERS - SPECIAL FOCUS: Knight Frank
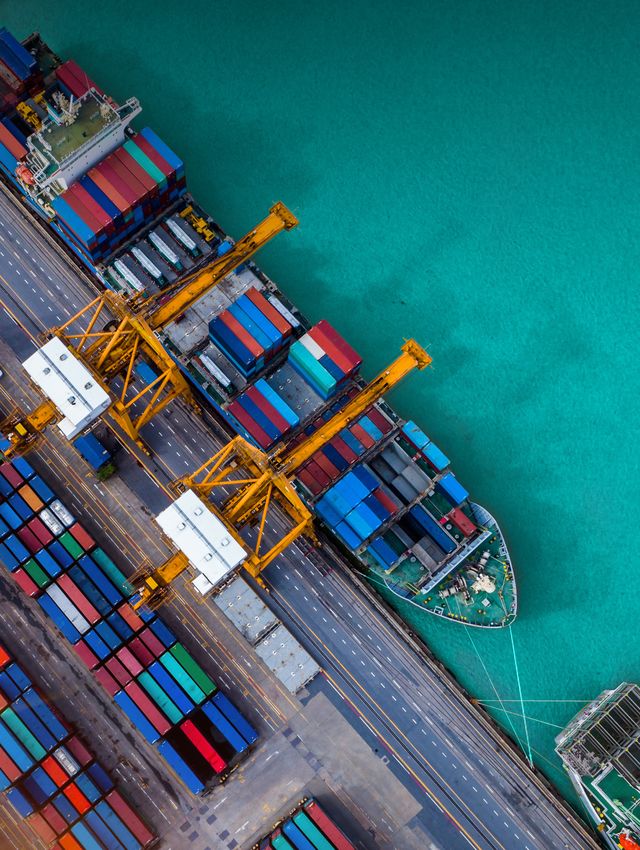
PORT KLANG, MALAYSIA

NEW FRONTIERS: SUMMARY
The Belt and Road Initiative is helping                  p ote n ti a l , d emog rap h ic ad van -                 major c oas t al r e g ion s and laying
lift Southeast Asian infrastructure                      ta g e, i n f ras t r u c t u r e d evelop men t ,        eit h er rail or exp r e s sway transport
through new ports, railroads and                         i n s ti tu ti on al ef fe c t iven e s s, mar ket        n et wor ks c on n e c t in g the se new
highways. Increased connectivity                         a c c e s s i bilit y an d r e s ilien c e t o            e c on omic h u b s t o t h e c ountr y ’s
through shipping and overland trade                      n a tu ra l dis as t ers ; f u r t h er d et ails         c ap it al. Over t h e p as t five years
routes is likely to provide opportunities                on ou r met h od olog y c an b e fou n d                  s in c e t h e BR I ’s lau n c h , US$59. 25
in the logistics, manufacturing and                      on p a g e 1 1.                                           b illion in C h in e s e - lin ke d capital
industrial markets.                                                                                                h as b e en inve s t e d across the
                                                         Foc u s i n g on t h e Sou t h eas t As ian               Sou t h eas t As ian t ransportation ,
Laun ch e d i n 2 0 13, th e B e l t a n d               c ou n tr i e s, Sin g ap or e r et ain s it s            r eal e s t at e an d log is t ic s se ctors;
Road Ini t i a t i ve ( B RI ) i s Ch i n a’s p l a t-   top p os i t ion followe d by M alays ia                  almos t 3.5 t ime s t h e US$1 7.1 billion
form fo r m u l t i l a t e ra l c oop e ra ti on        wh i c h main t ain e d it s t op t en                    inve s t e d in t h e f ive years prior to
w hi ch w i l l cre a t e new e c on om i c              s ta tu s i n 9t h . I mp r ovemen t s wer e              BR I .
lin ks an d i m prove i ts b u s i n e s s               s e e n wi th Th ailan d an d Ph ilip p in e s
ne tworks a c ro ss t he g l ob e. Of th e               wh o m ove d u p f ive an d s ix p lac e s                Th e s e in it iat ive s h ave breathe d
six e c ono m i c c o rri do rs th a t we r e            to 2 6 th an d 4 4 t h r e s p e c t ively on             n ew life in t o t h e in d ustrial and
ide ntifi e d, t hi s re po r t d e l ve s i n to        b e tte r i nf ras t r u c t u r e d evelop men t         log is t ic s      r eal    e s t at e  se ctors
t he Mar i t i m e S i l k Roa d th a t c on -           and        i n s t it u t ion al   ef fe c t iven e s s   ac r os s t h e Sou t h eas t Asian mar-
ne ct Sout he a st Asi a to I n d i a a n d              m e tr i c s, w h ile Camb od ia move d                   ket s by p r ov id in g new either
t he E uro pe M i ddl e Ea s t a n d                     u p two p lac e s on imp r ove d mar ket                  s ou r c e s of d eman d or gentrif ying
Afri can re gi o n; a nd g i ve s f u r th e r           a c c e s s i bilit y met r ic s.                         old er s t oc k . Wit h exp e ctations for
insigh ts i nt o how t he B R I h a s i n f l u -                                                                  mor e in f ras t r u c t u r e inve stments
e nc e d t he i ndu str i a l m a r ke ts                A b i g d r i ver b eh in d t h e s u c c e s s of        alon g t h e M ar it ime Silk Road, the
across So u t he a st Asia .                             th e Ma r i time Silk Road is t h e in f ra-              ou t look for t h e in d ustrial real
                                                         s tr u c tu r e n e e d e d t o “c on n e c t t h e       e s t at e s e c t or w it h in t h e Southeast
Th i s e di t i o n i nc l ude s th e u p d a te d       d ots” a c r os s a h ig h ly f rag men t e d             As ian mar ket s looks promising
Kni gh t F ra nk B e l t a nd Roa d I n d ex             a n d r u ral r e g ion . Th is in c lu d e s             over t h e n ext t h r e e t o f ive years.
(BARI) whi ch ra nks 6 6 B R I -r e l a te d             b u i l d i n g p or t s an d n e g ot iat in g
c ountri e s       by       t he ir e c on om i c        s p e c i a l e c on omic zon e s alon g

 N E W FRO N TI E RS           Special Focus: Southeast Asia Industrial & Logistics                                                                   PG. 02
NEW FRONTIERS - SPECIAL FOCUS: Knight Frank
BELT & ROAD INDEX 2019

           INDEX                                                                       COUNTRY         RANK      2018 RANK
               69.0                                                                   SINGAPORE            1           1
               58.2                                                       UNITED ARAB EMIRATES            2
               57.9                                                               NEW ZEALAND             3
               57.3                                                                           CHINA       4
               56.9                                                                           QATAR       5
               54.6                                                                       ESTONIA         6
               54.5                                                               SOUTH KOREA              7
               54.2                                                                           OMAN        8
                54.1                                                                     MALAYSIA         9           6
               53.3                                                            CZECH REPUBLIC           10
               53.2                                                                       BAHRAIN         11
               52.6                                                                            INDIA     12
               52.5                                                                       VIETNAM        13           11
               52.4                                                                          ISRAEL      14
               51.8                                                                     HUNGARY          15
               51.8                                                                        POLAND        16
                51.7                                                                     SLOVENIA        17
               50.5                                                                        BHUTAN        18
               50.4                                                                         BRUNEI       19
               50.4                                                                      SLOVAKIA       20
               49.9                                                                       GEORGIA        21
               49.6                                                                    MONGOLIA         22
               49.5                                                                     LITHUANIA       23
               49.3                                                                     MALDIVES        24
               48.7                                                                          LATVIA     25
               48.3                                                                     THAILAND        26           31
               48.0                                                                       ALBANIA       27
                47.7                                                                      CROATIA       28
                47.7                                                                   INDONESIA        29           28
               47.6                                                               MONTENEGRO            30
               46.8                                                                SAUDI ARABIA          31
               46.5                                                                      ROMANIA        32
               46.4                                                                     BULGARIA        33
                46.1                                                                           LAOS     34           30
               45.3                                                               SOUTH AFRICA          35
               44.6                                                                    CAMBODIA         36           38
               44.0                                                                         SERBIA      37
               43.3                                                                         KUWAIT      38
                43.1                                                                KAZAKHSTAN          39
                43.1                                                                       TURKEY       40
               43.0                                                                     SRI LANKA        41
               42.7                                                                      ETHIOPIA       42
               42.7                                                                        JORDAN       43
               42.4                                                                  PHILIPPINES        44           50
               42.0                                                                     MYANMAR         45           43
               41.2                                                                BANGLADESH           46
               40.4                                                                      MOLDOVA        47
               40.3                                                                       ARMENIA       48
               39.9                                                    BOSNIA AND HERZEGOVINA           49
               39.5                                                                           EGYPT     50
               39.2                                                              TURKMENISTAN            51
               38.5                                                                         RUSSIA      52
               37.8                                                                 KYRGYZSTAN          53
               37.6                                                                  AZERBAIJAN         54
                37.1                                                                     LEBANON        55
               35.9                                                                      PAKISTAN       56
               35.7                                                                      BELARUS        57
               35.6                                                                           NEPAL     58
               35.5                                                                       UKRAINE       59
               35.0                                                                  UZBEKISTAN         60
               34.3                                                                   TAJIKISTAN         61
               33.7                                                                             IRAN    62
               30.7                                                                 TIMOR-LESTE         63
               27.4                                                                          YEMEN      64
               26.5                                                                             IRAQ    65
                26.0                                                               AFGHANISTAN          66
                       0       10       20   30   40     50      60     70        80

                                                                                                               SOUTHEAST ASIA
        Source: Knight Frank Research

N E W FRO N TI E RS        Special Focus: Southeast Asia Industrial & Logistics                                                 PG. 03
NEW FRONTIERS - SPECIAL FOCUS: Knight Frank
SOUTHEAST ASIA
INDUSTRIAL & LOGISTICS OVERVIEW

        Established in 1967, the Association of Southeast                                      therefore presents an attractive opportunity for the
        Asian Nations (ASEAN) is an intergovernmental                                          Southeast Asian countries as both sides share
        organisation formed by ten Southeast Asian                                             common goals. Notable examples in recent years
        nations to facilitate economic, political and securi-                                  have been the US$2.1 billion highway in Cambodia
        ty cooperation among its member states. These                                          that will cut the five-hour travel time between capi-
        ten countries have a total population 661 million,                                     tal Phnom Penh and Sihanoukville Port by 50%,
        which accounts for 8.6% of the world’s population,                                     and the US$2.7 billion high-speed rail project in
        and a total 2017 GDP of US$2.76 trillion or 3.4% of                                    Bangkok that will form part of the rail link between
        the world’s GDP. In comparison, the European                                           China’s Kunming and Singapore.
        Union with its 513 million population or 6.7% of the
        world’s population has a combined 2017 GDP of                                          With all this new infrastructure being built, investor
        US$17.3 trillion or 21.4% of the world’s GDP. While                                    interest in the industrial sector has increased in
        there are several key differences between these                                        recent years, especially from cross-border inves-
        two similar-sized regions, the extensive and                                           tors. Between 2009 and 2015, cross border invest-
        efficient transport infrastructure connections in the                                  ments into the Southeast Asian industrial sector hit
        European Union stands in stark contrast to South-                                      a high of US$330 million, while the market share of
        east Asia, where a lack of infrastructure remains a                                    total industrial investments within the region
        major hurdle to economic expansion.                                                    capped out at 22%. However, from 2016 onwards
                                                                                               when several large infrastructure agreements were
        The authorities within Southeast Asia have recog-                                      signed under the BRI banner, interest from
        nised this and have themselves embarked on bold                                        cross-border investors saw a significant increase,
        infrastructure plans, for example Thailand’s                                           hitting a peak of US$1.4 billion with a 72% market
        Eastern Economic Corridor and Philippines’                                             share (of total industrial investments) in 2017. In
        “Build, build, build” policy. However, many lack the                                   brief, the weight of capital interest has benefitted
        necessary fiscal strength given the large upfront                                      the Southeast Asian industrial markets, which we
        capital commitments required and the difficulty in                                     detail in this report, by driving rapid development,
        attracting private enterprises given the long dated                                    the gentrification of aging stock and rental growth
        return prospects. China’s Belt and Road initiative                                     in most markets across the region.

                      A S I A PAC I F I C                                                SOUTHEAST ASIA INDUSTRIAL
                   WA R E H O U S E R E N TS                                             CROSS BORDER INVESTMENTS

     SINGAPORE
                                                                                       1,600                                                            90%

                                                                                       1,400                                                            80%
           TOKYO

                                                                                                                                                        70%
                                                                                       1,200
    PHILIPPINES
                                                                                                                                                        60%
                                                                                       1,000
                                                                        USD Millions

      SHANGHAI                                                                                                                                          50%
                                                                                        800
                                                                                                                                                        40%
       THAILAND                                                                         600
                                                                                                                                                        30%

                                                                                        400
       MALAYSIA                                                                                                                                         20%

                                                                                        200                                                             10%
     CAMBODIA*
                                                                                          0                                                             0%
                       0           50          100          150   200                          2009 2010 2011 2012 2013 2014 2015 2016 2017 2018 2019

                                         USD psm pa
                                                                                       CROSS - BORDER VOLUME (US$mn)               CROSS - BORDER SHARE (%)

 Source: Knight Frank Research and Real Capital Analytics
 As of Q4 2018
 *Factory Land Leases

N E W FRO N TI E RS            Special Focus: Southeast Asia Industrial & Logistics                                                                       PG. 04
NEW FRONTIERS - SPECIAL FOCUS: Knight Frank
MAJOR RECENT SOUTHEAST ASIAN BRI DEALS

                                                     LAOS

                             THAILAND

                                                   CAMBODIA                               PHILIPPINES
        TO INDIA,
         AFRICA
       AND EUROPE

                                                               M A L A Y S I A

                                                       SINGAPORE

                                                                      I N D O N E S I A

         HIGHWAY

         DEEP SEA PORT

         HIGH SPEED RAIL

         ROAD & TUNNEL PROJECT

         LAND RECLAMATION & PORT BUILDING

Source: Knight Frank Research and The American Enterprise Institute

N E W FRO N TI E RS              Special Focus: Southeast Asia Industrial & Logistics                   PG. 05
MAJOR RECENT SOUTHEAST ASIAN BRI DEALS

   COUNTRY       SUB-REGION      DATE       TYPE              HOW MUCH     SUMMARY                     OPPORTUNITY

                                                                                                       The railway is expected to spur new
                                                                           Part of the Kunming-        developments including industrial parks and
   LAOS          VIENTIANE       2016 Sep   Railway           US$4.15 bn   Singapore railway
                                                                                                       hotels for increased tourism. Travel time
                                                                                                       between kunming and vientiane is cut from 3
                                                                                                       days to 3 hours.

                                                                           First highway in Laos       The new expressway will spur new
                                                                           linking capital Vientiane   developments such as industrial parks for
   LAOS          VIENTIANE       2018 Apr   Highway           US$1.2 bn
                                                                           to Boten, bordering         Chinese manufacturers looking outside of
                                                                           China.                      China.

                                                                           New four lane highway       Part of the government's long-term industrial
                                                                           linking capital Phnom       development plan. Sihanoukville will progress
   CAMBODIA      PHNOM PENH      2018 Jan   Highway           US$2.1 bn                                to be the largest industrial hub in Cambodia;
                                                                           Penh to Sihanoukville
                                                                           port town.                  will bode well for its real estate market.

                                                                                                       Railway will cut the current 12-hour car travel
                                                                                                       time down to six hours. Increase flow of
   PHILIPPINES   MANILA          2018 Nov   Railway           US$270 mn    Manila to Bicol             shipments from the region which will stimulate
                                                                           railway                     industrial real estate, while increased tourism
                                                                                                       should benefit the hotel sector.

                                                                                                       Boost the attractiveness of Davao as a
                                                                           New land used for           industrial and shipping hub for the Philippines
                                            Land
   PHILIPPINES   DAVAO           2016 Oct   Reclamation       US$200 mn    new port and real           which will attract both domestic and foreign
                                                                           estate                      MNCs to setup operations; a boon for the
                                                                                                       overall real estate market.

                                                                                                       High speed rail to connect to a new interna-
                                                                           Part of the Kunming-        tional airport in the Rayong port region. Expect
   THAILAND      BANGKOK         2017 Dec   High Speed Rail   US$2.7 bn                                industrial and residential real estate sectors to
                                                                           Singapore railway
                                                                                                       benefit.

                                                                           Undersea tunnel to          New mainland link will benefit the real estate
                                            Road And                                                   markets in Georgetown and Butterworth
   MALAYSIA      PENANG          2014 Mar   Tunnel            US$1.3 bn    link Penang Island to
                                                                           mainland                    where tunnel entrances are located.
                                            Project

                                                                                                       Increased trading activities from the new port
                                                                           Part of Melaka              will stimulate warehousing and logistics
   MALAYSIA      MELAKA          2016 Oct   Deep Sea Port     US$1.9 bn
                                                                           Gateway project.            facilities demand.

                 KUALA                                                                                 Improved economic opportunities to east
                 LUMPUR TO                                                 Part of the East Coast      coast states and likely to benefit overall real
   MALAYSIA                      2016 Nov   Railway           US$2.1 bn
                 KELANTAN                                                  Rail Link project.          estate sector.

                                                                                                       Highspeed rail linking Indonesia's two major
                                                                                                       cities. Cuts travel time between Jakarta and
                                                                           Highspeed rail linking      Bandung, second largest city, from five hours
                 JAKARTA                                      US$3.2 bn                                to forty-five minutes. Main sectors to benefit
   INDONESIA                     2017 Apr   High Speed Rail                Indonesia's two major
                 TO BANDUNG                                                                            are residential from decentralizing demand
                                                                           cities.
                                                                                                       and hotels from increased tourism - logisitics
                                                                                                       markets along the corridor also likely to be
                                                                                                       enhanced.

NE W F R O N TI E RS     Special Focus: Southeast Asia Industrial & Logistics                                                                    PG. 06
PHILIPPINES
                                                   BRIGHT INDUSTRIAL OUTLO OK
                                                   2019 BARI RANK: 44 / 2018 BARI RANK: 50

 Since the change of administration in                             be revised despite the government’s               Furthermore, major e-commerce
 2016, we have seen a reversal of the                              plan to liberalise certain portions of            players have also started to enter the
 previous stance and a pivot towards                               the economy back in 2017.                         market as shown by Alibaba’s Lazada
 China; paving the way for a slew of                                                                                 setting up its largest Southeast Asia
 Chinese-funded infrastructure projects                            Nonetheless, with the rapid infra-                warehouse in Cabuyao in late 2017
 and investments into the Philippines.                             structure push, developers are once               and has plans for another five facili-
 Coincidentally, this is also in line with                         again warming up to the industrial                ties over the coming three to five
 the current administration’s push                                 sector. Initially, developers have been           years. Going forward, with the govern-
 towards greater infrastructure spending                           forced outside of Manila due to the               ment forecasting the economy to
 to boost economic growth. However,                                scarcity of land and cheaper alterna-             expand between 6.5 to 6.9% in 2019
 things have been slow to get off the                              tives. However, due to recent                     mainly via the strong and consistent
 ground with only US$6.7 billion of Belt                           increased fuel prices, demand for                 delivery of its infrastructure invest-
 and Road Initiative related investments                           industrial lots and warehouses have               ment agenda, the outlook for the
 completed since the change in govern-                             been recently redirected towards                  industrial sector does look bright and
 ment, out of the roughly US$25 to 30                              area closer to Manila. This favourable            expectations are for 2019 to at least
 billion in pledges secured. One key                               supply dynamic was the driver behind              maintain the growth momentum from
 reason for this stem from the foreign                             rental growth for industrial rents                last year.
 ownership limit rules in the Philippines                          across most of the country.
 on certain key sectors which has yet to

                                     10 YEAR CHINESE INVESTMENTS INTO PHILIPPINES

                                   4,000
                                   3,500
                                   3,000
                    USD Millions

                                   2,500
                                   2,000
                                   1,500
                                   1,000
                                    500
                                      0
                                              2008        2009       2010         2012        2013         2014     2016       2017       2018

                                   ENERGY            REAL ESTATE      TRANSPORT             OTHERS (E.G. ENTERTAINMENT, TECH, TOURISM, UTILITIES)

Source: The American Enterprise Institute

                            2018: 152
                            YOY(%): 21.6% VALENZUELA
                                                                            QUEZON CITY        2018: 255
                                                                                               YOY(%): -2%

                                    2018: 457
                                    YOY(%): 9.5%     MANDALUYONG
                                                                                            2018: 225
                                                                                   PASIG    YOY(%): 25%

                                               2018: 589
                                               YOY(%): 1.8% MAKATI

                                                                                           2018: 300
                                                                                 TAGUIG    YOY(%): 76.5%

                                           2018: 438
WAREHOUSE RENT                             YOY(%): 157.6% PARANAQUE
Q4 2018 (PHP/sqm/mo)
                                                                     LAS PINAS    2018: 157
Source: Knight Frank Research                                                     YOY(%): 28.7%

 N E W FRO N TI E RS                       Special Focus: Southeast Asia Industrial & Logistics                                                     PG. 07
THAILAND
                                                               T A P E R I N G S U P P LY T O K E E P R E N T S I N C H E C K
                                                               2019 BARI RANK: 26 / 2018 BARI RANK: 31

 Unveiled back in 2018, Thailand 4.0 is                                            of higher international freight demand               sqm of new space in 2018 and bring-
 an ambitious plan by the government                                               and the expansion of U-Tapao airport                 ing the total market supply to
 to revamp the country’s economy via                                               near Thailand’s coast, set to become                 5,177,000 sqm, a 6.2% year-on-year
 the development of a special                                                      the country’s third main international               increase. Sector occupancy stood at
 economic zone dubbed the Eastern                                                  airport and anchor a Special Econom-                 83% at the end of 2018, a 1.4% rise
 Economic Corridor (EEC) which com-                                                ic Zone.                                             from the year before, driven by stock
 prises industrial estates and tourist                                                                                                  withdrawals while demand remained
 destinations. The EEC and its projects                                            Along with the capital, Chinese com-                 stable. With occupiers having more
 will be integrated with China’s Belt                                              panies have also started taking more                 supply options last year, rents fell
 and Road Initiative through an                                                    interest in Thailand. One example is                 1.6%     year-on-year   to    Thb151.3
 873-kilometer Thai-China high-speed                                               Cainiao, one of China’s leading smart                (US$4.75) psm per month. Going
 railway that will connect Thailand to                                             logistics network players, who has                   forward, while the excess supply
 Kunming, China via Laos. Currently,                                               committed US$330 million to devel-                   situation is expected to persist over
 the initial 250 kilometers are under                                              op a digital hub within the EEC that it              the near term, developers conscious
 construction with an estimated cost                                               plans to further optimize the                        of market conditions will likely adjust
 of US$5.6 billion, running between                                                cross-border flow of goods for                       their supply deliveries. As a result,
 Bangkok and Nakhon Ratchasima.                                                    Thailand and its neighbors.                          warehouse rental prices are expected
 Separately, other major EEC projects                                                                                                   to remain range between Thb150 to
 include the US$4.9 billion expansion                                              Developers have been active in the                   155 (US$4.71 to 4.86).
 of Laem Chabang Port in anticipation                                              warehouse sector, adding 302,000

                                                                                                                                                                      5,500,000
                                                               170
  BANGKOK
                                                               165                                                                                                    5,000,000
  SUVARNABHUMI
  - BANGPAKONG                                                 160
                                     Baht per sq.m per month

                                                                                                                                                                      4,500,000
                                                               155
  EASTERN
  SEABOARD                                                     150                                                                                                    4,000,000

                                                               145
  PATHUMTHANI                                                                                                                                                         3,500,000
  - AYUTTHAYA                                                  140

                                                               135                                                                                                    3,000,000
  SUPPLY
                                                               130
                                                                                                                                                                      2,500,000
  OCCUPIED SPACE                                               125

                                                               120                                                                                                    2,000,000 sqm
 Source: Knight Frank Research                                        H2 2014      H1 2015   H2 2015    H1 2016     H2 2016   H1 2017   H2 2017   H1 2018   H2 2018

H2 2018: 144
YoY(%): -4%                 PATHUMTHANI
SUPPLY (sqm): 3,628,409     - AYUTTHAYA
VACANCY: 2%

                     H2 2018: 166                                                               SUVARNABHUMI
                     YoY(%): -4%                                                                - BANGPAKONG
                     SUPPLY (sqm): 5,004,408                         BANGKOK
                     VACANCY: 0%
                                                                                                 H2 2018: 159
                                                                                                 YoY(%): -1%
                                                                                                 SUPPLY (sqm): 4,825,348
                                                                                                 VACANCY: 6%

                                                               H2 2018: 150
                                                               YoY(%): -2%
                                                               SUPPLY (sqm): 4,974,707   EASTERN
                                                               VACANCY: 9%               SEABOARD
WAREHOUSE RENT
Q4 2018 (THB/sqm/mo)

Source: Knight Frank Research

 N E W FRO N TI E RS             Special Focus: Southeast Asia Industrial & Logistics                                                                                    PG. 08
M A L AY S I A
                                            ON TRACK DESPITE THE DETOUR
                                            2019 BARI RANK: 9 / 2018 BARI RANK: 6

Over the past 10 years, Malaysia has                              these large foreign direct invest-               which would support and spur further
been a major beneficiary of Chinese                               ments. Nonetheless, this has not                 shipping and logistics activity at Port
capital with investments totaling                                 deterred Chinese manufacturing FDI               Klang, Malaysia’s main port.
US$43.8 billion, the highest amount                               which rose 410.8% year-on-year to
recorded among its ASEAN peers. A                                 RM15.8 billion in 2018.                          As these initiatives materialise, the
major driver behind this has been the                                                                              industrial sector is expected to
relatively open stance the previous                               Besides just relying on Chinese capi-            receive a much-needed boost espe-
government took on China, and one                                 tal to drive growth, the new govern-             cially given the ageing stock; redevel-
which is expected to continue under                               ment has also set in place key initia-           opments into sizeable warehouses
the new administration. The Prime                                 tives that will have direct benefits on          with higher specifications has been
Minister has emphasized his intention                             the industrial sector. One major initia-         gaining momentum recently as oper-
to develop deeper ties with China,                                tive is the emphasis on improving the            ators seek to get ahead of the curve.
and this was evident when Beijing                                 country’s capabilities in the Halal              Current market rents for warehouses
was one of the first overseas coun-                               industry, a global industry worth                within the major industrial zones near
tries visited in an official capacity                             US$2.1 trillion in 2017, and capitalising        Port Klang in Selangor and in Negeri
since returning to power. Further-                                on Malaysia’s top rated global Islamic           Sembilan range from RM0.80 to 2.00
more, while the new government has                                economic        ecosystem      spanning          (US$0.2 to 0.5) per square foot per
taken precautions by relooking at the                             finance to manufacturing standards               month; while in Johor and Penang
feasibilities of all the MOUs signed                              and halal certifications. Another major          they command monthly rental rates of
under the previous leadership, it                                 initiative announced recently at                 RM0.80 to RM2.50 (US$0.2 to 0.6)
would not derail but most likely delay                            Budget 2019 was the plan to set up a             per square foot.
the inevitable given the benefits of                              new Free Trade Area in Pulau Indah

                                C H I N E S E I N V E S T M E N T S ( A L L S E C TO R S ) PA S T 1 0 Y R S
            MALAYSIA
           INDONESIA
          SINGAPORE
                 LAOS
             VIETNAM
           CAMBODIA
          PHILIPPINES
            THAILAND
            MYANMAR
               BRUNEI

                            0           5            10           15       20             25      30          35    40      45        50 US$ BILLIONS

 Source: Knight Frank Research and The American Enterprise Institute

                                                                                JOHOR:
                                                                           SENAI - KULAI

                                                                            1.00 – 1.50
                     SELANGOR:
                     SHAH ALAM
                      1.50 – 2.00
 SELANGOR:
   KLANG
    0.80 – 1.20                              NEGERI
                                            SEMBILAN
                                                                                               JOHOR:
                                              0.80 – 1.20                                      PASIR GUDANG

                                                                                                0.80 – 1.20

DETACHED FACTORY RENTS
Q4 2018 (RM/sqft/mo)
Source: Knight Frank Research

 N E W FRO N TI E RS              Special Focus: Southeast Asia Industrial & Logistics                                                            PG. 09
CAMBODIA
                                           ON THE RISE
                                           2019 BARI RANK: 36 / 2018 BARI RANK: 38

For many decades, China has devel-                                in the 5 years post-BRI, an increase          Chinese account for circa. 80% of all
oped strong ties with Cambodia,                                   from the 12% share they had prior to          companies operating within Sihan-
seeing the emerging nation within the                             the BRI.                                      oukville’s special economic zones
Indo-China region for its strategic                                                                             (SEZ) followed by the Americans and
position within South-East Asia. This                             Recent notable investments include a          Europeans at 16%. The improved
was evident in 2018 as Chinese                                    US$2.08 billion highway project by            sentiment has positively impacted
entities invested US$3.83 billion into                            China Communications Construction             factory land leases with average long
Cambodian real estate and highway                                 who will build and operate a 190-kilo-        term (30 to 50 years) leases rising 3%
projects, one of the highest amounts                              meter four lane highway connecting            YoY to US$32.5 per sq m in 1H 2018.
within Southeast Asia.                                            Phnom Penh to Sihanoukville - home
                                                                  to Cambodia’s special economic                Underpinned by improving infrastruc-
Prior to 2013’s Belt and Road Initiative                          zones, deep sea port and the coun-            ture, the industrial sector for Sihan-
(BRI), investments from China had                                 try’s main gateway for exports and            oukville (a proxy for Cambodia’s over-
focused mainly on energy projects                                 imports.                                      all market) is expected to do well over
such as hydroelectric dams across                                                                               the medium to long term. Further-
the country. However, post-BRI, this                              The drive to improve infrastructure           more, the sector is expected to be
focus has shifted towards transport                               connecting the capital and economic           buoyed by the commencement of oil
infrastructure    and    real   estate                            hub has made Sihanoukville an                 extraction in late 2019 which will drive
construction. These two sectors                                   increasingly attractive destination for       further demand across the industrial
accounted for a 73% share of all                                  foreign direct investments (FDI) and          and manufacturing sectors.
Chinese investments into Cambodia                                 corporate occupiers; c u r r en t ly t h e

                  4,500    AGRICULTURE              10 YEAR CHINESE INVESTMENTS INTO CAMBODIA
                           ENERGY
                  4,000
                           ENTERTAINMENT
                  3,500    FINANCE
                           METALS
                  3,000    REAL ESTATE
   USD Millions

                           TECHNOLOGY
                  2,500    TRANSPORT
                  2,000

                  1,500

                  1,000

                   500

                     0
                          2006       2008           2009           2010       2011       2012       2013       2015      2016      2017      2018

 Source: Knight Frank Research and The American Enterprise Institute

            NEW ROAD
            OLD ROAD

                                              30 - 35

LONG TERM (30-50 YEARS)
FACTORY LAND LEASES
1H 2018 (USD/psm)
Source: Knight Frank Research

 N E W FRO N TI E RS              Special Focus: Southeast Asia Industrial & Logistics                                                       PG. 10
METHODOLOGY

    T H E B E LT A N D R O A D I N D E X ( B A R I )
                                               UNIT                                WEIGH       YEAR                    SOURCE

    ECONOMIC POTENTIAL                                                              25%

    GDP PER CAPITA PP                          US$                                             2018                    INTERNATIONAL MONETARY FUND
    FUTURE GDP GROWTH RATE                     %                                               AVERAGE 2019-2023       INTERNATIONAL MONETARY FUND
    GDP GROWTH RATE                            %                                               AVERAGE 2014-2018       INTERNATIONAL MONETARY FUND
    INSTITUTIONAL EFFECTIVENESS                                                     25%

    GOVERNMENT EFFECTIVENESS                   PERCENTILE RANK (0 - 100)                       2017                    WORLD BANK
    REGULATORY QUALITY                         PERCENTILE RANK (0 - 100)                       2017                    WORLD BANK
    VOICE AND ACCOUNTABILITY                   PERCENTILE RANK (0 - 100)                       2017                    WORLD BANK
    POLITICAL STABILITY AND ABSENCE                                                            2017                    WORLD BANK
    OF VIOLENCE/TERRORISM                      PERCENTILE RANK (0 - 100)

    RULE OF LAW                                PERCENTILE RANK (0 - 100)                       2017                    WORLD BANK

    CORRUPTION PERCEPTIONS INDEX               SCALE (0 - 100)                                 2018                    TRANSPARENCY INTERNATIONAL

    DEMOGRAPHIC ADVANTAGE                                                           20%

    URBANISATION RATE                          %                                               2015-2020               UNITED NATIONS

    POPULATION GROWTH                          %                                               2015-2020               UNITED NATIONS

    DEPENDENCY RATIO                           RATIO                                           2015-2020               UNITED NATIONS

    INFRASTRUCTURE DEVELOPMENT                                                      15%

    QUALITY OF PORT INFRASTRUCTURE             SCORING (1-7)                                   2018 OR LATEST          WORLD BANK

    LOGISTICS PERFORMANCE INDEX                AGGREGATE INDICATORS (1-5)                      2018 OR LATEST          WORLD BANK

    ROAD DENSITY                               KM OF ROAD PER 100 SQ. KM OF LAND AREA          2018 OR LATEST          WORLD BANK

    LINER SHIPPING CONNECTIVITY INDEX I        INDEX (MAXIMUM VALUE IN 2004=100)               2018 OR LATEST          WORLD BANK

    INTERNET SUBSCRIPTIONS                     % OF POPULATION                                 2018 OR LATEST          WORLD BANK

    FIXED BROADBAND SUBSCRIPTIONS              PER 100 PEOPLE                                  2018 OR LATEST          WORLD BANK

    MOBILE CELLULAR SUBSCRIPTIONS              PER 100 PEOPLE                                  2018 OR LATEST          WORLD BANK

    MARKET ACCESSIBILITY                                                            10%

    FOREIGN DIRECT INVESTMENT (% OF GDP)       %                                               AVERAGE 2008-2017       WORLD BANK

    FOREIGN DIRECT INVESTMENT
    INWARD FLOWS AND STOCK                     US$                                             AVERAGE 2008-2017       UNITED NATIONS

    RESILIENCE TO NATURAL DISASTERS                                                 5%

    WORLD RISK INDEX                           AGGREGATE INDICATORS                            2018                    UNITED NATIONS

    CLIMATE RISK INDEX 2018                    AGGREGATE INDICATORS                            AVERAGE 1998-2018       GERMANWATCH

Th e Kni ght F ra nk B el t a n d Roa d I n d ex (B A R I ) h as b e en d evelop e d u s in g r eliab le an d in t er n at ion ally- re c ognize d
data sourc e s. The i n d ex i s c l a s s i f i e d i n to s i x c at e g or ie s : e c on omic p ot en t ial, d emog rap h ic ad vantage, infra-
structure deve l o pm e n t, i n s ti tu ti on a l e f fe c ti ve n e s s, mar ket ac c e s s ib ilit y an d r e s ilien c e t o n at u ral d is asters. The
value s w i t hi n e a ch c a te g or y h ave b e e n n or m a l i ze d t o en s u r e t h e r e s u lt in g f ig u r e s ar e c omp arab le an d c ontextu-
al i ze d fo r t hi s st u dy. A l l c a te g or i e s a r e a s s i g ne d w it h s p e c if ic weig h t in g s in ac c or d an c e w it h t h eir potential
sign i fi c a nc e t o i nve s tm e n t d e c i s i on s. ‘ Re a l E s t at e Pr os p e c t s’ in eac h mar ket w r it e - u p r efers t o the market
outl ook fo r e a ch re a l e s ta te s e c tor i n th e m e d i u m t er m g iven t h e p r evailin g d eman d /s u p p ly d y n amic s and current
posi tion i n t he pro pe r ty m a r ke t c yc l e.

N E W FRO N TI E RS        Special Focus: Southeast Asia Industrial & Logistics                                                                 PG. 11
KEY CONTACTS

          ASIA-PACIFIC                                                                    SOUTHEAST ASIA
          Kevin Coppel                                                                    CAMBODIA
          +65 6429 3588                                                                   Ross Wheble
          kevin.coppel@asia.knightfrank.com                                               +855 23 966 878
                                                                                          ross.wheble@kh.knightfrank.com
          RESEARCH
          Nicholas Holt                                                                   INDONESIA
          Head of Research                                                                Willson Kalip
          +86 10 6113 8030                                                                +62 21 570 7170 (100)
          nicholas.holt@asia.knightfrank.com                                              willson.kalip@id.knightfrank.com

          Justin Eng                                                                      MALAYSIA
          Senior Manager Research                                                         Sarkunan Subramaniam
          +65 6429 3583                                                                   +603 228 99 688
          justin.eng@asia.knightfrank.com                                                 sarky.s@my.knightfrank.com

          CORPORATE SERVICES                                                              PHILIPPINES
          Tim Armstrong                                                                   Rick Santos
          Head of Occupier Business Development                                           +632 752 2580
          +65 6429 3531                                                                   rick.santos@santos.knightfrank.ph
          tim.armstrong@asia.knightfrank.com
                                                                                          SINGAPORE
          Josephine Lee                                                                   Wendy Tang
          Director, Regional Business Development                                         +65 6228 6818
          +65 6429 3599                                                                   wendy.tang@sg.knightfrank.com
          josephine.lee@asia.knightfrank.com
                                                                                          THAILAND
          CHINA                                                                           Phanom Kanjanathiemthao
          Alan Liu                                                                        +66 2 643 8223
          +86 21 6032 1700                                                                phanom.kanjanathiemthao@th.knightfrank.com
          alan.liu@cn.knightfrank.com

          © Knig ht F ra nk 2019 - Thi s r epor t i s p ubl i she d for ge ne ral inform ation only and not to be re lie d upon in any way. Althou g h
          hig h sta nd a r d s have b e en use d i n t he p r ep a ra t ion of the inform ation , analys is, views and proje ctions pre s e nte d in th is
          r e p o r t, no r e s ponsi b i l i t y or l i a b i l i t y wha t so ever c an be ac c e pte d by Knight Frank for any los s or dam age re s ultant fro m
          a ny u s e o f, r e li a nc e o n o r r efer enc e t o t he c ont e nts of this docum e nt. As a ge ne ral re port, this m ate rial doe s not ne c e s -
          s a r ily r e p r e sent t he v i ew o f Kni ght Fra nk i n r el ation to particular prope rtie s or proje cts. Re production of this re port in
          w ho le o r in pa r t i s not a l l owe d wi t hout p r i or writte n approval of Knight Frank to the form and c onte nt within which it
          a p p e a rs.

N E W FRO N TI E RS       Special Focus: Southeast Asia Industrial & Logistics                                                                                         PG. 12
You can also read