Improving Fuel Efficiency and Reducing Carbon Emissions from Buses in India
←
→
Page content transcription
If your browser does not render page correctly, please read the page content below
Improving Fuel Efficiency and Reducing
 Carbon Emissions from Buses in India
                                 Sudhir Gota
            Parthaa Bosu and Sameera Kumar Anthapur, Clean Air Asia

                                         Abstract

There is a growing public transport crisis in India, with a tremendous increase in the num-
ber of private vehicles. Many public bus corporations are operating with net financial losses
and rely on government subsidies to keep operations going; therefore, investment in new
buses and technology upgrades is rare. Of the various expenditures that bus corporations
incur, fuel costs account for 30 percent. There is a strong need to improve fuel efficiency of
buses to not only improve the financial viability of the bus companies but also to reduce
their environmental and related health impacts. This study analyzes data on more than
500 buses from 3 leading bus corporations in India and identifies measures that can be
implemented to improve fuel efficiency and reduce emissions.

Introduction: Status of Bus Transport in India
In Asia, growing income and increasing investments in the transport sector, especially in
infrastructure, are translating into exploding growth in both urban and intercity trans-
port activities, with rapid increases in motorization levels. In India, vehicle registrations
increased from 1.8 million in the early 1970s to more than 100 million in 2008 (Ministry
of Road Transport and Highways 2008). Two-wheelers and cars constitute more than 85
percent of registered vehicles. In 2008, buses represented only 1.3 percent of registered
vehicles, a substantial drop from 11 percent in 1960s (Ministry of Urban Development
2008).The Ministry of Urban Development (MOUD) report (2008) compared the public
transport trips for six different city types based on population and found a decrease in all
of them, ranging from 20–72 percent.
The majority of the Indian bus fleet is held by private bus operators, who are not formally
organized. The organized sector of the bus industry—the State Road Transport Under-
takings (SRTUs)—is supported by the government under the Road Transport Corpora-
tion (RTC) Act of 1950 and accounts for only 8 percent of the national bus fleet based on
vehicle registrations. Data for bus transport exist only for this 8 percent of the bus fleet.
In 2010, the SRTUs carried 70 million passengers per day, generating about 501 billion
passenger kilometers (pkm) annually, and approximately 95 percent of these passenger
kilometers represent intercity travel. (Report of the Sub Group on State Road Transport
Undertakings).

                                          Journal of Public Transportation, Vol. 17, No. 3, 2014   39
Improving Fuel Efficiency and Reducing Carbon Emissions from Buses in India
In 2006, the Indian Government formulated the National Urban Transport Policy (NUTP)
with a view to provide better transport facilities. The policy was supported by the launch
of Jawaharlal Nehru National Urban Renewal Mission (JNNURM), which facilitated the
funding for urban services, including transport. Recognizing that organized bus trans-
port services were available in only 24 Indian cities in 2007 (Singh 2010), increasing the
number and quality of buses was taken up as a priority. To further this objective, as part
of a stimulus package in 2009, the Government of India provided financial incentives for
bus purchases by municipal governments that implemented a set of prescribed reforms.
The target was the procurement at least 15,000 new buses nationwide. According to
the financing mechanism, cities with populations over 4 million (per Census 2001) were
eligible for Central Government assistance equivalent to 35 percent of the total project
costs. For cities with populations between 1 and 4 million, assistance was available for 50
percent, and for cities with less than 1 million, the share was 80 percent. This stimulus
scheme resulted in visible increases in bus numbers in many cities between 2009 and 2011,
but most of the public transport agencies are still in financial loss. In 2009–2010, only five
state transport corporations had net annual profits, and the total combined losses of the
34 reporting SRTUs were more than 50.8 billion INR (Indian Rupee) or US $1.01 billion
(CIRT 2010). This issue is discussed in subsequent sections.
Bus Carbon Emissions and Fuel Costs
It is estimated that 20 percent of India’s CO2 emissions from the transportation sector are
from buses (Clean Air Asia 2012). Further, it has been estimated that if the current trip
mode share of public transport is retained, CO2 emissions will increase two- or three-fold
between 2008 and 2025 due to a rapid growth in urban population and an increase in the
number of trips (Fabian and Gota 2009).
Buses accounted for 12 percent of the total diesel consumption in India in 2008–2009
(Government of India 2010) and were a significant contributor to urban air pollution
(Clean Air Asia 2012, CPCB 2011, Fabian and Gota 2009). Fuel cost is about 30 percent
of the total expenses for Indian bus companies (ownership, management, maintenance,
employees, etc). Over the past decade, the fuel cost per kilometer of bus travel has
increased from INR 3.64 in 2000 to INR 7.24 in 2009 (CIRT 2010, 7) in spite of slight
improvements in fuel efficiency of the buses (CIRT 2010). With the partial deregulation
of diesel prices in 2013, the expenditure on fuel and, therefore, per-kilometer cost will
tend to increase further, assuming the fuel efficiency remains the same or continues to
reduce. Improvements in fuel efficiency can improve a bus company’s financial viability
and reduce environmental and related health impacts associated with bus transport.
Objective
The objective of this research was to investigate the potential for improving fuel efficiency
and reducing CO2 emissions of Indian bus fleets.
Methodology
The focus of this research was an understanding of bus operation and management prac-
tices by collecting and analyzing operational data to determine improvement measures.
Journal of Public Transportation, Vol. 17, No. 3, 2014 40Improving Fuel Efficiency and Reducing Carbon Emissions from Buses in India
The bus corporations chosen were of both intercity and urban operations and consisted
of different types of buses in emission standards, manufacturer types, models, etc. All
three bus corporations—Bangalore Metropolitan Transport Corporation (BMTC), Kar-
nataka State Road Transport Corporation (KSRTC), and State Express Transport Corpo-
ration (SETC)—are recognized as top performers in the country in the areas of finance,
application of best practices, adoption of new technology, high efficiency, and patronage.
Therefore, insights from these organizations should ideally set a benchmark for the rest
of the industry. A questionnaire based on the 2011 Energy Sector Management Assis-
tance Program (ESMAP) study was developed to capture management insights and was
incorporated into the toolkit as an intervention measure. The responses were captured
in one-on-one meetings with top management. A multi-stakeholder approach was then
adopted for consultations with key bus industry, public transport agencies, government
officials, research institutions, and non-government organizations to discuss the data and
develop the recommendations.
Insights from Data Analysis
Detailed operational and maintenance data from more than 500 buses was collected.
Data from a period of one year was collected for each of the buses. The analysis was con-
ducted by grouping bus data by depot, as each depot had the same bus manufacturer,
and then grouping data by the emission standards the buses were designed to meet.
TABLE 1. Parameter
Data Collected from 1 Bus registration number
Bus Operators
2 Year of manufacture
3 Fuel type
4 Manufacturer (company)
5 Bus type (low floor, standard)
6 AC or non-AC
7 Operation (city, intercity)
8 Total carrying capacity
9 Fuel consumed per year (kilo liters)
10 Effective km per year
11 Dead km per year
12 Days used per year
13 Average speed, peak hour (kmph)
14 Average speed, non-peak hour (kmph)
15 Average occupancy, peak hour
16 Average occupancy, non-peak hour
17 Total ridership per year
18 Total idling time per day (min)
19 Number of trips per day
20 Average trip length (km)
Journal of Public Transportation, Vol. 17, No. 3, 2014 41Improving Fuel Efficiency and Reducing Carbon Emissions from Buses in India
From the data collected under the parameters in Table 1, the summary of the indicators
developed is shown in Table 2.
TABLE 2. Parameters BMTC KSRTC SETC
Comparison of Fleet Data Number of buses 185 312 52
Average fuel efficiency (kmpl) 3.77 4.28 5.04
Number of days used per year 312 334 260
Bus utilization per day (km) 225 432 692
Average passengers per bus on road per day 504 281 85
Passenger load factor (%) 104 70 76
Total passenger-kilometers (M) 747 1475 288
Average passenger lead (avg. distance traveled by passenger, km) 25.85 313 294
Dead kilometers (00,000) 1.07 8.38 1.01
Gross bus utilization/year (00,000) 0.7 1.41 1.81
Average speed (kmph) 40 48 67
Average effective km (%) 99.1 98 98.9
Average dead km (%) 0.86 2 1.1
Average age of bus (yr) 6.26 3.29 4.02
Scrapping limit (yr) 10 8 10
Number of over-age buses 15 4 0
Average idling time (min) 34 45 43
BMTC = Bangalore Metropolitan Transport Corporation
KSRTC = Karnataka State Road Transport Corporation
SETC = State Express Transport Corporation
There is a perception among industry experts and fleet managers that introducing
new buses with improved emission standards causes a substantial decrease in the fuel
efficiency of buses, thus lowering the fleet fuel efficiency. However, as shown in Table 3
and based on our analysis, it was found that old buses with lower emissions standards
are experiencing lower fuel efficiency when compared with newer buses. Data from all
the three agencies substantiate this argument, except in the case of Euro I of BMTC. The
deterioration of buses due to extensive use over the years dominates the impact of fuel
efficiency reductions due to emissions standard improvement. So, as a new bus replaces
an older bus, it would be incorrect to assume that the fuel efficiency of buses would be
reduced.
Journal of Public Transportation, Vol. 17, No. 3, 2014 42Improving Fuel Efficiency and Reducing Carbon Emissions from Buses in India
TABLE 3. Year of Fuel Consumed Vehicle km Fuel Efficiency
Agency Bus Type
Kilometers Traveled and Manufacture (kilo liters) Traveled (km) (kmpl)
Fuel Consumed Based on Euro IV >2010 117 517,940 4.43
Emissions Standards
Euro III 2006–2010 2,022 6,886,458 3.41
BMTC
Euro II 2002–2005 895 3,870,036 4.33
Euro I 2000–2001 355 1,629,026 4.59
Euro III 2006–2010 5,402 23,396,049 4.33
KSRTC Euro II 2002–2005 4,773 20,193,029 4.23
Euro I 2000–2001 135 497,667 3.68
Euro III 2006–2010 149 832,369 5.60
SETC
Euro II 2002–2005 1,722 8,554,555 4.97
BMTC = Bangalore Metropolitan Transport Corporation
KSRTC = Karnataka State Road Transport Corporation
SETC = State Express Transport Corporation
TABLE 4. Agency/Type Highest (kmpl) Lowest (kmpl) Average (kmpl) # Buses
Variation of Fuel BMTC Non-AC 5.33 3.88 4.38 160
Efficiencies among Fleets
BMTC AC 1.99 1.56 1.70 25
KSRTC Non-AC 5.68 4.38 5.23 159
KSRTC AC 4.84 3.22 3.73 153
SETC Non-AC 5.82 5.1 5.31 42
SETC AC 3.94 3.59 3.85 10
BMTC = Bangalore Metropolitan Transport Corporation
KSRTC = Karnataka State Road Transport Corporation
SETC = State Express Transport Corporation
There exists a substantial difference in fuel efficiency of the buses among different depots
within a single agency in a city. Traffic characteristics do not vary significantly among
depots within a city and, thus, this points towards establishing a need for having a stan-
dardized maintenance code and practices and rewarding depots that achieve higher fleet
fuel efficiency values.
FIGURE 1.
Comparison of fuel
efficiency of buses at
different depots in BMTC
Journal of Public Transportation, Vol. 17, No. 3, 2014 43Improving Fuel Efficiency and Reducing Carbon Emissions from Buses in India
A questionnaire was designed to evaluate the commitment of the agencies in improving
fuel efficiency of the buses and maintenance practices. A set of 19 questions was dis-
cussed with top management of the agencies, and the results are summarized in Table 5.
TABLE 5. Fuel Economy Scorecard for Current Bus Fleet BMTC KSRTC SETC
Questionnaire for I. Management 1. Is there a senior executive in charge of fleet fuel economy,
Management on Fuel commitment and is some part of his/her bonus tied to meeting fuel economy No No No
Efficiency Initiatives and ownership goals?
2. Do you benchmark and set appropriate fuel economy goals
No Yes Yes
by bus type for each year?
3. Do you communicate the fuel economy results achieved
each year to both employees and the public to create an Yes No No
environment-friendly brand?
4. Is a strategy to replace old buses actively pursued? No No Yes
5. Is a policy to improve the speed of the buses actively
No No No
pursued?
6. Is a strategy to reduce idling and emissions actively pursued? No No No
II. Data 7. Is the data collection process automated to the extent
collection and feasible, and do you use analysis software to support No No No
analysis maintenance?
8. Have you set up data quality assurance procedures? No No No
9. Do you analyze the data for separating the effects of driver,
Yes Yes Yes
route and bus-related effects on fuel economy?
10. Do you use a GPS or a black box to collect data on driver
No No No
behavior and infrastructure routing?
10a. Do you use data to refine periodic maintenance? Yes Yes Yes
III. Maintenance 11a. Do you select at least 10% of the fleet showing the lowest
Yes Yes Yes
fuel economy and conduct simple checks at depots?
11b. Do you conduct detailed checks at the central facility if the
Yes Yes Yes
bus passes step 11a to determine the issues?
11c. Do you compare pre- and post-repair fuel economy data on
Yes Yes Yes
these buses to estimate program benefits?
12. Do you check repair quality on a random and periodic basis? Yes Yes Yes
13. Do you obtain mechanic sign-off on repairs for traceability? Yes Yes Yes
14. Do you conduct an independent team audit of repairs across
No No No
depots?
15. Do you retrain mechanics and update repair procedures
Yes Yes Yes
periodically?
IV. Training of 16. Do you train drivers on fuel-efficient driving techniques and
Yes Yes Yes
low-performing periodically retrain them?
drivers 17. Do you select at least 10 percent of drivers with the lowest
Yes Yes Yes
fuel efficiency and conduct special additional training?
V. Employee 18. Do you publicly display the fuel economy performance by
No No No
communications driver and bus depot to employees?
and rewards 19. Do you reward mechanics at the depot level and drivers
No Yes Yes
individually for exceeding targets?
BMTC = Bangalore Metropolitan Transport Corporation
KSRTC = Karnataka State Road Transport Corporation
SETC = State Express Transport Corporation
Journal of Public Transportation, Vol. 17, No. 3, 2014 44Improving Fuel Efficiency and Reducing Carbon Emissions from Buses in India
It was found that agencies do not prioritize the automated data collection process (ques-
tion 7) to understand driver behavior and use the data to train drivers, although analysis
of the data is conducted to study the impact on driver, route, and bus. Some of the other
learnings that emerged in this process are the following:
• Top management is not directly held responsible for ensuring improvement in fuel
efficiency.
• There is no strategy to reduce emissions.
• Maintenance works are recorded and documented.
• Driver and mechanic training is given emphasis to get the best out of them.
• Fuel economy targets and achievements are not well-publicized internally and
externally.
It was observed that due to factors such as congestion and route, the variation in annual
distance traveled by different buses was very high, with a range of 10,000–230,000 km/
year. Due to operational issues, such as lack of adequate buses, many fuel “guzzlers” were
used for greater distances when compared to more efficient buses. Ideally, low fuel-effi-
cient buses should not be used to travel longer distances per day, while buses with higher
fuel efficiencies should be used to travel more kilometers per day to optimize the fuel
efficiency of the fleet.
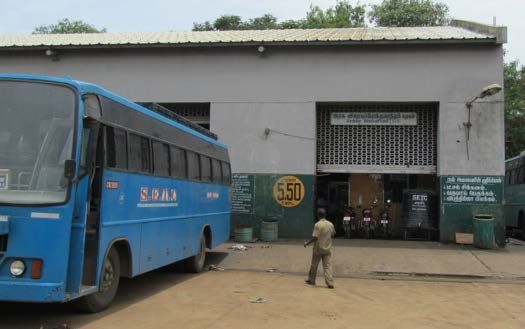
FIGURE 2.
Fuel efficiency target
of 5.50 kmpl displayed
prominently at a depots
The table provided in the tool ranks the under-utilized and over-utilized buses, which
enable a fleet owner to rationalize the bus routes based on fuel efficiency. By reorienting
the buses—that is, using high fuel-efficient buses along routes with higher activity—sig-
nificant savings can be generated. It is calculated that by identifying and rerouting 20
buses, more than $30,000 USD could be saved in a year. Ideally, the more the fuel effi-
ciency of a bus, the higher should be the activity. For example, in the case of Depot 14 of
Journal of Public Transportation, Vol. 17, No. 3, 2014 45Improving Fuel Efficiency and Reducing Carbon Emissions from Buses in India
BMTC, the over-utilized buses did an average of 287 km per day while the under-utilized
buses did 233km per day (Table 6). This is a significant observation, as traffic characteris-
tics do not radically alter within a depot influence area.
TABLE 6. BMTC KSRTC SETC
Bus Utilization vs. For 20 over-utilized and under-utilized Over- Under- Over- Under- Over- Under-
Fuel Efficiency buses data utilized utilized utilized utilized utilized utilized
Average fuel efficiency (km/liter) 3.65 4.82 3.50 5.52 5.03 5.41
Total km/bus/day 270 183 711 230 727 686
Fleet avg. km/bus/day 225 432 692
An hour of idling for a bus consumes almost two liters of fuel (Clean Air Asia 2012). Based
on the data analyzed, it was observed that, on an average, idling resulted in consumption
of more than 1.2 liters of fuel per day per bus (Table 7). This was very high, as very few
buses were air-conditioned, thus indicating poor driving practices. The main reason sug-
gested by drivers was lack of confidence in restarting the buses on the congested roads
and junctions or, in the case of intercity air-conditioned buses, the buses had to be kept
on to keep the air-conditioner working.
TABLE 7. BMTC KSRTC SETC
Average Idling Time and its Avg. idling time (min) 34 45 43
Impact on Fuel Consumption Fuel impact per bus per day (ltr) 1.2 1.4 1.1
BMTC = Bangalore Metropolitan Transport Corporation
KSRTC = Karnataka State Road Transport Corporation
SETC = State Express Transport Corporation
There is a non-linear relationship between speed and fuel consumed. The ideal speed or
speed at which maximum fuel efficiency is obtained depends on each vehicle class; for
buses, it is approximately in the range of 55–60 kmph (Asian Development Bank and Min-
istry of Transport 2009). Beyond that speed, aerodynamic resistance is very high, thereby
reducing fuel efficiency. However, emphasis on the speed impact on fuel efficiency is not
given much importance. If the average speed of buses can be increased through inter-
ventions such as bus rapid transit (BRT), transit signal priority (TSP), exclusive bus lanes,
high-occupancy vehicle lanes, etc., significant fuel savings can be achieved. It has been
estimated that if the bus speed can be increased from 15kmph, which is the average bus
speed in city conditions in India (Bangalore Traffic Improvement Project B-TRAC 2010), to
20kmph, a nearly 25 percent improvement in fuel efficiency could be observed, resulting
in a saving of 4,000 liters of fuel per year per bus (Asian Development Bank and Ministry
of Transport 2009).
By replacing some of the older buses, which have high emissions and are beyond produc-
tive life, with new buses, fleet emissions can be reduced. The average age of the fleets was
around five years, and nearly seven percent of the buses were found to have exceeded
the scrapping limit set by the respective agencies (as seen in Table 2) but still were being
Journal of Public Transportation, Vol. 17, No. 3, 2014 46Improving Fuel Efficiency and Reducing Carbon Emissions from Buses in India
used due to lack of resources to purchase new buses and high public transport demand.
With the introduction of newer buses that meet BS IV standards (equivalent to Euro IV),
emissions are greatly reduced, since newer buses adhere to stricter emission norms. For
example, by scrapping 15 ordinary buses that are 11–15 years old and by introducing 15
new buses, Particulate Matter (PM) savings of 2.19 tons per year and NOx savings of 27.54
tons per year can be achieved. Along with reduced emissions, one can also ensure greater
productivity (more than 2,000km/year) due to fewer repairs, breakdowns, and mainte-
nance issues from new buses.
Recommendations
Based on the analysis of the sample data and the literature survey, it was observed that a
10 percent increase in fuel efficiency can be easily targeted by initiating several measures.
• Fuel Economy Targets – Bus operators need to be engaged in setting fuel efficiency
targets for their fleets and monitoring the impact. For example, national level targets
or key performance indicators (KPI) for buses/fleets on road should be designed for
different types of buses and buses operating in different regions. A branding scheme
such as a star rating system could be established. Buses/fleets satisfying the standards
could be branded and incentives could be packaged. This kind of initiative can be
undertaken only with regulatory, legal, and institutional support. A good example of
this is China’s proposed Green Freight Initiative scheme for awarding truck operators
or its Green and Yellow label for vehicles based on emissions standards (Ministry of
Environmental Protection, China 2009). It was found that by mandating fuel efficiency
targets, making top management responsible for achieving the targets, collecting
scientific data, and conducting training, 3–5 percent fuel efficiency improvements
can be achieved (ESMAP 2011).
• Branding – Buses need to go beyond a brand “logo.” The Ministry of Road Transport
and Highways, which is the national ministry responsible for transport in India, needs
to take an active lead in designing and implementing a communication strategy on
Clean Buses. The vision of such a strategy should be that the public image of bus
transforms from “dirty buses” to “clean/green buses.” One of the strongest reasons
branding exercises need to be done is to bring bus transport to people’s attention and
project it as a friendly, safe, and reliable mode. One example of bus communication
and branding is “Bus Day” organized by BMTC on the 4th of every month.
• Capacity Building – National training should be conducted for drivers, mechanics,
and operators to improve bus repair, bus maintenance, and driver behavior.
Universities and research institutions need to take a lead in developing and
providing a national mid-level management training program on optimizing, routing,
scheduling, and synchronizing of bus movements. Bus manufacturers can play an
important role in training mechanics and drivers. Current training methods adopted
are not scientific and are carried out on old buses with different technologies.
• Data – Currently, the Central Institute of Road Transport in India collates and
publishes the performance data on State Transport Undertakings (STUs). There
is need to include bigger private bus companies in such annual reviews so that
Journal of Public Transportation, Vol. 17, No. 3, 2014 47Improving Fuel Efficiency and Reducing Carbon Emissions from Buses in India
adequate comparison can be made and insights drawn. The annual reporting needs
to be compulsory, and guidelines for data collection need to be developed. The data
collection process for distance, fuel consumption, and driving behavior needs to be
updated and automated as much as possible. Annual monitoring of fuel efficiency
values should be linked with incentives for good performers (awards or subsidy).
• Finance – An appropriate microfinance/revolving fund/subsidy scheme should be
designed to target gross polluters using strategies such as technology retrofit, repair-
maintenance, repower, and replace.
• Urban Participation – Fuel efficiency measures are directly linked with land-
use, ridership improvement, speed improvement, and accessibility improvement
measures. Bus agencies, unfortunately, do not have direct control on many of such
variables and, thus, improving fuel economy measures needs to go beyond buses. Bus
operators need to play an active role as important stakeholders in urban transport
issues and ensure that the city transport system supports the buses as much as the
buses support the city transport system.
• Technology – Smart technologies such as signal prioritization can be a solution to
reduce junction idling. By installing wider doors, faster ingress and egress can be
achieved, resulting in reduced idling at bus stops. By constructing exclusive lanes,
idling related to congestion and traffic jams can be reduced.
References
Asian Development Bank and Ministry of Transport, People’s Republic of China. 2009.
Green transport resource optimization, Volume 2.
Bangalore Traffic Improvement Project B-TRAC. 2010. http://www.bangaloretrafficpolice.
gov.in/index.php?option=com_content&view=article&id=57&btp=57. Accessed
May 28, 2013.
Central Institute of Road Transport (CIRT). 2010. State transport undertakings—Profile
and performance 2009–10.
Central Pollution Control Board (CPCB). 2011. Air quality monitoring, emission inventory
and source apportionment study for Indian cities. National Summary Report. http://
www.cpcb.nic.in/FinalNationalSummary.pdf. Accessed May 15, 2013.
Clean Air Asia. 2012. Accessing Asia: Air pollution and greenhouse gas emissions indi-
cators for road transport and electricity. http://www.baq2012.org/assets/Uploads/
Accessing-Asia22Nov2012-FINAL-FOR-PRINT.pdf, accessed May 16, 2013.
Clean Air Asia. 2012. Green Trucks Toolkit. http://cleanairinitiative.org/portal/greentruck-
stoolkit, accessed May 16, 2013.
ESMAP. 2009. Guidance note best operational and maintenance practices for city bus
fleets to maximize fuel economy. http://www.esmap.org/sites/esmap.org/files/
FINAL_EECI-BusGuideNote_BN010-11.pdf, accessed May 25, 2013.
Journal of Public Transportation, Vol. 17, No. 3, 2014 48Improving Fuel Efficiency and Reducing Carbon Emissions from Buses in India
Fabian, B., and Gota, S. 2009. Emissions from India’s intercity and intracity road transport.
http://cleanairinitiative.org/portal/sites/default/files/articles-73353_resource_1.pdf,
accessed May 16, 2013.
Government of India. 2010. Report of the expert group on a viable and sustainable system
of pricing of petroleum products. http://petroleum.nic.in/reportprice.pdf, accessed
May 14, 2013.
Government partially deregulates diesel prices, hikes LPG cap. Zee News, January 18, 2013.
http://zeenews.india.com/business/news/economy/govt-partially-deregulates-die-
sel-prices-hikes-lpg-cap_68315.html, accessed May 28, 2013.
Institution of Transportation Policy Studies (ITPS). 2009. A study of mid/long-term rail-
way networks.
Ministry of Environmental Protection, The People’s Republic of China. 2009. http://
english.mep.gov.cn/News_service/news_release/200908/t20090817_157507.htm,
accessed May 26, 2013.
Ministry of Road Transport and Highways, Government of India. 2008. http://morth.nic.
in/, accessed May 13, 2013.
Ministry of Urban Development, Government of India. 2008. Study on traffic and trans-
portation policies and strategies in urban areas in India. http://www.urbanindia.nic.
in/programme/ut/final_report.pdf, accessed May 1, 2013.
Ministry of Urban Development, Government of India. Transforming city bus transport
in India through financial assistance for bus procurement under JnNURM. http://
jnnurm.nic.in/wp-content/uploads/2012/02/booklet-on-transforming-City-Bus-
Transport-in-India.pdf, accessed May 9, 2013.
Report of the Sub Group on State Road Transport. Undertakings formed under the Work-
ing Group on Road Transport Constituted by Planning Commission, Twelfth Plan
2012–2017. http://www.indiaenvironmentportal.org.in/files/file/Report percent20S-
RTUs.pdf, accessed May 15, 2013.
Singh, J. 2010. Bus system reform in India through initiative under JnNURM – A way
forward towards sustainable public transport. http://www.slideshare.net/jaaaspal/
bus-system-reform-in-india-through-jnnurm, accessed May 10, 2013
United Nations Environment Program (UNEP). 2009. Cleaning up urban fleets. http://
www.unep.org/transport/pcfv/PDF/Retrofit.pdf, accessed May 15, 2013.
World Bank. 2006. Average unit road user costs. http://web.worldbank.org/WBSITE/
EXTERNAL/TOPICS/EXTTRANSPORT/EXTROADSHIGHWAYS/0,,contentMD-
K:20964930~menuPK:1097394~pagePK:148956~piPK:216618~theSitePK:338661~is-
CURL:Y~isCURL:Y,00.html, accessed May 16, 2013.
Journal of Public Transportation, Vol. 17, No. 3, 2014 49Improving Fuel Efficiency and Reducing Carbon Emissions from Buses in India
Acknowledgments
Mr. Sudhir would like to acknowledge support by the Lee Schipper Memorial
Foundation/WRI Fund.
About the Author
Sudhir Gota (Sudhirgota@gmail.com) specializes in environmental issues related to
transport and has extensive experience in transport data crunching and developing models
and methodologies on transport emissions for different types of projects, policies, and
investments. He has more than 10 years of experience in research and managing projects
related to transportation and environment and is an active researcher. He has co-written
a book on low carbon transport and several publications and policy briefs on transport
and environmental issues challenging conventional practices and advocating innovative
solutions.
Parthaa Bosu (Parthaa.bosu@cleanairasia.org) has more than 11 years of experience
in corporate affairs and corporate communications. Moving from a transport company,
he joined the Society of Indian Automobile Manufacturers (SIAM) in 2000 to look into
in-use vehicle emissions before moving onto special projects and headed Corporate
Communications. In 2009, he had a brief stint with the Organising Committee Common-
wealth Games Delhi 2010 and was instrumental in developing the first walkability survey
application. He is a part of the working group on NMT promotion in the Ministry of Urban
Development in India.
Sameera Kumar Anthapur (Sameera.kumar@cleanairasia.org) is the Transport
Researcher for the Clean Air Asia team in India and has an interest in NMT systems and
policies. Previously, he worked in the transport sector in various capacities for more than
five years, where he had wide exposure to project coordination, estimation, traffic surveys,
analysis, documentation, signal design, and design of roads and NMT facilities.
Journal of Public Transportation, Vol. 17, No. 3, 2014 50You can also read