SimCity For Real: Land Use, Energy Demand
←
→
Page content transcription
If your browser does not render page correctly, please read the page content below
SimCity…For Real: Land Use, Energy Demand, and
                             the Next Generation of Modeling Tools
                             Joe DiStefano and Erika Lew, Calthorpe Associates

   ABSTRACT

           Land use – where and how people and jobs are located, and the transport systems that
   link us together – is a critical in addressing energy, resource, and climate challenges. The open
   source UrbanFootprint model was developed in the wake of the 2006 passage of California’s AB
   32 as state and local governments grappled with how to measure the impacts of land use on
   climate change emissions. UrbanFootprint combines powerful capabilities for compiling and
   normalizing data with tools for creating land use and transportation scenarios, allowing users to
   measure transport and building energy, emissions, and costs of land use plans and policies. It
   also includes a suite of public health, fiscal impacts, land conservation, water, and other analysis
   engines to inform decision-makers and the public about the impacts of land use and related
   investment decisions.
           Use of UrbanFootprint by state and regional agencies is changing how plans are made
   and adopted. The California Energy Commission will use UrbanFootprint to evaluate current and
   proposed building standards and policies in combination with land use policies. Three of
   California’s largest regional agencies are transitioning to UrbanFootprint as their scenario and
   land use planning platform. UrbanFootprint is the foundation for a movement towards more
   informed land and transportation planning that addresses energy, climate, public health, and
   fiscal challenges.
           This paper reviews methods used to estimate building energy impacts in UrbanFootprint,
   its application in the context of land planning in California, and how its framework can be
   advanced to connect land use and energy planning into the future.

   Background
            UrbanFootprint is an open source, web-based scenario software platform that supports
   cities, counties, regions, and states in creating and evaluating the impacts of land use plans,
   transportation investments, and other critical policies. It is designed to operationalize powerful
   scenario development methods and tools within a single platform that can handle data
   development and maintenance, scenario creation, and dynamic analysis of environmental, fiscal,
   and public health metrics.
            The initial version of UrbanFootprint (1.0) was developed by Calthorpe Associates as
   part of the Vision California project, which was funded by California state agencies to enhance
   capacity to build and model land use plans in support of the state’s leading-edge climate and land
   use laws (AB 32 and SB 375)1. Applied across the major regions of the state, the model

   1
     The Sustainable Communities and Climate Protection Act of 2008, also known as Senate Bill 375 or SB 375, is a
   State of California law targeting greenhouse gas emissions from passenger vehicles. The Global Warming Solutions
   Act of 2006 (AB 32) sets goals for the reduction of statewide greenhouse gas emissions. Passenger vehicles are the
   single largest source of greenhouse gas emissions statewide, accounting for 30% of total emissions. SB 375
   therefore provides key support to achieve the goals of AB 32. (http://gov.ca.gov/fact-sheet/10707/). SB 375 instructs

©2014 ACEEE Summer Study on Energy Efficiency in Buildings                                                                 10-93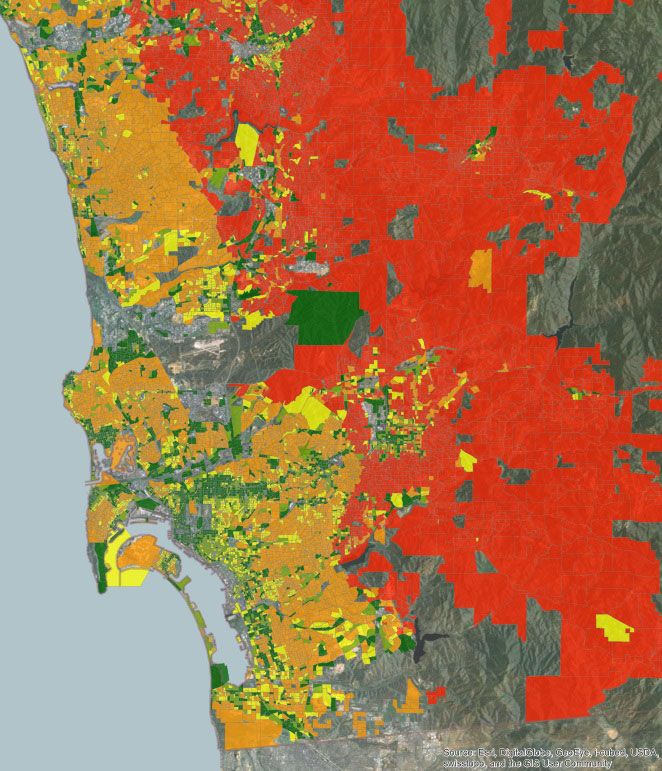
demonstrated new capability, speed, and breadth in its ability to model and comprehensively
measure climate, energy, water, fiscal, land use, public health, and travel metrics associated with
land use and transportation scenarios. UrbanFootprint 1.0 also conveyed the potential of a fully
open source, non-proprietary software stack as a common framework for planning and analysis
at multiple scales. Upon its introduction to an array of public sector, academic, and NGO users, a
new ”community” formed around UrbanFootprint’s more advanced and accessible suite of
scenario development and analysis tools2.
Calthorpe Associates has since been working with three of California’s largest
metropolitan planning organizations (MPOs) – the Sacramento Area Council of Governments
(SACOG), San Diego Association of Governments (SANDAG), and Southern California
Association of Governments (SCAG) – as they transition their land use scenario development
and modeling activities to UrbanFootprint. Work with these agencies has focused on the
development of an advanced web-based user interface that can be used by MPO staff to build
and model plans and polices for their next round of Sustainable Community Strategies (SCSs)
and Regional Transportation Plans (RTPs). Ultimately, this interface will convey the data
development, scenario testing, and analytical capability of UrbanFootprint to cities and local
jurisdictions as well. Support for and use of UrbanFootprint, as well as the development and
deployment of RapidFire, the programmatic, spreadsheet-based sketch model that also originated
with the Vision California project, have evidenced the demand by MPOs, local jurisdictions, and
advocate groups for relatively quick and comprehensible analysis of the impacts associated with
land use and transportation planning scenarios.
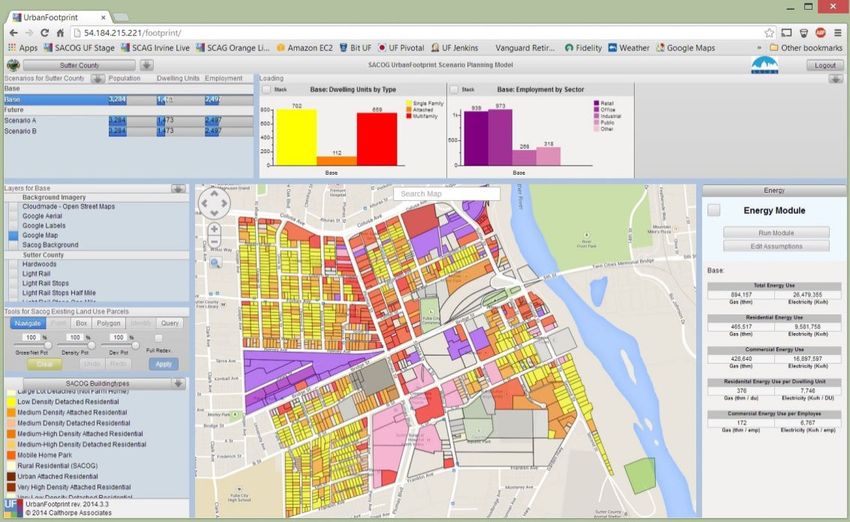
Figure 1. Overview of UrbanFootprint v1.1.0(b) user interface.
the California Air Resources Board (CARB) to set regional emissions reduction targets from passenger vehicles.
The Metropolitan Planning Organization for each region must then develop a "Sustainable Communities Strategy"
(SCS) that integrates transportation, land-use, and housing policies to plan for achievement of the emissions target
for their region.
2
UrbanFootprint is one of a number of scenario planning tools. It is the only fully open source and web-based tool.
For more information on this and other scenario planning tools, please see the Lincoln Institute of Land Policy’s
2012 report, Opening Access to Scenario Planning Tools.
©2014 ACEEE Summer Study on Energy Efficiency in Buildings 10-94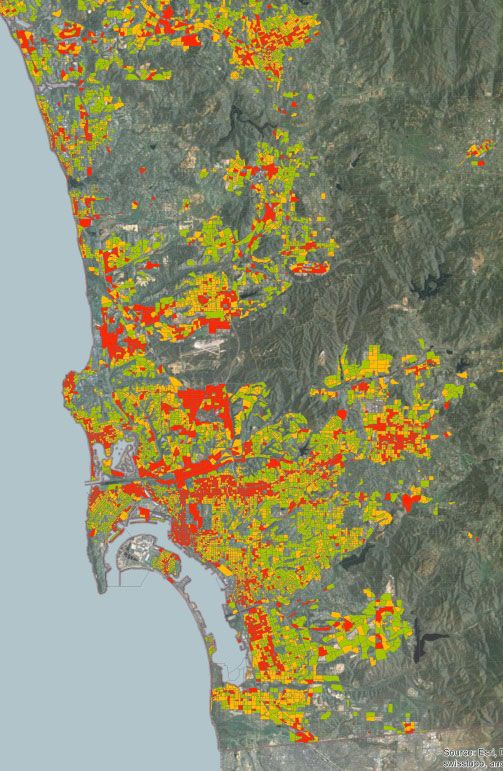
Figure 1 provides a visual overview of the UrbanFootprint v1.1.0(b) user interface.
   Model development has included new parcel-level painting tools, scenario development
   functions, scenario and subarea query and reporting tools, data layer import and export features,
   a built form editor, and a place type visualizer.
            Ongoing software development activity has built upon concurrent deployment of
   UrbanFootprint, including its use to develop and analyze SCS alternatives in San Diego, work
   with NGOs and MPOs in California’s Central Valley, and the development of a transit-oriented
   development strategy in Honolulu, Hawaii. A technical review of the energy, water, and carbon
   analysis components of the model by public and academic sector experts was also completed,
   and new work is underway with the California Energy Commission to use UrbanFootprint in
   evaluating energy efficiency policies for new and existing buildings. Work is also beginning to
   advance the public health analysis capability of UrbanFootprint, and enhancements to open space
   modeling are likely to begin in the near future.

   The Role of Land Use in Energy Demand
            Land use planning affects building energy demand by way of built form and development
   location. More compact land use patterns entail a greater proportion of smaller and attached
   home types and commercial buildings that use space more efficiently than in more expansive and
   auto-dependent patterns; with less conditioned space, demand for energy is lessened. Moreover,
   development location affects energy demand to the extent that buildings in less temperate
   locations require more energy for heating and cooling. While many other factors affect demand –
   from appliance efficiency to on-site renewable energy technologies – it is important to assess the
   savings potential attributable to all measures.
            Examination of the role of land use in building energy demand sits well with California’s
   “loading order” policy for meeting electricity demand, which lists energy efficiency and demand
   response first, renewable resources second, and clean and efficient natural gas-fired power plants
   third. In this context, land use should be seen as a foundational component of demand reduction
   – one which exists as a precursor to building energy efficiency and demand response. The
   building energy analysis component of UrbanFootprint is structured so that the impacts of land
   use plans and their associated building programs can be evaluated comprehensively along with
   the effects of policy-based assumptions for building energy efficiency improvements and
   renewable energy generation.
            Land use also affects energy use by way of its impacts on passenger vehicle travel and
   water demand. Just as for building energy, compact development is associated with reduced
   demand for both. UrbanFootprint can additionally apply assumptions about the role of renewable
   resources and technologies in supplying building, water, and transportation energy to ultimately
   put the impacts of development alternatives and individual policy variables into the broad
   context of GHG emissions reductions.

   UrbanFootprint Building Energy Analysis Methodology
          UrbanFootprint models building energy use, and related costs and greenhouse gas (GHG)
   emissions, for new and existing residential and commercial buildings. Scenarios vary in their
   building energy use profiles due to their building program, the location of new growth, and
   policy-based assumptions for improvements in energy efficiency. The costs and GHG emissions

©2014 ACEEE Summer Study on Energy Efficiency in Buildings                                              10-95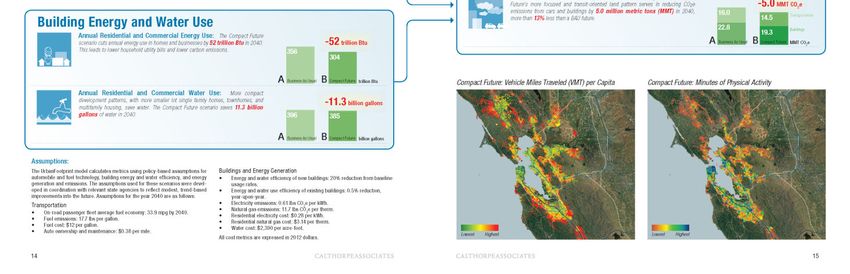
associated with energy use, in turn, vary according to policy-based price and emissions rate
   assumptions.
           Within the model, energy use is determined by three types of variables: building
   characteristics, climate zone, and efficiency factors. Building characteristics and climate zone
   determine what baseline per-residential unit or per-commercial square foot factors (derived from
   survey data) are used to calculate energy use. Reductions are then applied to the resulting
   baseline estimates to reflect the implementation of building efficiency and conservation policies
   into the future. Figure 2 outlines the general steps involved in the model’s energy use
   calculations.

          Figure 2. Broad overview of energy analysis steps in UrbanFootprint.

   Baseline Energy Use

            Baseline energy use factors quantify electricity and natural gas demand per residential
   unit or commercial square foot by building type and climate zone. Building characteristics are
   tied to scenario composition, while climate zone is location-dependent.

   Building types. Through the application of place and building types to the landscape (distributed
   into grid cells, parcels, or other specified geography), UrbanFootprint details scenarios in terms
   of their component building characteristics, which are the foundation for estimating energy use.
   Residential units are classified by type, including small- and large-lot single family, townhome,
   and multifamily. Commercial buildings are described in terms of square footage by use category
   – including subcategories of retail, office, and other non-residential types – which are linked to
   numbers of jobs by employment sector. The numbers of residential units and amounts of
   commercial square feet per acre of a given place type are grounded in its specific mix of building
   types. Figure 3 shows a sample of the place and building types used for Vision California.
   Figure 4 shows a sample view of a scenario in UrbanFootprint in which building types, listed in a

©2014 ACEEE Summer Study on Energy Efficiency in Buildings                                              10-96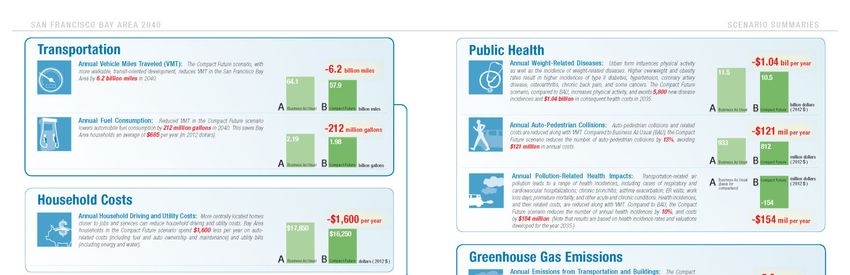
panel on the left side of the screen, are applied to parcels. Overall scenario composition,
   expressed in terms of counts of housing units by type and employees by sector, is shown in
   charts at the top of the screen; totals for the new growth increment and “end state” are updated
   dynamically as users “paint” or edit scenarios.

                      Figure 3. UrbanFootprint library of California place types (left) and building types
                      (right), as used in the Vision California project.

          View of a

                       Figure 4. Sample view of parcel-based scenario in UrbanFootprint. In this case, regionalized
                       building types are applied to parcels.

©2014 ACEEE Summer Study on Energy Efficiency in Buildings                                                            10-97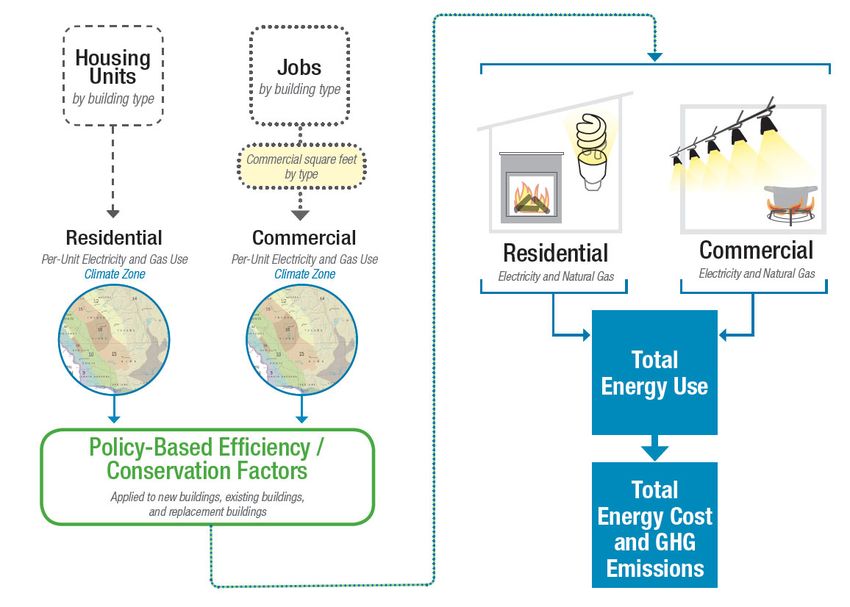
The energy required to serve the same numbers of homes and jobs varies by scenario due
   to the types of buildings assumed to accommodate them, their location, and policy factors. While
   a number of factors contribute to energy consumption patterns, residential energy use varies
   significantly by home size, with more spacious and detached units requiring more energy.
   Similarly, commercial energy use is linked to building size. Thus, scenarios that include more
   compact development patterns and building types generally exhibit lower energy use profiles
   than more dispersed scenarios.

   Climate zones. Energy use varies according to climate characteristics, which affect heating and
   cooling needs – a major determinant of electricity and natural gas use. California’s Title 24
   Building Standard climate zones are the geographic basis for the application of energy efficiency
   standards and the classification of energy use data.

   Residential energy baselines. Baseline residential energy use factors specify the amount of
   electricity and natural gas used annually per housing unit, by housing type and climate zone. For
   California, UrbanFootprint uses factors based on CEC Residential Appliance Saturation Survey
   (RASS) data (CEC 2010). These factors represent base-year energy use (the most recent RASS
   data is from 2009), with future-year energy use estimated in terms of user-defined reductions
   from base year estimates, which can be informed by specific energy efficiency targets or
   policies. Note that, while the specifics of using RASS data are described here, alternative
   baseline factors can be loaded into the model to reflect data tuned to the scale and location of
   scenarios to be developed and analyzed.
           As part of an early 2013 peer review and model advancement process for UrbanFootprint,
   the need to refine energy use baselines to improve accuracy and sensitivity to variations in
   building type, size, and climate zones was identified. To support this improvement, CEC
   provided access to their full 2009 RASS dataset, allowing for statistical analysis of the survey
   data. RASS data variables associate energy consumption with climate zones, utility service areas,
   appliance saturation, and building and household characteristics. Per-unit average energy use
   baselines are estimated for the UrbanFootprint residential building types, which are currently
   simplified into four categories (single family large lot, single family small lot, single family
   attached/townhome, multifamily), and vary by Title 24 climate zone. The residential baseline
   factors consist of a base energy usage constant, plus a per-square foot energy intensity that is
   applied to account for unit size.

   Commercial energy baselines. Baseline commercial energy use factors specify the amount of
   electricity and natural gas used annually per square foot for commercial buildings. For
   California, UrbanFootprint uses rates based on CEC Commercial End-Use Survey (CEUS) data
   (CEC 2006). The CEUS provides energy intensities (EI) – energy use per square foot – by end
   use for 12 building types, classified by climate zone. UrbanFootprint uses total energy intensities
   to include all end uses surveyed. While the specifics of using CEUS data are described here,
   alternative baseline factors can be loaded into the model to reflect data tuned to the scale and
   location of scenarios to be developed and analyzed.
            UrbanFootprint estimates building square footage by employment category for the base
   year by applying per-employee floor space assumptions (calibrated to the planning region) to job
   totals. For future scenario years, floor space is first estimated by broad employment sector (retail,
   office, industrial) through the application of place and building types, which specify their spatial
   proportions within buildings. Location-specific employment data (for the base year), or

©2014 ACEEE Summer Study on Energy Efficiency in Buildings                                                 10-98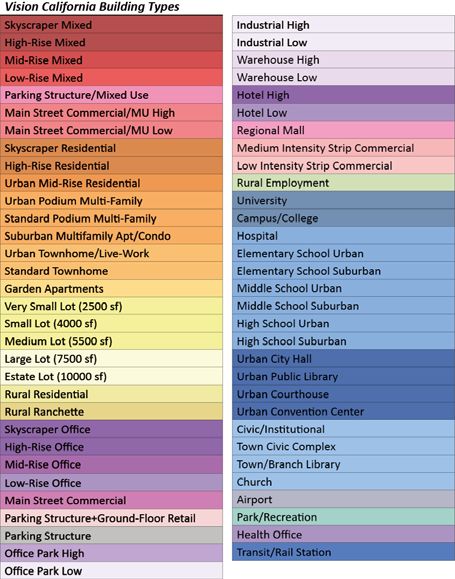
employment projections (for future years) are then used to further apportion floor space among
   employment subsectors. The CEUS floorspace categories (including small and large office,
   restaurant, retail, food store, refrigerated and unrefrigerated warehouse, school, college, health,
   lodging, and miscellaneous, as established by CEC) are mapped to the employment subsector
   categories used within UrbanFootprint to arrive at factors that can be applied to the floorspace as
   estimated by the model.

   Refining energy use baselines. Further work (likely supported by CEC) may yield more refined
   residential and commercial baseline usage data and assumptions to connect to a wider range of
   building types representing existing, retrofitted, and future building stock. Refined factors may
   make use of data from energy simulation models and commissioning data, as well as improved
   billing or other data reflecting the energy usage of existing buildings. For example, specific
   energy use assumptions by building vintage would be a significant improvement to estimates of
   baselines as well as the potential impacts of local, regional and/or statewide policies. These
   refinements would allow for robust analysis to help guide CEC in energy efficiency policy
   development, as well as strengthen analysis for planning and policy development at the regional
   and local levels.

   System losses. The model is designed to account for the energy that is lost in transmission and
   distribution, and its associated emissions. An average “line loss” factor of 6% (EIA 2014) is
   assumed for residential and commercial electricity use, while a factor of 1.4% (EIA 2011) is
   assumed for “unaccounted for” or lost natural gas. These statewide average factors can be
   adjusted for regional analyses if more accurate data are available. In future collaboration with the
   CEC, refinements could be made to incorporate CEC analysis of energy cost components,
   including transmission and distribution costs as well as those related to generation energy,
   system capacity, and emissions.

   Building inventory model. The stock of residential and commercial buildings is subject to
   ongoing changes, as new construction, retrofits, and building replacement occurs. Modeling
   these changes over time is necessary for gauging the impacts of targeted policies on overall
   energy use. The numbers of buildings that are newly built or demolished (through
   redevelopment) result from the application of place or building types to the landscape (via
   scenario development). The numbers of existing buildings that are either retrofitted or replaced
   are determined by assumed rates, which can be varied to reflect the effects of policies that
   incentivize efficiency improvements for existing buildings. Finally, some amount of buildings –
   the remainder – can be assumed not to change. Going forward, each segment of the building
   population is subject to differing rates of improvement, as specified by energy efficiency factors.
            UrbanFootprint includes the framework for a building inventory model for use in
   building energy, water, and water-energy analysis. This model produces scenario-based counts of
   residential units and commercial floorspace classified by building type, location, status (new,
   renovated/replaced, or unchanged, vintage (year built, for new buildings only), and types of
   retrofitting applied for each year between the base and horizon years of a scenario, enabling
   calculations of annual as well as cumulative energy use totals – and their related GHG emissions
   impacts – over time.
            Significantly, the model goes beyond a simple accounting of existing development and
   planned growth. The building inventory is subject to user-specified rates for building upgrades
   over time. Building upgrades include major renovations/building replacement or retrofits, which

©2014 ACEEE Summer Study on Energy Efficiency in Buildings                                                10-99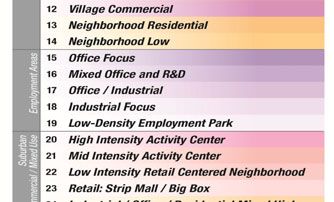
can be used to represent either incremental efficiency improvements or the installation of
   specific technologies, such as on-site renewables generation or the installation of solar hot water
   heating systems. The building inventory model allows for flexibility in defining retrofit rates (or
   rates of adoption of specific technologies) and assumptions about their associated energy demand
   reductions. Users can test the impacts of specific policies additively, or in isolation. The retrofit
   structure also creates flexibility in transferring consumption from one energy source to another
   (e.g., natural gas to electricity), or creating relationships between reductions in two or more
   measures. The framework of the building inventory model is fundamentally designed to give
   users flexibility in applying policies to which specific impact assumptions can be linked.
           The model currently generates inventory counts by applying building upgrade rates to
   aggregate totals of buildings at relatively broad geographic scales (city, region, or climate zone).
   Applying building turnover rates at smaller scales (such as the parcel or grid-cell scale) would
   likely introduce false locational precision with respect to broadly defined assumptions about
   future change (for example, gradual rates of building replacement over time); it would also be
   computationally intensive. Because the building inventory counts are generated at aggregate
   scales, the interim-year counts represent stops along a linear path from a base to an end-year
   scenario, rather than unique development scenarios in themselves. Upgrades to represent parcel
   or grid-cell specific building change would require significant model advancement and the
   inclusion of a predictive modeling component.

   Energy efficiency policy options. Energy efficiency policies are clearly a major determinant of
   building energy use. UrbanFootprint uses a basic framework of assumptions to reflect the impact
   of various energy efficiency and conservation policies into the future, in which new buildings are
   expected to meet increasingly higher standards for new construction, while the population of
   existing buildings is expected to exhibit improved performance as a result of buildings being
   either retrofitted, renovated, or replaced.
           Two main types of energy use reduction factors can be applied to express the effects of
   policy implementation on the various populations of new and existing buildings: 1) new
   construction efficiency, which represents the implementation of higher efficiency standards and
   policies into the future; and 2) retrofit efficiency, which represents energy savings due to
   building improvements made through retrofits, minor renovations, and other types of energy
   savings measures as defined by users.
           Energy (and water) policies can be varied by building type, region, and/or climate zone or
   other geography. As part of the 2013 peer review and advancement process, CEC and other
   advisors also identified a need to stratify assumptions about energy efficiency, so that reduction
   potential would be linked or scaled to segments of building energy use, such as space
   conditioning or plug loads, or specific vintages of buildings (e.g. buildings constructed before
   1980). Further study is needed to inform the potential ranges of energy savings relative to
   baseline energy use by segment. With this information, users could create weighted energy use
   reduction factors to apply within the model framework. Further work to refine the baseline
   energy use factors could inform the weighting process, particularly in terms of how building
   energy use is segmented by building type.
   New construction efficiency. New construction includes new buildings, building replacements,
   and major renovations. This includes buildings built on greenfield (previously undeveloped)
   land, those constructed through infill or redevelopment, and those built as replacements of
   existing buildings – each of these categories are treated as new construction. The “new

©2014 ACEEE Summer Study on Energy Efficiency in Buildings                                                 10-100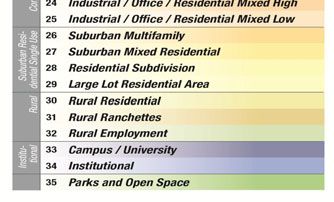
construction efficiency” factor can be set to reflect specific energy-saving policies for new
   construction, such as California’s Title 24 building standards, as well as local green building
   codes. The factor is expressed as a set of horizon-year energy use reduction targets (e.g., for
   2020, 2035, and 2050) from baseline energy use. Different sets of targets can be applied to test
   specific policies for residential and commercial energy use, and the electricity and natural gas
   components of each. Between horizon-year targets, the reductions are assumed to deepen at a
   steady rate. Thus, a multifamily unit built in 2025 would use less energy annually than the same
   type of unit built in 2015 – a rate which persists unless a subsequent retrofit occurs.
   Retrofit efficiency. Energy use in the population of existing buildings can be expected to decline
   over time as a result of buildings being retrofitted. “Retrofits” can be flexibly defined to
   represent building retrofits, the use of new equipment or appliances, or the installation of on-site
   renewable energy systems – in short, any building-related measures that would lead to improved
   energy performance. Similarly as for existing buildings, energy use in the population of “new”
   buildings (those built within the time span of a scenario) can be expected to be further reduced
   due to retrofits in years subsequent to their construction. The number of homes, or amount of
   commercial floor space, that undergoes retrofits is determined by retrofit rate assumptions
   specified as a percentage of building stock in each year.
           The model uses “retrofit efficiency” factors to reflect the savings potentials for residential
   and commercial electricity and natural gas use. These factors are expressed in terms of horizon-
   year target reductions from baseline (the same way that the new construction efficiency factor is
   expressed). Based on horizon-year target inputs, the building inventory model generates
   reduction rates for all years. Rates for each specific year are applied to units retrofitted in that
   year.

   UrbanFootprint policy sets. In UrbanFootprint, scenario results are typically calculated using
   defined “policy sets,” which are groups of assumptions for automobile and fuel technology,
   building energy and water efficiency, and energy generation and emissions that together
   represent broad policy directions. For Vision California and subsequent planning efforts
   (including RapidFire scenario modeling for California @ 50 Million: California’s Climate
   Future, the 2013 version of the Governor’s Environmental Goals and Policy Report) three
   general policy sets have been used in evaluating and communicating potential impacts: a “No
   Policy” set, an “Adopted” policy set, and an “Aspirational” policy set.
           A No Policy set, which assumes base-year performance into the future, is defined
   primarily for demonstration purposes, enabling a baseline comparison among scenarios that
   allows for a policy-neutral analysis of the role of land use and transportation systems. An
   Adopted policy set is intended to reflect improvements linked to currently adopted policy (such
   as California’s Renewables Portfolio Standard), with either no improvement or limited
   improvement occurring thereafter. Lastly, an Aspirational policy set reflects policies geared
   toward meeting California’s goal of reducing greenhouse gas emissions to 80% below 1990
   levels by 2050. Altogether, these policy sets are intended to cover the spectrum from minimum
   to maximum policy implementation, allowing for quick gauging of scenario performance ranges
   and the respective role of land use and various policies towards achieving environmental goals.

   Individual policy application. While the model may be set up with “default” policy sets, users
   also have the ability to specify and apply individual polices – useful for performing sensitivity
   analyses and evaluating policy variations. This ability is also useful for showing the relative

©2014 ACEEE Summer Study on Energy Efficiency in Buildings                                                  10-101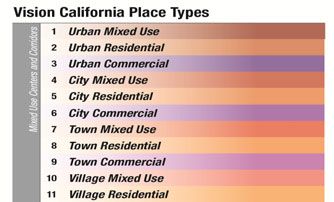
contribution of policies and land use plans towards a target – for example, California’s AB 32
   GHG reduction target. Figure 5 shows GHG emissions results with different land use scenarios
   and the subsequent layering-on of policies for vehicle performance and fuel composition,
   building energy efficiency, and renewable energy generation. Similarly, results can be run to
   show the relative contributions of various energy efficiency policies, including those for new and
   existing building stock, electricity and gas, and renewables, towards reductions in energy use.

                Figure 5. Example of GHG emissions results chart showing the progressive impacts of land
                use and the application of transportation, building energy, and energy portfolio policies.

   Working with Analysis Results
           UrbanFootprint produces results for energy use and its related costs and GHG emissions.
   When comparing land use scenarios against each other, generally the same policy set is applied
   to each to focus on the impacts of land use. (By contrast, applying different policy sets to a single
   scenario serves to focus on the impacts of policy variables.) Results can be expressed in a
   number of ways: residential and commercial energy can be added together or reported
   separately; electricity and natural gas use can be added together or reported separately; or results
   can be expressed as scenario totals, or averaged per household or employee.
           Figure 6 shows an example of how the building energy results of two regional scenarios,
   Business as Usual and Compact Future, could be communicated in the context of a range of
   scenario results. This type of presentation, which was used for the Vision California project,
   exemplifies the use of bar charts to summarize scenario metrics and convey them to decision
   makers and the public. This approach is applicable when the primary focus is on land use, rather
   than specific policies for energy efficiency. To focus on policy, results for individual scenarios
   analyzed using different policy sets can be presented.

©2014 ACEEE Summer Study on Energy Efficiency in Buildings                                                   10-102
Figure 6. Sample of scenario results report that compares results for two scenarios.
To focus more closely on the effects of variations in land use and energy policy, users
can go farther in applying assumptions (varying them by building type or climate zone, for
example) and in querying results. With further input and subsequent model advancement
(planned to occur as a component of project work with CEC), calculations and visualizations
could be performed from within the UrbanFootprint user interface, allowing users to dynamically
evaluate the impacts of varying policies as applied to land use scenarios.
Currently, spreadsheet and GIS-based analysis is performed outside the model using data
exported into comma-separated value (CSV) or geodatabase (GDB) format. Using
UrbanFootprint’s SQL query functionality, users have the ability to isolate or aggregate results as
needed. Figure 7 shows sample visualizations, produced using ArcGIS, which make use of
exported data. The maps show estimated base-year energy use in the San Diego region, with the
unit of analysis being the census block-based Master Geographic Area (MGRA) used by
SANDAG. The map at left normalizes total energy use by developed acre, while the map at right
normalizes residential energy use by household. The color ramps range from green at the low
end to red at the high end. While a number of factors contribute to the patterns seen in these
maps, they exemplify different ways of understanding and communicating the relationships
between existing urban form and energy use. Viewing energy use per developed acre shows the
link between development density and energy use, while viewing residential energy use per
household shows the combined effects of climate and residential development types and their
implications for the location and form of future growth. Applying policy-based assumptions to
©2014 ACEEE Summer Study on Energy Efficiency in Buildings 10-103growth scenarios and performing the same visualizations would reveal the potential effects of
targeted policy over time.
Figure 7. Maps showing base-year energy use per acre (left) and per household (right) in the
San Diego region. Color ramps range from green (low) to red (high).
UrbanFootprint Energy Analysis for Land Use Planning and Energy Policy
Development: Future Development and Applications
The evolution of UrbanFootprint is ongoing, with features and analysis methodologies
being advanced as needs are identified and development support is made available. The most
significant anticipated advancements to the model’s building energy analysis component will be
undertaken to support CEC in their work to implement AB 758, which requires CEC to develop
and implement a comprehensive program to achieve greater energy savings in the state’s existing
residential and nonresidential building stock. Through this work, CEC will leverage the land use
modeling, analysis, and visualization capacities of UrbanFootprint, and work with Calthorpe
Associates and their MPO partners to improve both the baseline assumptions and the potential
impacts of energy efficiency and distributed generation policies on building energy usage within
a land use context.
As model and data development continue, further opportunities for cross-agency
collaboration are likely to arise – for example in more explicitly linking the impacts of energy
and water efficiency policies on energy and water use and emissions. UrbanFootprint may also
see increased use for local land use planning, building in particular on its capacity to support
streamlined data sharing and collaboration with regional planning agencies. UrbanFootprint is
also an ideal fit for regional and local climate action planning efforts, which can incorporate land
use and transportation planning as well as localized energy policies and targets.
©2014 ACEEE Summer Study on Energy Efficiency in Buildings 10-104References
California Energy Commission. 2006. California Commercial End-Use Survey (CEUS).
Sacramento: CEC.
California Energy Commission. 2010. California Statewide Residential Appliance Saturation
Survey (RASS). Sacramento: CEC.
EIA (Energy Information Administration). 2014. www.eia.govtools/faqs/faq.cfm?id=105&t=3.
Washington, D.C.: U.S. Energy Information Administration.
EIA (Energy Information Administration). 2011. Natural Gas Annual 2011. Table A1. Accessed
from www.eia.gov/naturalgas/annual/pdf/table_a01.pdf.
Lincoln Institute of Land Policy. 2012. Opening Access to Scenario Planning Tools. Cambridge,
MA: Lincoln Institute.
©2014 ACEEE Summer Study on Energy Efficiency in Buildings 10-105You can also read