Suzlon Energy Limited - 9M FY19 07 February 2019
←
→
Page content transcription
If your browser does not render page correctly, please read the page content below
Suzlon Energy Limited
                          9M FY19

                          07 February 2019

SECI-1 Sembcorp Project
Disclaimer

    •    This presentation and the accompanying slides (the “Presentation”), which have been prepared by Suzlon Energy Limited (the “Company”), have been
         prepared solely for information purposes and DOES not constitute any offer, recommendation or invitation to purchase or subscribe for any securities, and
         shall not form the basis of or be relied on in connection with any contract or binding commitment whatsoever. The Presentation is not intended to form the
         basis of any investment decision by a prospective investor. No offering of securities of the Company will be made except by means of a statutory offering
         document containing detailed information about the Company.
    •    This Presentation has been prepared by the Company based on information and data which the Company considers reliable, but the Company makes no
         representation or warranty, express or implied, whatsoever, and no reliance shall be placed on, the truth, accuracy, reliability or fairness of the contents of this
         Presentation. This Presentation may not be all inclusive and may not contain all of the information that you may consider material. Any liability in respect of
         the contents of or any omission from, this Presentation is expressly excluded. In particular, but without prejudice to the generality of the foregoing, no
         representation or warranty whatsoever is given in relation to the reasonableness or achievability of the projections contained in the Presentation or in relation
         to the bases and assumptions underlying such projections and you must satisfy yourself in relation to the reasonableness, achievability and accuracy thereof.
    •    Certain matters discussed in this Presentation may contain statements regarding the Company’s market opportunity and business prospects that are
         individually and collectively forward-looking statements. Such forward-looking statements are not guarantees of future performance and are subject to known
         and unknown risks, uncertainties and assumptions that are difficult to predict. These risks and uncertainties include, but are not limited to, the performance of
         the Indian economy and of the economies of various international markets, the performance of the wind power industry in India and world-wide, the
         Company’s ability to successfully implement its strategy, the Company’s future levels of growth and expansion, technological implementation, changes and
         advancements, changes in revenue, income or cash flows, the Company’s market preferences and its exposure to market risks, as well as other risks. The
         Company’s actual results, levels of activity, performance or achievements could differ materially and adversely from results expressed in or implied by this
         Presentation. The Company assumes no obligation to update any forward-looking information contained in this Presentation. Any forward-looking statements
         and projections made by third parties included in this Presentation are not adopted by the Company and the Company is not responsible for such third party
         statements and projections.
    •    No responsibility or liability is accepted for any loss or damage howsoever arising that you may suffer as a result of this Presentation and any and all
         responsibility and liability is expressly disclaimed by the Management, the Shareholders and the Company or any of them or any of their respective directors,
         officers, affiliates, employees, advisers or agents.
    •    No offering of the Company’s securities will be registered under the U.S. Securities Act of 1933, as amended (the “Securities Act”). Accordingly, unless an
         exemption from registration under the Securities Act is available, the Company’s securities may not be offered, sold, resold, delivered or distributed, directly or
         indirectly, into the United States or to, or for the account or benefit of, any U.S. Person (as defined in regulation S under the Securities Act).
    •    The distribution of this document in certain jurisdictions may be restricted by law and persons into whose possession this presentation comes should inform
         themselves about and observe any such restrictions. Any failure to comply with these restrictions may constitute a violation of the laws of such jurisdiction.

2
Industry Poised For Huge Growth

            10.7 GW                                                ~34 GW                                         ~44 GW
      Capacity auctioned till date                           Bidding expected by 2022                            Auctions by 2022

                                         Will lead to

    Year                       FY20             FY21           FY22           Total            FY19 estimated
                                                                                                                          2022 Target
                                                                                                installed base
    Turbine Supply            11 GW            12 GW          12 GW          35 GW

                                                                                                ~36 GW                    67 GW
    Commissioning              8 GW            11 GW          12 GW         31 GW
Source: Internal estimates

                             Government pushing industry to achieve its 67 GW target for wind by 2022

3                                    Volumes to significantly grow over the next three years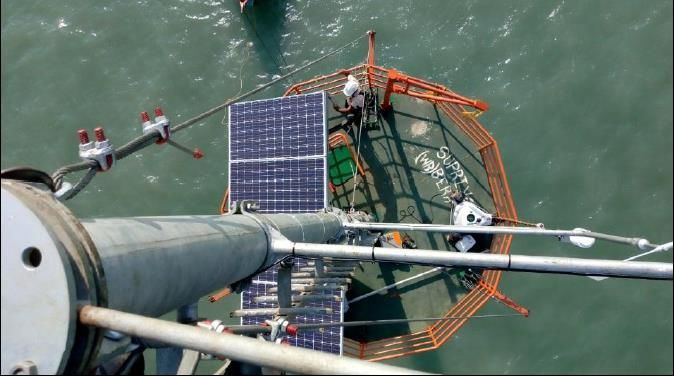
FY20 Onwards: Strong Uptick In Volumes

                                                 FY18 and FY19:                                        FY20 and FY21:
                                              High bidding activity                              High commissioning activity
                                                                                                                       11.0
      (GW)
                                                              +45%

                                                               7.6                                       8.0

                  5.5                           5.5            2.4

                                                               5.2                         2.0

               FY17 FiT                     Upto FY18*      9M FY19                       FY19          FY20          FY21
             Commissioning
                                                                               Strong commissioning outlook for FY20 & FY21
                                              Transition to auctions
                                                                               • 21 months execution timeline for auctioned projects
                                         39% Growth in YTD FY19 auctions
                                                                               • 7.7GW auctioned in last 12 months
                                                                               • Connectivity granted for completed bids
         Auctions Announced
                                                                               • Approval process initiated for state PPAs
         Auctions Concluded

    * Includes 1GW auctioned in Feb’17

4                                          Long term outlook remains bullish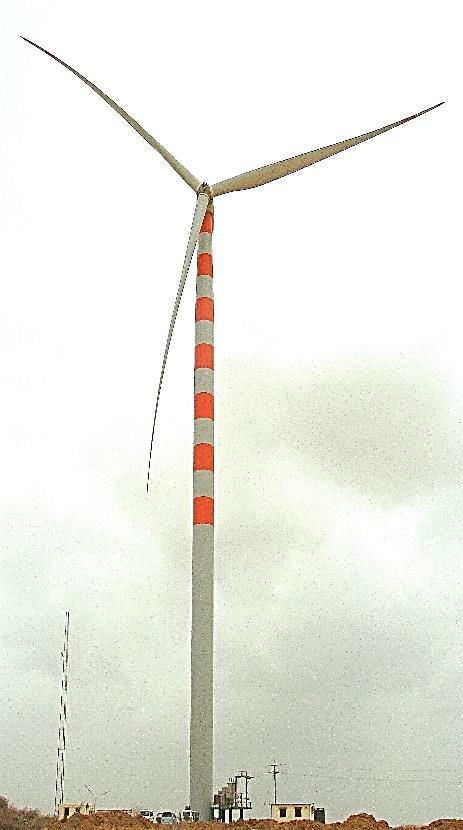
Traction In Auctions In FY19
SECI 6
FY18
Feb’17 SECI 4 NTPC SECI 5 Hybrid 1 1.2 GW
auctions
1.0 GW 2.0 GW 1.2 GW 1.2 GW 0.8 GW Bid
4.5 GW
submission
Feb’17 FY18 Apr’18 Aug’18 Sep’18 Dec’18 Feb’19
Deliveries 5.2 GW Auctions Concluded in 9M FY19
Commissioning 2,350 MW bids
commenced
commenced submitted
for SECI 2
Initial teething issues in Gujarat, getting resolved 1.2 GW Hybrid 2:
Announced
~5.5 GW of the 10.7 GW auctioned capacity coming up in Gujarat
Land earmarked for wind and wind-solar hybrid projects auctioned by centre and state
Earmarked land for ~30 GW of which ~20 GW will be for central projects
Eases execution for future large scale inter-state wind projects
5 ~30% of the concluded auctions is yet to close orders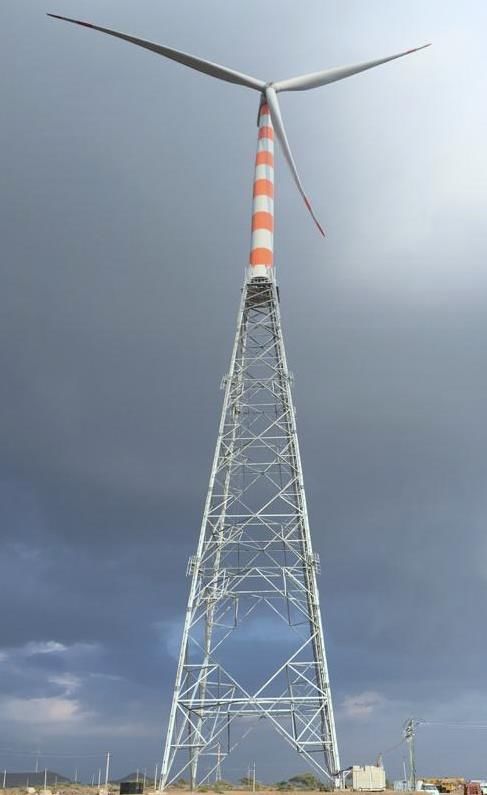
Largest Order Volume Share In Auctions Concluded Till Date

      Auction Wise Order Wins for Suzlon (MW)

                                                                                                                   1,740
                                                                                               202
                                                                             285
                               Deliveries
           Fully                Ongoing                 752
        commissioned

                                  252
            250
            SECI I               SECI II              SECI III              SECI IV         State Bids             Total

            → ~23% of auctioned and tied up orders

            → Top Quality Customer Profile: Orders from marquee Utility and IPP Companies

                  Around 30% of 10.7 GW auctioned capacity is still open in market – Incremental Potential for Suzlon

6                                           Zero reliance on self bidding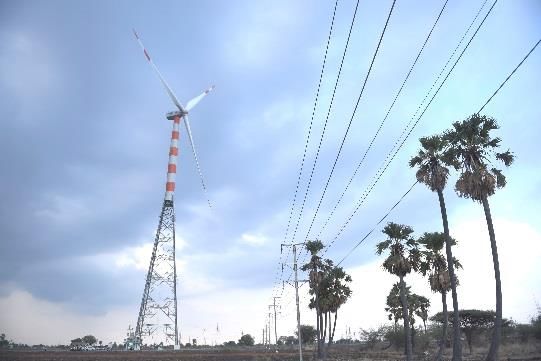
Wind Solar Hybrid Gaining Momentum

               1st Wind Solar Hybrid Auction Concluded                Key Positives of Wind Solar Hybrid
                                                                      •   Efficient utilisation of transmission infrastructure and land
            Auction Date                        Bid Capacity          •   Reduce variability in renewable power generation
                                                                      •   Improved grid stability
          5th Dec 2018                          840 MW
                                                                      Project Specs
                                                                      •   Min 200 MW; Max 600 MW

          Tariff Discovered                 Commissioning Date        •   Either component to be >25% of rated capacity of other
                                                                          component
      Rs. 2.67-2.69/unit                 18 months from PPA           •   Effective capacity utilisation factor to be >30%

    Andhra Pradesh Wind Solar Hybrid Policy 2018                      Maharashtra Wind Solar Hybrid Tender
    • Target to add 5 GW over the next five years                     • 25 year PPA with tariff ceiling of Rs 2.75 / unit
    • Project to achieve minimum CUF of 40%                           • Minimum 100 MW by single bidder
    • No additional connectivity charges for hybridisation of         • Max bid capacity quoted will be seized as bid capacity
      existing wind or solar projects                                 • Land of 277.32 hectares identified
    • 100% banking permitted                                          • Declared effective CUF shall not be less than 20.5%
    • Must run status accorded to wind solar hybrid projects          • Bid submission date: 22nd Feb 2019

7                                       1.2 GW second hybrid tender announced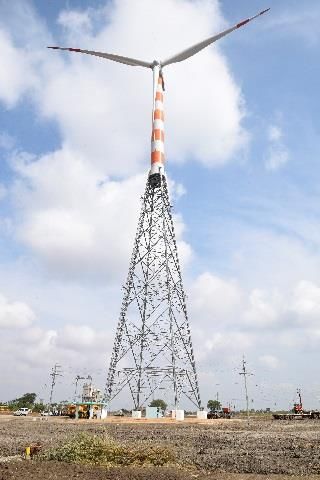
Suzlon Only Player To Commission Entire SECI-1 Project

                                                     •    Commissioned 1st SECI-1 project despite initial challenges

                                                     •    Delivered 6 months ahead of revised schedule

                                                     •    Provide comprehensive O&M services for entire project life

                                                     Customer                            Sembcorp Energy India

                                                     Project Size                        250 MW

                                                     Project Scope                       Full Scope Turnkey Solution

                                                     State                               Tamil Nadu

                                                     Auction Date                        Feb’17

                                                     PPA Signing Date                    July ’17

                                                     Commissioning Date                  Oct ’18

                                                     Turbine Model                       S111-120

                                                     Total Area                          252 sq km

                                  Progressing well on other auction projects

8                       Superior execution capabilities demonstrated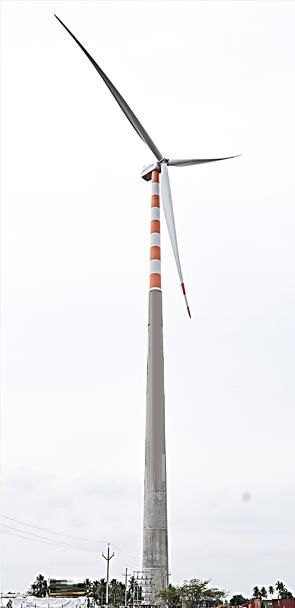
FY19 Debt Reduction Target

                   Debt Reduction Target                         30% - 40%

                           Plan to reduce debt through strategic initiatives

                  Medium to long term outlook for wind continues to remain positive

9                               Committed to reduce debt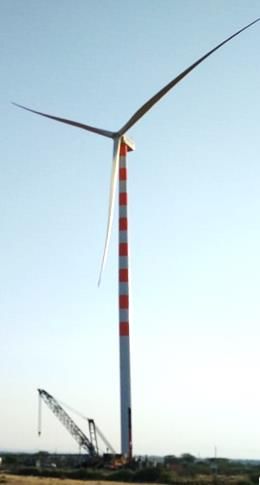
Financial Performance   Debt Overview      Industry Outlook

          Technology         Suzlon Strengths   Detailed Financials

10
Q3 FY19 Financial Highlights
(₹ Cr.)
Q3 FY19 Q3 FY18
Particulars Remarks
Unaudited Unaudited
Net Volumes (MW) 67 316
Net Revenue 1,091 2,187
Gross Profit 484 668
Primarily due to revenue mix
Gross Margin 44.3% 30.5%
Employee Expenses 219 193
Other Expenses (net) 193 228
EBITDA (Pre FX) 73 247
Primarily due to lower operating leverage
EBITDA Margin (Pre FX) 6.7% 11.3%
Depreciation 82 79
Primarily due to:
Net Finance Cost 320 308
• Prepayment charge on Solar project debt closure
Taxes (11) 1
Share of (Profit) / Loss of Associates / JV 1 (16)
Net Profit (Pre Fx and Ex. Items) (321) (125)
Primarily
Exchange Loss / (Gain) (220) (97) • Translational impact
• Non cash in nature
Exceptional Loss / (Gain) (61) 5
Reported Net Profit (40) (33)
Non Controlling Interest (2) (5)
Net Profit attributable to Shareholders (38) (28)
119M FY19 Financial Highlights
(₹ Cr.)
9M FY19 9M FY18
Particulars Remarks
Unaudited Unaudited
Net Volumes (MW) 349 844
Net Revenue 3,557 5,909 Primarily due to low volume
Gross Profit 1,512 2,197
Primarily due to revenue mix
Gross Margin 42.5% 37.2%
Employee Expenses 625 602
Other Expenses (net) 622 765 Includes partly variable cost
EBITDA (Pre FX) 265 829
Primarily due to lower operating leverage
EBITDA Margin (Pre FX) 7.4% 14.0%
Depreciation 255 240
Primarily due to:
Net Finance Cost 944 897 • Prepayment charge on Solar project debt closure
• Lower finance income
Taxes (16) 2
Share of (Profit) / Loss of Associates / JV 5 9
Net Profit (Pre Fx and Ex. Items) (922) (319)
Primarily
Exchange Loss / (Gain) 382 44 • Translational impact
• Non cash in nature
Exceptional Loss / (Gain) (61) (450)
Reported Net Profit (1,243) 86
Non Controlling Interest (8) (3)
Net Profit attributable to Shareholders (1,235) 89
12 Transition period impacting financialsConsistent Reduction In Net Working Capital
Fig. in ₹ Cr.
3,543
-1,877 Working Capital to optimize under Auction regime
2,780
2,401 • Reduced regulatory uncertainty
1,999
• Elongated execution schedule
1,667
• Smoothened out quarterly volumes
• Large scale project size
• Make to Order
Q3 FY18 Q4 FY18 Q1 FY19 Q2 FY19 Q3 FY19
13 Focused on optimizing working capitalStable Service Revenue Insulated From Business Cycles
Operations and Maintenance Revenues (₹ Cr.) ~15 GW of Assets under Management (AUM)
+6.7%
― 12+ GW in India; ~3 GW Overseas
1,429
1,340 89
Internal 111 +9.1% ― 2nd Largest O&M player in India Power Sector, after NTPC
Nearly 100% renewal track record in India
1,340 ― Almost all turbine sold by us in India are under our Service fold
External 1,229
― Custodian of 12+ GW of assets in India
― 23 years of track record in India
9M FY18 9M FY19
External OMS revenue is 38% 9M FY19 revenue
14 Annuity like business; Steady cash generationLargest Backlog In India Wind Industry
Particulars Capacity Remarks
Central Auctions 1,073 MW
All orders backed by signed PPA’s
State Auctions 183 MW
Retail, Captive, PSU & IPP 123 MW Backed by advance, Not dependent on PPAs
Wind Firm Order Book 1,379 MW
~2.1 GW Backlog
Value of Order Book ₹7,749 Cr.
Framework Agreements / PPA in hand >700 MW PPA Signed, Ratification Awaited
Letter of Intent (LOI) ~100 MW Contract finalisation in progress
SEFL and Service orders over and above this order book
15 ~30% of the auctioned capacity is yet to be tied upFinancial Performance Debt Overview Industry Outlook
Technology Suzlon Strengths Detailed Financials
16Term Debt Profile
(Excl. FCCB) 31st Dec’18 30th Sep’18 Back Ended Maturity Profile
(₹ Cr.)
US$ 569 M US$ 569 M 64%
SBLC Backed AERH Loans
(₹ 3,958 Crs.) (₹ 4,110 Crs.) 4,515
Change only due to FX; No change in US$ value
US$ 61 M US$ 64 M FY19-22 Repayments: 36%
Other FX Term Debt
(₹ 427 Crs.) (₹ 460 Crs.)
836 927
639
156
Rupee Term Debt ₹ 2,688 Cr. ₹ 2,772 Cr.
FY19 FY20 FY21 FY22 FY23 &
Beyond
Gross Term Debt ₹ 7,073 Cr. ₹ 7,343 Cr.
Net Term Debt ₹ 6,424 Cr. ₹ 6,803 Cr.
Working Capital Debt ₹ 3,354 Cr. ₹ 3,395 Cr.
17 Focused on Debt Reduction
Note: 1 US$ = ₹ 69.78 for Q3 FY19; Ind AS impact is captured in the Gross Term Debt total in ₹ CR.July 2019 FCCB Series Overview
(US$ Mn)
FCCB Principal Value
547
No. of Shares (Crs.)
Current Outstanding 532
Pending Conversion 67
375 Post Full Conversion 599
(₹ 1,234 Cr.*)
172
Conversion Details
Price (Per Share) ₹ 15.46
Exchange Rate ₹ 60.225
Jul’14 Conversions Till Dec’18 Dec’18
18 69% FCCBs already converted till date
Note: 1 US$ = ₹ 69.78; *Numbers post impact of Ind-ASFinancial Performance Debt Overview Industry Outlook
Technology Suzlon Strengths Detailed Financials
19Strong Visibility On Growth For India Wind Market
Feed-in-Tariff + Captive / PSU / Retail Auction + Captive / PSU / Retail
10.6 GW commissioned in last 3 years 21.0 GW commissioning in next 3 years
(MW) 11,000
8,000
5,502
3,415
1,766 2,000
FY16 FY17 FY18 FY19E FY20E FY21E
Source: MNRE Source: Internal Estimates
Key Drivers: Key Challenges:
Increasing power demand with supply only from renewables X Infrastructure constraints
Push for clean, affordable and scalable power source X Auction delays & sector uncertainties
Wind most competitive source of power in India
Large untapped potential
Auction based procurement
‒ Market expanding from 8 wind states to pan India
‒ Making wind subsidy free
Unlocking emerging areas potential
‒ Wind solar hybrid, offshore, repowering
20 Poised to become high growth marketPoised To Become A 10+ GW Annual Market
India Annual Wind Market Potential Size and Segmentation
10 – 12 GW
8 – 10 GW
1 - 2 GW
1 GW
Central Auctions State Auctions Captive / PSU / FiT Total Annual Market
“India plans to auction 10 GW of wind energy for the next 10 years”, MNRE Secretary, Anand Kumar
Power Grid working on creation of transmission infrastructure
• Increasing inter-regional capacity
Laying new high capacity lines
Upgrading exiting substation facilities
• Work commenced on connecting southern, western and northern regions
• KfW Development Bank and Asian Development Bank to finance these projects
21 Sustainable volume addsNearing The End Of Transition Phase
Parameter Upto FY17 Apr’17 – Mar’19 FY20 and Onwards
PPA Mechanism Feed-in-Tariff Competitive Bidding
Wind Tariff ₹ 4.0 – 5.0 /unit ₹ 2.5 – 3.0 /unit
Transition from FiT to Auction
Annual Market Size 3 – 4 GW 10 – 12 GW
impacted turbine sales due to
Order Book Coverage 3 – 6 months 12 months
no clarity on PPA, initial
Execution Timeline 6 – 9 months 18 – 21 months
teething issues in execution
Commissioning Back-ended, Q4 heavy Equally spread
Project Size 50 – 100 MW 200 – 300 MW
Aspects supporting tariffs in competitive bidding
Pan India Demand Technology Reduced Regulatory Risk
Newer turbines offer better yield, Upfront signing of PPAs and tariff
Wind + Non Wind States
Lower LCoE determination
22 Favourable macro environment for acceleration in capacity additionOther Emerging Opportunities For Growth
Offshore
• National offshore policy already notified
1 GW • Suzlon has commissioned 1st Offshore Met Station
2018
(Expression of Interest)
• Offshore Advantage: Higher PLF due to high wind power density and shallow water
2022 Target 5 GW
depth enables lower cost in terms of project execution
2030 Target 30 GW
• 35 participants evinced interest for 1 GW Expression of Interest
Repowering
• Policy already announced and notified in 2016
• Repowering is replacing old technology low capacity wind turbines with the latest large
3 GW
sized wind turbines
Estimated Potential
• Govt. keen on harnessing this potential and working on right set of policies incentivizing
of < 1,000 kw turbines
Repowering
23 Emerging high growth areasFinancial Performance Debt Overview Industry Outlook
Technology Suzlon Strengths Detailed Financials
24S120: Four Variants Launched
S120 – 140 HLT S120 – 140 HCT S120 – 120 STT S120 – 105 TT
(Dec ‘18) (Sep ‘18) (Jan ‘19) (Jun ‘18)
Hybrid Lattice Tower Hybrid Concrete Tower Smart Tubular Tower Tubular Tower
Reduces LCoE and improves ROI for customers
~900 MW orders already booked
25 Enables us to reach untapped wind sites in challenging terrainsFocus On Reducing LCOE
Higher energy yield Lower cost of energy Sustains Lower Tariffs
>70% Increase in Energy Yield
S97-120 S128
S111-90 S111-120 S111-140 S120
2.6-2.8 MW
Proto at 105m
commissioned in Jan’18
26 Over 4,500 turbines of 2.1 MW platform across 17 countriesPioneer In India Offshore
Support Platform Offshore LiDAR
• India’s 1st Private Far Offshore Met Station
‒ Opportunity to harness India’s 7,600km coastline
‒ Government plans to auction 5 GW of Offshore project next year
• State of Art Installation
‒ 16km from the Shore
Powered Through Solar ‒ 11m Water depth
‒ 14m support platform height above water level
‒ LiDAR based met station
‒ Remote monitoring
27 Strong capabilities in offshoreGlobal In-House R&D Capabilities
Suzlon Technology Locations:
Hamburg
- Development & Integration
Hamburg
- Certification
Germany Rostock
- Development & Integration
Rostock - Design & Product Engineering
- Innovation & Strategic Research
Hengelo
The Netherlands Hengelo - Blade Design and Integration
- Design & Product Engineering
- Turbine Testing & Measurement Pune
Pune
- Technical Field Support
- Engineering
India
Vadodara - Blade Testing Center Aarhus
Chennai - Design & Product Engineering (Gear Box Team)
Aarhus - SCADA Vejle
Denmark
Vejle - Blade Science Center
28 Best match between skills & location – Efficient leverage of R&D spendingFinancial Performance Debt Overview Industry Outlook
Technology Suzlon Strengths Detailed Financials
29Suzlon Strengths In India Wind Market
Full Turnkey Solution
Pan India Presence
Provider
Technology Leadership Strong Customer Relationship
Best In Class Service 23+ Years Track Record
Capabilities
30 End-to-end service provider with strong presence across value chain & customer segments18+ GW Global Installations
(GW)
Global mix India cumulative installed base
Africa Europe
Australia
0.1 11.9 12.4
0.5
11.3
0.8 Americas 9.5
8.2 8.6
3.6 7.4 7.8
1.0
Asia (ex-India)
12.4
India
Upto FY13 FY14 FY15 FY16 FY17 FY18 9M
FY12 FY19
Strongly positioned in India market
Presence across all
1,700+ customers across all 7 R&D facilities spread across
9 states in India segments 4 countries
India Market Share
(Cumulative Capacity) Successfully maintained 97+% fleet
availability
35%
31 12+ GW milestone achieved in IndiaAccolades
World’s 1st solar project quality certification for Suzlon’s 100 MW project
• Certificate from DNV GL confirms safety features and technical compliance
• Testament of our commitment to high quality standards
CII Southern Region's 13th Kaizen Competition
• Suzlon's Coimbatore Generator Unit wins award, Competing against 100 companies
• For uniform profile of copper bar with higher productivity, achieving best quality level
Suzlon’s Generator Unit wins award at Manufacturing Today Summit
• Won the Quality Improvement Project competition on Cost Optimization
• Evaluated across cost optimization, quality, technology, safety and sustainability
SKOCH Corporate Excellence Silver Award
• SB63 Full Carbon Girder Blade, Felicitated with Order of Merit certificate for S128
• Award for Innovative two fold transport system: Telescopic Trailer and Rotor Blade Adapter Trailer
OMS Team Wins IMC RBNQA 2018 – A Symbol Of Business Performance Excellence
• 1st prize for SGSL in the service category is a recognition of high service standards
• Assessment criteria similar to Malcolm Baldrige, USA; 360 degree evaluation including interactions with all stakeholders
Suzlon bags ICERP – JEC Innovation Award as “Outstanding Innovation in Composites”
• Awarded by FRP Institute, India and JEC Composites, France
• Testament of Suzlon’s innovation in nacelle cover composites structure
32 Testament to our focus on quality and technology~12 GW Wind Energy Installations In India
Ranked No. 1 in Renewables Sector
Largest fleet under Operation and Maintenance fold in India
Ranked No. 2 in Power Sector
(31st Mar’18) # of Turbines MW
1 MW < 2 MW 4,268 5,774
=>2 MW 2,557 5,368
Total 8,503 11,919
2.0 GW
• 35% - All India installed wind capacity
2.5
GW 0.4 GW • ~17% - All India installed renewable capacity
• ~1,800 customer relationships
2.1 GW
0.1 • 22 years of operating track record
GW
1.6 • 26 TWh estimated of annual clean energy;
1.0G
W GW =2,125 mn trees planting p.a.
2.2 =~19.3 mn tonnes coal avoidance p.a.
GW =~25.5 mn tonnes CO2 emission savings p.a.
33 Custodian of 2nd highest installed power capacity (from all sources) in India
Map not to scale. All data, information, and map is provided “as is” without warranty or any representation of accuracy, timeliness or completeness.Suzlon’s Global Presence
As on 31st Dec 2018
2 5
2 1
North
6
America 3 1
2,779 MW 4
Asia
3 5 13,332 MW
South America Europe
806 MW 508 MW 4
South
Australia
Africa
764 MW
139 MW
6
34 Suzlon’s strong relationships across regions positions it well
Map not to scale. All data, information, and map is provided “as is” without warranty or any representation of accuracy, timeliness or completeness.USA PTC Volume: ~500 MW Pipeline Created For 100% PTC Projects
Production Tax Credit (PTC) Extension: Huge Volume Opportunity
• PTC in USA extended until 2019 with benefits stepping down every year before phase out
• In order to qualify, projects only need to start construction and make a minimum 5% investment
(“Safe Harbour Investments”)
• Thus projects which meet safe harbour investments in 2016, will be eligible for 100% PTC benefit, while projects which meet
safe harbour investments in 2017 will be eligible for 80% PTC benefit
• Timeline for completion of the projects is 4 years from the start of construction
Start Construction/Safe Harbor Timeline for Completion
Suzlon Strategy
100% PTC
2016 2020 • Established SPVs to implement Safe Harbor Projects and
develop project pipeline
80% PTC
2017 2021
• ~500 MW Pipeline created of projects eligible for 100%
60% PTC PTC
2018 2022
• To translate into firm orders for execution over the next
40% PTC couple of years
2019 2023
35 Re-entering international marketFinancial Performance Debt Overview Industry Outlook
Technology Suzlon Strengths Detailed Financials
36Consolidated Income Statement
(₹ Cr.)
9M FY19 9M FY18 FY18
Particulars
Unaudited Unaudited Audited
Revenue from operations 3,557 5,909 8,075
Less: COGS 2,046 3,712 5,116
Gross Profit 1,512 2,197 2,959
Margin % 42.5% 37.2% 36.6%
Employee benefits expense 625 602 805
Other expenses (net) 622 765 1,006
Exchange Loss / (Gain) 382 44 146
EBITDA (117) 785 1,003
EBITDA (Pre-FX Gain / Loss) 265 829 1,149
Margin % 7.4% 14.0% 14.2%
Less: Depreciation 255 240 342
EBIT (371) 545 661
EBIT (Pre-FX Gain / Loss) 10 589 807
Margin % 0.3% 10.0% 10.0%
Net Finance costs 944 897 1,502
Profit / (Loss) before tax (1,315) (353) (840)
Less: Exceptional Items Loss / (Gain) (61) (450) (450)
Less: Share of (Profit) / Loss of Associates & JV 5 9 (5)
Less: Taxes (16) 2 (2)
Net Profit / (Loss) after tax (1,243) 86 (384)
Less: Non-Controlling Interest (8) (3) (7)
Net Profit Attributable to Shareholders (1,235) 89 (377)
37Consolidated Net Working Capital
(₹ Cr.)
31st Dec’18 30th Sep’18 31st Dec’17
Inventories 3,233 3,151 3,590
Trade receivables 1,925 2,297 3,565
Loans & Advances and Others 1,962 1,889 1,923
Total (A) 7,120 7,336 9,078
Sundry Creditors 2,966 2,902 2,515
Advances from Customers 1,138 992 1,505
Provisions and other liabilities 1,349 1,444 1,515
Total (B) 5,453 5,337 5,534
Net Working Capital (A-B) 1,667 1,999 3,544
38Key Accounting Policies – Revenue Recognition And Order Booking
Opening Order Book
• Sales (WTG Revenue Recognition)
(-) Sales during the period ‒ WTG revenue is based on satisfaction of performance obligation whereby revenue for
WTG equipment is recognised on dispatch of WTG and revenue for BoP is recognised on
completion of relevant milestones
• Order Intake during the period
(+) Order Intake during the period
‒ Only orders backed by certainty of PPAs
• Closing Order Book
Closing Order Book
‒ Represents MW value of contract against which no revenue is recognized in the income
statement
39 Adherence to best accounting and reporting practicesKey Accounting Policy: Maintenance Warranty Provisions
Maintenance Warranty Provisions
Accounting Policy:
― Comprise of provisions created against maintenance warranty issued in connection with WTG sale
Created when revenue from sale of wind turbine is recognized
― Provisions estimated based on past experience
― Reversals of unused provision on expiry of Maintenance warranty period
Global Wind Industry Standard Practice:
― Followed by top listed global industry leaders
― Despite Insurance and back to back warranty from suppliers
40 Adherence to best accounting and reporting practicesCIN of Suzlon Energy Ltd - L40100GJ1995PLC025447
THANK YOU
41You can also read