Suzlon Energy Limited - Q1 FY19 04 August 2018 - MarketScreener.com
←
→
Page content transcription
If your browser does not render page correctly, please read the page content below
Suzlon Energy Limited
Q1 FY19

04 August 2018
Disclaimer

    •    This presentation and the accompanying slides (the “Presentation”), which have been prepared by Suzlon Energy Limited (the “Company”), have been
         prepared solely for information purposes and DOES not constitute any offer, recommendation or invitation to purchase or subscribe for any securities,
         and shall not form the basis of or be relied on in connection with any contract or binding commitment whatsoever. The Presentation is not intended to
         form the basis of any investment decision by a prospective investor. No offering of securities of the Company will be made except by means of a
         statutory offering document containing detailed information about the Company.
    •    This Presentation has been prepared by the Company based on information and data which the Company considers reliable, but the Company makes
         no representation or warranty, express or implied, whatsoever, and no reliance shall be placed on, the truth, accuracy, reliability or fairness of the
         contents of this Presentation. This Presentation may not be all inclusive and may not contain all of the information that you may consider material. Any
         liability in respect of the contents of or any omission from, this Presentation is expressly excluded. In particular, but without prejudice to the generality of
         the foregoing, no representation or warranty whatsoever is given in relation to the reasonableness or achievability of the projections contained in the
         Presentation or in relation to the bases and assumptions underlying such projections and you must satisfy yourself in relation to the reasonableness,
         achievability and accuracy thereof.
    •    Certain matters discussed in this Presentation may contain statements regarding the Company’s market opportunity and business prospects that are
         individually and collectively forward-looking statements. Such forward-looking statements are not guarantees of future performance and are subject to
         known and unknown risks, uncertainties and assumptions that are difficult to predict. These risks and uncertainties include, but are not limited to, the
         performance of the Indian economy and of the economies of various international markets, the performance of the wind power industry in India and
         world-wide, the Company’s ability to successfully implement its strategy, the Company’s future levels of growth and expansion, technological
         implementation, changes and advancements, changes in revenue, income or cash flows, the Company’s market preferences and its exposure to market
         risks, as well as other risks. The Company’s actual results, levels of activity, performance or achievements could differ materially and adversely from
         results expressed in or implied by this Presentation. The Company assumes no obligation to update any forward-looking information contained in this
         Presentation. Any forward-looking statements and projections made by third parties included in this Presentation are not adopted by the Company and
         the Company is not responsible for such third party statements and projections.
    •    No responsibility or liability is accepted for any loss or damage howsoever arising that you may suffer as a result of this Presentation and any and all
         responsibility and liability is expressly disclaimed by the Management, the Shareholders and the Company or any of them or any of their respective
         directors, officers, affiliates, employees, advisers or agents.
    •    No offering of the Company’s securities will be registered under the U.S. Securities Act of 1933, as amended (the “Securities Act”). Accordingly, unless
         an exemption from registration under the Securities Act is available, the Company’s securities may not be offered, sold, resold, delivered or distributed,
         directly or indirectly, into the United States or to, or for the account or benefit of, any U.S. Person (as defined in regulation S under the Securities Act).
    •    The distribution of this document in certain jurisdictions may be restricted by law and persons into whose possession this presentation comes should
         inform themselves about and observe any such restrictions. Any failure to comply with these restrictions may constitute a violation of the laws of such
         jurisdiction.

2
FY19 Outlook: Another Challenging Year

       Outlook at FY18 end                  Transitional Delays                  6-9 months for stabilization

                                                                               May’18: CERC released connectivity
                                                                               procedure
                                      Evacuation approval delays in
                                      completed bids
    7.5 GW auctions concluded                                                  Jul’18: Connectivity granted to
                                                                               completed bids backlog
                                      Bids in pipeline temporarily deferred

                                                                               10+ GW bids lined up for auctions

    Visibility on few state PPAs    Approvals awaited for state PPAs          Approval process initiated

3              Short term pain, however long term outlook continues to remain bullish
Bidding Delays: Elongation Of Transition Phase

                                                Original Bid
        Auction Pipeline    MW      RfS Date                                           Revised Bid Date
                                                   Date

                                                  May ’18                           June’18 (EOI submission)
    Offshore (EOI)         1,000    April ’18
                                                 (EOI Date)                         Bid date to be Announced

                                                                                         Cancelled;
    Gujarat II             1,000     Feb ’18      June ’18
                                                                                   New Bid to be Announced

    NTPC                   1,200     Mar ‘18      June ’18                                 6th Aug ’18
                                                               Transitional
                                                                              Low Participation from Industry due to
                                                                 Delays
                                                                                    connectivity uncertainty
    SECI V                 2,000    May ’18       July ’18
                                                                                       Next steps awaited

    Wind-Solar Hybrid      2,500    June ’18      Aug ’18                               To Be Announced

    Wind in Existing                              To Be
                           1,000                                                        To Be Announced
    Solar Farms                                 Announced

                                                  To Be
    SECI VI                2,500    June ’18                                            To Be Announced
                                                Announced

    •     Postponement of bid submission due to evacuation uncertainty

    •     Regulatory framework now easing - Completed bids connectivity granted

4                            Regulatory delay impacting auction pipeline
Systemic Issues Getting Resolved
Volume Regulatory Framework Evacuation
ͯ Slow pace of bidding ͯ Lack of central bidding guidelines ͯ Lack of evacuation clarity
ISSUES
ͯ 8 months between first 2 auctions ͯ Minimal state bids ͯ Delay in project execution
ͯ No states signing PPAs ͯ Postponement of auctions
ͯ Resulting into Aggressive bidding
Long term volume clarity given May’18: CERC orders issued
SOLUTIONS
Nov’17: MoP guidelines issued
~7.5 GW already auctioned Connectivity Approvals for all
Completed auctions regularized
>10 GW in pipeline (announced) projects under completed bids
3 state bids concluded
Enlarged Bid Size / Project Size Streamlined approval process
5 Connectivity approvals from SECI I to SECI IV now granted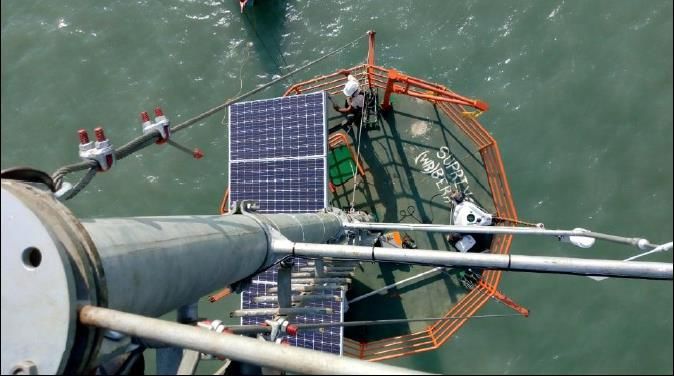
Strong Bid Pipeline Giving Visibility Of Upto FY21

    Bid Volumes (MW)                                          Commissioning Volumes (MW)

       To be commissioned between FY19-FY21                           Industry Commissioning Volume Outlook

                               20,860
                                                                                                    12,000
     To be Announced           3,000

          Announced            10,360                                                 8,000

    Already Concluded          7,500
                                                                         3,000
                        Cumulative Bids to be
                         concluded by FY19

                                                                        FY19          FY20          FY21

           Captive / PSU & Other Segments

6                                Poised for a sustainable expansion
FY19 Guidance: Operational Guidance Presently Withdrawn

                 While medium term to long term outlook continue to remain positive,
            In light of near term market uncertainties, we withdraw our operational guidance

                     Revenue                            ₹ 12,000 – 13,000 Cr.

                     EBITDA Margin                      Around 14%

                   However, we continue to maintain our debt reduction target

                     Debt Reduction Target              30% - 40%

7       More clarity on operational guidance in Q3 FY19; Committed to Debt Reduction
Financial Performance    Debt Overview      Industry Outlook

         Technology         Suzlon Strengths   Detailed Financials

8
Wind Volumes: Low Volumes Due To Back Ended Auctions In FY18

          (MW)

                                  326

                                                                              155

                               Q1 FY18                                     Q1 FY19

                   FiT Order Book Executed                         FY19 Volumes to be back ended

              • Auction regime setting in                • 6 GW of auctions concluded in H2 FY18

              • Last leg of High tariff FiT regime       • 12-18 months execution Timelines

              • Rush to capitalize the FiT volumes       • Part of SECI II and Captive orders delivered in Q1

9     H1 FY18 auction standstill period + connectivity delays = H1 FY19 executions impacted
Result Snapshot
(₹ Cr.)
Particulars Q1 FY19 Q1 FY18 FY18
Unaudited Unaudited
Remarks
Audited
Revenue 1,272 2,571 8,075 Primarily due to low volume
Gross Profit 489 1,008 2,959
Gross Margin 38.5% 39.2% 36.6%
Employee Expenses 194 201 805
Other Expenses (net) 218 332 1,006
EBITDA (Pre FX) 77 475 1,149
Primarily due to lower operating leverage
EBITDA Margin (Pre FX) 6.1% 18.5% 14.2%
Depreciation 84 82 342
Primarily due to:
• Lower finance income
Net Finance Cost 316 286 1,502
• Higher YoY Working Capital Debt
• Forex Impact
Taxes (3) 1 (2)
Share of (Profit) / Loss of Associates / JV 2 16 (5)
Net Profit (Pre Fx and Ex. Items) (321) 90 (688)
Primarily
Exchange Loss / (Gain) 254 42 146 • Translational impact
• Non cash in nature
Exceptional Loss / (Gain) 0 0 (450)
Reported Net Profit (575) 48 (384)
Non Controlling Interest (2) (1) (7)
Net Profit attributable to Shareholders (573) 49 (377)
10 Forex loss translational and non cash in natureConsistent Reduction In Net Working Capital
Fig. in ₹ Cr.
3,543
-1,143
To be further optimization under auction regime
2,780 • Reduced regulatory uncertainty
2,401
• Elongated execution schedule
• Smoothened out quarterly volumes
• Large scale project size
• Make to Order
Q3 FY18 Q4 FY18 Q1 FY19
11 To be substantially lower under auction regimeStable Service Revenue Insulated From Business Cycles
Operations and Maintenance Revenues (₹ Cr.)
~15 GW of Assets under Management (AUM)
― ~12 GW in India; ~3 GW Overseas
452 457
― 2nd Largest O&M player in India Power Sector, after NTPC
Internal 32 31
100% renewal track record in India
― Every turbine sold by us in India is under our Service fold
External 420 426
― Custodian of ~12 GW of assets in India
― 23 years of track record in India
Q1 FY18 Q1 FY19 External OMS revenue is ~34% Q1 FY19 revenue
12 Annuity like business; Steady cash generationLargest Backlog In India Wind Industry
Particulars Capacity Remarks
SECI IV and MH Bids PPA yet to be signed
Auction based Order Book 1,018 MW
(100% certainty of signing)
Retail, Captive, PSU & IPP 116 MW Backed by advance, Not dependent on PPAs
Wind Firm Order Book 1,134 MW
ASP ₹ 5.84 Cr. / MW
~1.8 GW Backlog
(Net of Taxes)
Value of Order Book ₹6,627 Cr.
Framework Agreements /
>700 MW PPA Signed, Ratification Awaited
PPA in hand
SEFL and Service orders over and above this order book
13 Resilient ASPs despite tariff declineFinancial Performance Debt Overview Industry Outlook
Technology Suzlon Strengths Detailed Financials
14Term Debt Profile
(Excl. FCCB) 31st Mar’18 30th Jun’18 Back Ended Maturity Profile
₹ 3,693 Crs. ₹ 3,881 Crs. (₹ Cr.)
SBLC Backed AERH Loans 65%
(US$ 569 M) (US$ 569 M)
4,654
Increase only due to FX; No change in US$ value
₹ 431 Crs. ₹ 441 Crs.
Other FX Term Debt FY19-22 Repayments: 35%
(US$ 66 M) (US$ 64 M)
Increase only due to FX; Despite reduction in US$ value 759 817
568
338
Rupee Term Debt ₹ 2,843 Cr. ₹ 2,815 Cr. FY19 FY20 FY21 FY22 FY23 &
Beyond
Gross Term Debt ₹ 6,967 Cr. ₹ 7,136 Cr.
Net Term Debt ₹ 6,037 Cr. ₹ 6,611 Cr.
Working Capital Debt ₹ 3,889 Cr. ₹ 3,471 Cr.
15 Focused on Debt Reduction
Note: 1 US$ = ₹ 68.47; Ind AS impact is captured in the Gross Term Debt total in ₹ CR.July 2019 FCCB Series Overview
(US$ Mn)
FCCB Principal Value
547
No. of Shares (Crs.)
Current Outstanding 532
Pending Conversion 67
375 Post Full Conversion 599
(₹ 1,213 Cr.*)
172
Conversion Details
Price (Per Share) ₹ 15.46
Exchange Rate ₹ 60.225
Jul’14 Conversions Till June’18 Jun’18
16 69% FCCBs already converted till date
Note: 1 US$ = ₹ 68.47; *Numbers post impact of Ind-ASFinancial Performance Debt Overview Industry Outlook
Technology Suzlon Strengths Detailed Financials
17Strong Visibility On Growth For India Wind Market
Feed-in-Tariff + Captive / PSU / Retail Auction + Captive / PSU / Retail
10.6 GW commissioned in last 3 years 23.0 GW in next 3 years
(MW) 12,000
8,000
5,502
3,415 3,000
1,766
FY16 FY17 FY18 FY19E FY20E FY21E
Source: MNRE Source: Internal Estimates
Key Drivers: Key Challenges:
Increasing power demand with supply only from renewables
X Infrastructure constraints
Push for clean, affordable and scalable power source
X Auction delays & sector uncertainties
Wind most competitive source of power in India
Large untapped potential
Auction based procurement
‒ Market expanding from 8 wind states to pan India
‒ Making wind subsidy free
Unlocking emerging areas potential
‒ Wind solar hybrid, offshore, repowering
18 Poised to become high growth marketLargest Order Volume Share In Auctions Concluded Till Date
Auction Wise Order Wins for Suzlon (MW)
1,413
126
285
500
250 252
SECI I SECI II SECI III SECI IV State Bids Total
→ ~97% volumes won through “Pre Bidding” tie up
→ ~98% volumes under full turnkey scope
→ ~92% volumes from Large Utility Companies – Top Quality Customer Profile
Around 20% of 7.5 GW auctioned capacity is still open in market – Incremental Potential for Suzlon
19 Zero reliance on self bidding~5 GW Announced Pipeline For Wind Solar Hybrid
Announced Pipeline • Wind Solar Hybrid Gaining Traction
2.5 GW Hybrid ‒ 14th May 2018: Wind Solar Hybrid Policy issued by MNRE
(New Hybrid) ‒ 25th May 2018: Scheme for 2,500 MW Wind Solar Hybrid Sanctioned; Bidding
Guidelines Issued
1 GW Wind
(in existing solar farms) ‒ 22 June 2018: RFS issued
• Key Features of Policy and Guidelines
1 GW Solar ‒ >25% of the capacity of other source to qualify as hybrid
(in existing wind farms)
‒ Fulfilment of solar / non solar RPO in the proportion of rated capacity
160 MW Hybrid ‒ SECI will be the Nodal Agency
(in Andhra Pradesh) ‒ Bid Capacity 200-500 MW; 25 years PPA; Annual CUF > 40%
Demonstrated Turnkey Capabilities of both Wind and Solar
~12,000 MW 340 MW
India Wind India Solar
Commissioning Commissioning
20 Strong competitive edgePoised To Become A 10+ GW Annual Market
India Annual Wind Market Potential Size and Segmentation
10 – 12 GW
8 – 10 GW
1 - 2 GW
1 GW
Central Auctions State Auctions Captive / PSU / FiT Total Annual Market
“India plans to auction 10 GW of wind energy for the next 10 years”, MNRE Secretary, Anand Kumar
Power Grid working on creation of transmission infrastructure
• Increasing inter-regional capacity
Laying new high capacity lines
Upgrading exiting substation facilities
• Work commenced on connecting southern, western and northern regions
• KfW Development Bank and Asian Development Bank to finance these projects
21 Sustainable
Large scalevolume
opportunity
addsPositive Aspects Of Competitive Bidding
Until FY17 FY19 onwards
Pan India Demand
Demand from Wind States only
(Wind + Non Wind States)
FiT + Incentive Regime Auction based / Market Based pricing
(High tariff uncertainties) (Reduced uncertainties)
(Reluctance from DISCOM) (Most competitive source of power)
Back Ended Volume
Reduced Seasonality in Volumes
(H2 typically 60-70% of full year volumes)
(Optimized Working Capital)
(Inefficient Working Capital)
Large Scale Orders (300 MW)
Moderate scale Order Size (50 – 100 MW)
(Optimized Cost and Working Capital)
High Regulatory Risk Reduced Regulatory Risk
(Back ended PPA signing (upfront signing of PPAs and tariff
Tariff depending on commissioning timing) determination)
22 India wind industry is transformingSuzlon Best Positioned In All Market Segments
Auction Regime – Path Ahead
Reduced Risk Profile
• Reduced Counterparty Risk
• Reduced grid risk
• 25 years PPA
Lower Cost of Capital
Lower Power Cost
• Lower Cost of Debt +
• Longer Maturity Profile
• Lower Cost of Equity
Technology Market Expansion
• Higher PLF
• Greater reliability
• Lower LCOE
Suzlon Competitive Edge
Cost Competitiveness Strong Market Positioning
• Large Scale Operations • Robust & Proven Technology
• Vertically Integrated Manufacturing • 2+ Decades Track Record
• Highest degree of localization • Strong Customer Relationships
• In-house Technology • Pan India Project Pipeline
23 To strongly benefit from market expansion through auctionsOther Emerging Opportunities For Growth
Offshore
• National offshore policy already notified
• Suzlon has commissioned 1st Offshore Met Station
1 GW
Expression of Interest • Offshore Advantage: Higher PLF due to high wind power density and shallow
5 GW water depth enables lower cost in terms of project execution
Targeted auctions until 2020
• 35 participants evinced interest for 1 GW Expression of Interest
Repowering
• Policy already announced and notified in 2016
• Repowering is replacing old technology low capacity wind turbines with the latest
3 GW
large sized wind turbines
Estimated Potential
• Govt. keen on harnessing this potential and working on right set of policies
of < 1,000 kw turbines
incentivizing Repowering
24 Emerging high growth areasFinancial Performance Debt Overview Industry Outlook
Technology Suzlon Strengths Detailed Financials
253 New Turbines Launched In FY18: Pushing Technology Boundaries
S111-140 S120-140 S128-140
2.1 MW 2.1 MW 2.6 – 2.8 MW
India’s Tallest Wind Turbine India’s Largest 2.1 MW Turbine India’s Largest Rotor Diameter
Proto Commissioned Aug’17 Proto Status Date Proto Status Date
S120-105 Commissioned Jun ’18 S128-105 Commissioned Jan ’18
S120-140 Expected Q2 FY19 S128-140 Expected Q3 FY19
S111-140 S120 S128
~5-6% ~6-7% ~20-22%
Higher Energy Yield Higher Energy Yield Higher Energy Yield
S111-120 S111 S120
26 Gaining competitive edge in auction regimeS120: Accelerate Near Term Competitiveness Of Current Platform
Site Installation underway SB59 Main Mould 2 installed at Bhuj SB59 Blades being sent to site
• Proto Commissioning: Q2 FY19
• Rated Capacity: 2.1 MW
Site Installation underway S120 Nacelle Assembly at Plant
• Rotor Diameter: 120M
• Tower Height: 120-140M
• 6-7% Higher Yield vs. S111
27 Main product offering for FY19S128 – 2.6 - 2.8 MW: Readying For The Future
S120 – 2.1 MW • Rotor Diameter: 128m
‒ Country’s largest
‒ New carbon fibre blade enabling better aerodynamic profile
• Hub height: up to 140
• 33% greater swept area
‒ Country’s largest
• 20-22% higher energy yield
‒ New Hybrid concrete tower
• Reduced LCOE
‒ Enabling higher hub height at optimized cost
• First Turbine Commissioned at Sanganeri, Tamil Nadu
‒ Increasing attractiveness / viability of low wind sites
S128 – 2.6-2.8 MW ‒ Unlocking unviable sites
Moving to higher rating turbines
28 Strong competitive edge under auction regimeFocus On Reducing LCOE
Higher energy yield Lower cost of energy Sustains Lower Tariffs
>70% Increase in Energy Yield
S97-120 S111-90 S111-120 S111-140 S120 S128
29 Over 4,500 turbines of 2.1 MW platform across 17 countriesPioneer In India Offshore
Support Platform Offshore LiDAR
• India’s 1st Private Far Offshore Met Station
‒ Opportunity to harness India’s 7,600km coastline
‒ Government plans to auction 5 GW of Offshore project next year
• State of Art Installation
‒ 16km from the Shore
Powered Through Solar
‒ 11m Water depth
‒ 14m support platform height above water level
‒ LiDAR based met station
‒ Remote monitoring
30 Strong capabilities in offshoreGlobal In-House R&D Capabilities
Suzlon Technology Locations:
Hamburg
- Development & Integration
Hamburg
- Certification
Germany Rostock
- Development & Integration
Rostock - Design & Product Engineering
- Innovation & Strategic Research
Hengelo
The Netherlands Hengelo - Blade Design and Integration
- Design & Product Engineering
- Turbine Testing & Measurement Pune
Pune
- Technical Field Support
- Engineering
India
Vadodara - Blade Testing Center Aarhus
Chennai - Design & Product Engineering (Gear Box Team)
Aarhus - SCADA Vejle
Denmark
Vejle - Blade Science Center
31 Best match between skills & location – Efficient leverage of R&D spendingFinancial Performance Debt Overview Industry Outlook
Technology Suzlon Strengths Detailed Financials
32Suzlon Strengths In India Wind Market
Full Turnkey Solution Pan India Presence
Provider
Strong Customer
Technology Leadership
Relationship
Best In Class Service 22+ Years Track Record
Capabilities
33 End-to-end service provider with strong presence across value chain & customer segmentsSurpassed 11 GW Wind Energy Installations In India
Ranked No. 1 in Renewables Sector Largest fleet under Operation and Maintenance fold in India
Ranked No. 2 in Power Sector
(31st Mar’18) # of Turbines MW
1 MW < 2 MW 4,268 5,774
=>2 MW 2,557 5,368
Total 8,503 11,919
2.0 GW
• 35% - All India installed wind capacity
2.5
GW 0.4 GW • ~17% - All India installed renewable capacity
• ~1,800 customer relationships
2.1 GW
0.1 • 22 years of operating track record
GW
1.6 • 26 TWh estimated of annual clean energy;
1.0
GW GW =2,125 mn trees planting p.a.
2.2
=~19.3 mn tonnes coal avoidance p.a.
GW =~25.5 mn tonnes CO2 emission savings p.a.
34 Custodian of 2nd highest installed power capacity (from all sources) in India
Map not to scale. All data, information, and map is provided “as is” without warranty or any representation of accuracy, timeliness or completeness.Suzlon’s Global Presence
As on 31st June 2018
2 5
2 1
North
America 6
3 1
2,779 MW
4
Asia
3 5 12,948 MW
South America Europe
806 MW 508 MW 4
South
Africa Australia
139 MW 764 MW
6
35 Suzlon’s strong relationships across regions positions it well
Map not to scale. All data, information, and map is provided “as is” without warranty or any representation of accuracy, timeliness or completeness.USA PTC Volume: ~500 MW Pipeline Created For 100% PTC Projects
Production Tax Credit (PTC) Extension: Huge Volume Opportunity
• PTC in USA extended until 2019 with benefits stepping down every year before phase out
• In order to qualify, projects only need to start construction and make a minimum 5% investment
(“Safe Harbour Investments”)
• Thus projects which meet safe harbour investments in 2016, will be eligible for 100% PTC benefit, while projects
which meet safe harbour investments in 2017 will be eligible for 80% PTC benefit
• Timeline for completion of the projects is 4 years from the start of construction
Start Construction/Safe Timeline for
Harbor Completion Suzlon Strategy
100% PTC
2016 2020
• Established SPVs to implement Safe Harbor
Projects and develop project pipeline
80% PTC
2017 2021 • ~500 MW Pipeline created of projects eligible for
100% PTC
60% PTC • To translate into firm orders for execution over the
2018 2022
next couple of years
40% PTC
2019 2023
36 Re-entering international marketFinancial Performance Debt Overview Industry Outlook
Technology Suzlon Strengths Detailed Financials
37Consolidated Income Statement
(₹ Crs.)
Q1 FY19 Q1 FY18 FY18
Particulars
Unaudited Unaudited Audited
Revenue from operations 1,272 2,571 8,075
Less: COGS 783 1,563 5,116
Gross Profit 489 1,008 2,959
Margin % 38.5% 39.2% 36.6%
Employee benefits expense 194 201 805
Other expenses (net) 218 332 1,006
Exchange Loss / (Gain) 254 42 146
EBITDA (177) 433 1,003
EBITDA (Pre-FX Gain / Loss) 77 475 1,149
Margin % 6.1% 18.5% 14.2%
Less: Depreciation 84 82 342
EBIT (261) 351 661
EBIT (Pre-FX Gain / Loss) (7) 393 807
Margin % -0.5% 15.3% 10.0%
Net Finance costs 316 286 1,502
Profit / (Loss) before tax (576) 64 (840)
Less: Exceptional Items Loss / (Gain) 0 0 (450)
Less: Share of (Profit) / Loss of Associates & JV 2 16 (5)
Less: Taxes (3) 1 (2)
Net Profit / (Loss) after tax (575) 48 (384)
Less: Non-Controlling Interest (2) (1) (7)
Net Profit Attributable to Shareholders (573) 49 (377)
38Consolidated Net Working Capital
(₹ Cr.)
30th Jun’18 31st Mar’18 31st Dec’17
Inventories 2,923 3,026 3,590
Trade receivables 2,720 2,990 3,565
Loans & Advances and Others 1,749 1,620 1,923
Total (A) 7,392 7,636 9,078
Sundry Creditors 2,627 2,527 2,515
Advances from Customers 935 932 1,505
Provisions and other liabilities 1,429 1,397 1,515
Total (B) 4,991 4,856 5,534
Net Working Capital (A-B) 2,401 2,780 3,543
39Key Accounting Policies – Revenue Recognition And Order Booking
Opening Order Book
• Sales (WTG Revenue Recognition)
(-) Sales during the period ‒ WTG revenue is recognised upon transfer of risks and rewards to the buyer of
complete WTG viz: Nacelle, Blade and Tower.
(+) Order Intake during the • Order Intake during the period
period ‒ Only orders backed by certainty of PPAs
• Closing Order Book
Closing Order Book
‒ Represents MW value of contract against which no revenue is recognized in the
income statement
40 Adherence to best accounting and reporting practicesKey Accounting Policy: Maintenance Warranty Provisions
Maintenance Warranty Provisions
Accounting Policy:
― Comprise of provisions created against maintenance warranty issued in connection with WTG sale
Created when revenue from sale of wind turbine is recognized
― Provisions estimated based on past experience
― Reversals of unused provision on expiry of Maintenance warranty period
Global Wind Industry Standard Practice:
― Followed by top listed global industry leaders
― Despite Insurance and back to back warranty from suppliers
41 Adherence to best accounting and reporting practicesCIN of Suzlon Energy Ltd - L40100GJ1995PLC025447
THANK YOU
42You can also read