AUGUST 2020 RESULTS PRESENTATION - The Vault

Page created by Ted Porter
 
CONTINUE READING
AUGUST 2020 RESULTS PRESENTATION - The Vault
AUGUST 2020
RESULTS PRESENTATION
AUGUST 2020 RESULTS PRESENTATION - The Vault
Contents

Overview and strategy              slide 3

Our sector and operating context   slide 6

Impact of COVID-19                 slide 12

Our developments                   slide 14

Property fundamentals              slide 20

Shoprite transaction update        slide 27

Financial review                   slide 31
       Financial performance
       Financial position
       Net debt
       Financial risk management

Focus on ESG                       slide 46

UK strategic venture               slide 49

Prospects                          slide 58
AUGUST 2020 RESULTS PRESENTATION - The Vault
OVERVIEW AND
  STRATEGY
AUGUST 2020 RESULTS PRESENTATION - The Vault
74.44cꜛ                0.4% ꜛ              29.5%                  10.0                R16.2                  99.1%
    DPS                  NAVPS                 LTV                  years                billion             collection
                                                                                                               rate

DPS remained largely   NAVPS increase of       Conservative
                                                                  Weighted average       Portfolio value   Average collection rate
 flat compared with     0.4% to R17.44 at    financial profile
                                                                 lease expiry across      increased to      was 99.1% over the
  74.43c at Aug-19     Aug-20 from R17.37   against uncertain
                                                                     the portfolio     R16.2bn at Aug-20     six-month period
                            at Aug-19        macroeconomic
                                               background

                                                                                THE PERIOD IN REVIEW
AUGUST 2020 RESULTS PRESENTATION - The Vault
Equites’ strategy is focused on becoming a globally relevant
                       specialist REIT, focusing on the top end of the logistics sector

                   We have a single-minded focus on building our portfolio in line with
                                     our strict investment criteria

   Unlock key tracts of land
 through the relationship with                                                            Develop “best in class”
          Newlands                                                                        logistics parks on key
                                                                                          strategic land holdings

Develop new assets on a
pre-let basis through the
  JV and unlock value                      United             South                        Sale and leaseback
     through turnkey                      Kingdom             Africa                          transactions
      developments

                                                                                       Acquisition of assets or
   Acquisition of portfolio                                                         portfolios should they become
     enhancing assets                                                                           available
AUGUST 2020 RESULTS PRESENTATION - The Vault
OUR SECTOR
AND OPERATING
  CONTEXT
AUGUST 2020 RESULTS PRESENTATION - The Vault
OPERATING
                                                                                                              CONTEXT

Economic climate in the UK
                                                                              Major economies’ 2Q20 GDP YoY - volume terms
                                                                       0%
                   The UK tumbled into its largest recession (2Q20)
   01              on record (-22.1%) and fared worse compared to
                   numerous other major economies                     -5%

                   UK GDP is expected to contract by                  -10%

  02               approximately 10% over the full year with
                   almost 750,000 jobs being shed since the start
                                                                      -15%
                   of the coronavirus

                                                                      -20%
                   Fiscal and monetary stimulus that has been

  03
                   enacted should provide some support - forecasts
                   shows that the recovery could be rapid,            -25%
                                                                               India   UK   France   Italy    EU   Germany   Japan   US
                   forecasting growth of more than 6% in 2021
                    Source: Refinitiv                                  Source: OECD

 Results Presentation | August 2020                                                                                                   7
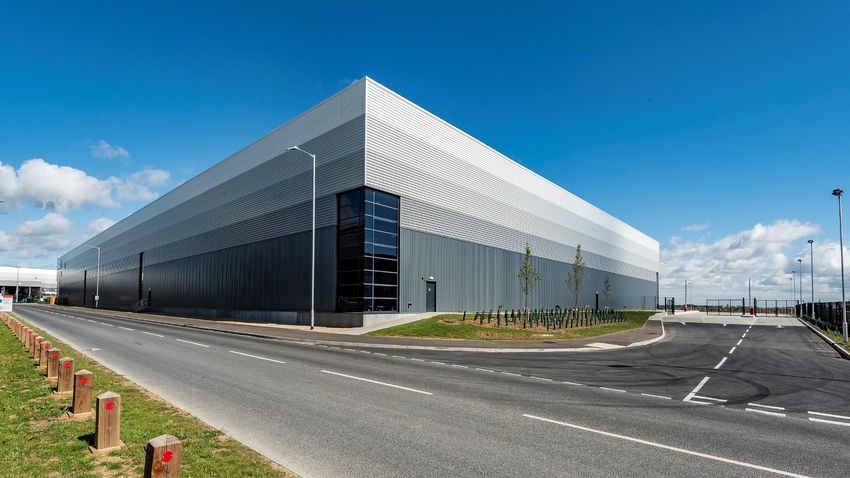
AUGUST 2020 RESULTS PRESENTATION - The Vault
OPERATING
                                                                                                                     CONTEXT

Economic climate in SA
                                                                                       SA – Labour force participation rate

                    The South African Reserve Bank (SARB)
   01
                                                                       60%
                    expects SA’s economy to contract by 8.2% in
                    2020, with some recovery in 2021 (+3.9%)           50%

                                                                       40%

                    The SARB has cut the repo rate by 300 basis
  02
                                                                       30%
                    points this year, resulting in a record-low repo
                    rate of 3.5%. Headline CPI is still however,       20%
                    expected to be 3.3% for 2020 – at the lower end
                    of the SARB’s target range of 3% to 6%             10%

                                                                       0%
                    The South African economy shed more than 2
  03
                                                                               3Q17         1Q18         3Q18            1Q19       3Q19         1Q20

                    million jobs in the second quarter of 2020               Labour force participation fell to 47.3% in 2Q20 – compared to an average over the
                                                                                                             last three years of 59%
                                                                                                                Source: StatsSA
                    Source: RMB Global Markets

 Results Presentation | August 2020                                                                                                                     8
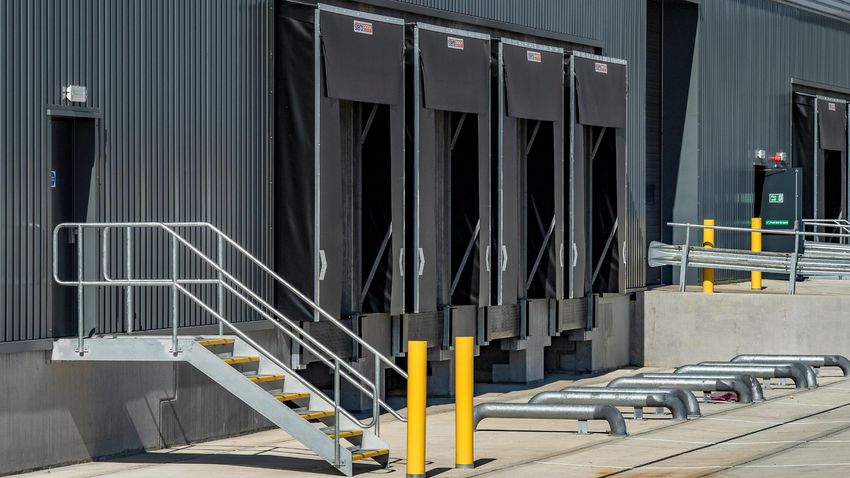
AUGUST 2020 RESULTS PRESENTATION - The Vault
OUR APPROACH
                                                                                                      OPERATING
                                                                                                 TO ESGCONTEXT

Strong tailwinds in the UK with robust growth                                                Online sales – United Kingdom
                                                                      35%
in e-commerce                                                         30%
                                                                      25%
•     Online sales as a percentage of total sales averaged 26%        20%
      (Jan-Aug 2020), far higher than 19% in 2019                     15%
                                                                      10%
•     Savills estimates online sales in the UK to be 26% in           5%
      2020, dropping to 24% in 2021 due to some normalisation         0%
      in consumer shopping patterns                                    Aug-10             Aug-12            Aug-14         Aug-16            Aug-18         Aug-20
                                                                                   Monthly internet sales            2020 YTD           Average for 2017-2019

•     Two additional trends support the logistics sector in a post-    Source: ONS

      COVID-19 world:                                                                      Online sales – European forecast

          1.     Onshoring of manufacturing –more emphasis                   26%
                                                                                24%
                 being placed on in-country production security to      19%                                20%19%
                 mitigate supply side risks                                                 14%14%
                                                                                                        16%
                                                                                                                                             13%13%     12%
                                                                                                                                                           16%15%
                                                                                         11%                                   10% 9%     10%
                                                                                                                          5%
          2.     Rising inventory levels – supply chains to include
                 inventory buffers to cater for disruptions such as
                                                                              UK            France          Germany         Spain         Netherlands    Average
                 COVID-19
                                                                                                                2019     2020    2021f
                                                                       Source: Savills
    Results Presentation | August 2020                                                                                                                               9
AUGUST 2020 RESULTS PRESENTATION - The Vault
OUR APPROACH
                                                                                       OPERATING
                                                                                  TO ESGCONTEXT

Record take-up of space YTD in the UK logistics market, driven by online retailers

YTD take-up is 38.6m sq ft (3.59m sq m) (first three        The trend of online retailers contributing to a higher
quarters of 2020), breaking the previous annual record      percentage of the total take-up is expected to continue,
of 37.8m sq ft (3.51m sq m) set in 2016; Amazon             primarily due to the growth in e-commerce
contributed to c.29% of take-up in 2020
     UK logistics market – take up per quarter                     UK annual take up of dedicated internet retail

                                                            35%
                                                            30%
                                                            25%
                                                            20%
                                                            15%
                                                            10%
                                                            5%
                                                            0%
                                                                  4Q07          4Q10            4Q13             4Q16            4Q19          3Q20
                                                                            Rolling annual take-up - dedicated internet retail as a % of all
                                                                            take-up
                                                                            % retail sales online

 Sources: Savills                                             Sources: ONS, Gerald Eve
 Results Presentation | August 2020                                                                                                                   10
OUR APPROACH
                                                                                                      OPERATING
                                                                                                 TO ESGCONTEXT

SA e-commerce infrastructure yet to bloom; COVID-19 is accelerating this trend

                                  For the 24 weeks ending Aug 2020:                   TFG Africa targets their online sales to be 10%
                                  Online sales growth of 344%                                      of total sales by 2025
                                                                                10%

                                                                                8%
                                  Group online sales post lockdown were up
                                  75% - sales were above Black Friday in 2019
                                                                                6%

                                  Fashion, Beauty and Home (FBH) - Online       4%
                                  sales grew by 41% in 2H20
                                                                                2%

                                  As at June 2020 - Game grew online sales by   0%
                                                                                      2016   2017   2018   2019   2020   2021   2022   2023   2024   T:2025
                                  100%, Builders by 160% and Makro by 84%

 Results Presentation | August 2020                                                                                                                    11
IMPACT OF
 COVID-19
KEY OBJECTIVES
                                                                                                                                               AND IMPACT

Capital preservation
Increased risk premiums to reflect
heightened uncertainty and reassessed
capital allocation decisions
                                                                                                                     Maintaining sufficient liquidity
                                                                                                                      Maintained higher cash holdings,
Job preservation for                                                                                                  curtailed discretionary expenditure and
employees and contractors                                                                                             proactive management of hedging
                                                                                                                      positions
Prioritised continued operation of
development sites, provided support for
contractors and equipped staff with                                                                                   Tenant support
resources to work from home
                                                                                                                      Understanding tenant needs and
                                                                                                                      granting concessions on a case-by-
                                                                                                                      case basis

                                      Despite our best efforts to minimize the impact of COVID, at least four types of once-off costs were
                                     incurred which were incremental when compared with the prior period; this amounted to R29million.
Results Presentation | August 2020                                                                                                                              13
OUR
DEVELOPMENTS
BASELINE
                                                                                                                                     SPECIFICATION

MODERN DISTRIBUTION CENTRE                                                Free solar
                                                                         PV systems
                                                                                                                   Mechanically
                                                                                                                    ventilated
                                                                                                                    warehouse

                                                                        Energy Efficient
                                                         15.5m clear    LED lighting in                                              7m canopies
                                                          springing /     warehouse                                                    over dock
                                       Perimeter walls
                                                         eave height                                                                levelling doors
                                        constructed
                                        using tilt-up
                                           panels                                 FM2 floor with a
                                                                                   load bearing
                                                                                    capacity of
                                                                                     90Kn/m2                              18m canopies
                                                                                                                          over on-grade               45m minimum
                                                                                                                              doors                    yard depth

                                                                                                     Kelly dock-
                                                                                       Sectional      levellers
                                                                                       doors with
                                                                                        viewing
                                                                                        panels

  Results Presentation | August 2020                                                                                                                                15
SELECTED ONGOING DEVELOPMENTS

Location                             Equites Park – Meadowview, Gauteng   Location                      Equites Park – Meadowview, Gauteng

Tenant                               Altron                               Tenant                        Digistics

Expected completion date             October 2020                         Expected completion date      December 2020

Expected GLA                         25 001m²                             Expected GLA                  21 026m²

Capital value on completion          R239 million                         Capital value on completion   R217 million

                                                                                                                                             16
Results Presentation | August 2020
SELECTED ONGOING DEVELOPMENTS

Location                             Equites Park – Riverfields, Gauteng   Location                      Equites Park – Riverfields, Gauteng

Tenant                               Sandvik                               Tenant                        Imperial

Expected completion date             April 2021                            Expected completion date      December 2020

Expected GLA                         22 599m²                              Expected GLA                  17 628m²

Capital value on completion          R287 million                          Capital value on completion   R175 million

                                                                                                                                               17
Results Presentation | August 2020
SELECTED ONGOING DEVELOPMENTS

Location                             Philippi, Western Cape   Location                      Leeds, UK

Tenant                               TBC                      Tenant                        DHL

Expected completion date             March 2021               Expected completion date      October 2020

Expected GLA                         8 089m²                  Expected GLA                  4 961m² (57 383 sq. ft.)

Capital value on completion          R70 million              Capital value on completion   R272 million (£12 million)

                                                                                                                         18
Results Presentation | August 2020
SELECTED COMPLETED DEVELOPMENTS

Location                             Equites Park – Meadowview, Gauteng   Location          Airport Industria, Western Cape

Tenant                               DSV (extension)                      Tenant            Röhlig-Grindrod (refurbishment)

Completion date                      August 2020                          Completion date   August 2020

GLA                                  5 260 m²                             GLA               5 661 m²

Capital value                        R60 million                          Capital value     R25 million

                                                                                                                              19
Results Presentation | August 2020
PROPERTY
FUNDAMENTALS
10.0                   7.8%                   R16.2                  94.6%                       63
   years              escalation                  billion               A-grade               properties

 Weighted average      Weighted average          Fair value of our      Percentage of total    Income-producing
lease expiry across   escalation across the     portfolio at Aug-20   revenue from A-Grade    properties across the
    the portfolio     South African portfolio                                tenants                portfolio

                                                                 OPERATIONAL HIGHLIGHTS
RENTAL
                                                                                                                                         COLLECTIONS

Rental collections
•      We have collected on average 99% of total rental due in                               100 100          100               100                    100          100          100
       SA for the months of March to August 2020                                       100

                                                                                       100                                                     99.4          99.4

•      For the same period, we collected 100% of the contractual                                                                                                          99.0
       rental due in terms of lease agreements in the UK                                99                               98.9

                                                                         % collected
•      While rental collections remain robust, we recognize that                        99

                                                                                                       98.1
       our ability to collect rentals in future is contingent upon our                  98
       tenants’ ability to remain operational
                                                                                        98

•      We have therefore engaged with tenants to understand
       how we may assist to ensure their sustainability                                 97
                                                                                             Mar-20     Apr-20            May-20                Jun-20        Jul-20       Aug-20

                                                                                                                    South Africa      United Kingdom
•      In this regard, we have granted short-term cash flow relief
       and longer-term cash flow relief to tenants in the form of         Cash flow relief has been provided to tenants by agreeing to defer a percentage of rental
       rent deferrals                                                             during lockdown, and for this to be repaid over an agreed upon period
                                                                                                         (usually within 12 months)

    Results Presentation | August 2020                                                                                                                                      22
TENANT
                                                       CONCENTRATION

Impact on tenants
• Our portfolio comprises 94.6% blue-chip tenants as
  at 31 August 2020

• 68% of our tenants operate in transport and
  logistics, FMCG retailing and food producers which
  have proven to be highly resilient throughout the
  pandemic

• Approximately 85% and 100% of tenants remained
  operational during lockdown in SA and the UK,
  respectively

• 100% of tenants are now fully operational

 Results Presentation | August 2020                                    23
PORTFOLIO VALUE

Results Presentation | August 2020                 24
PROPERTY
                                                                                                                                                              FUNDAMENTALS

Lease expiry profile
Lease expiry profile (by revenue)                                                             Weighted average lease expiry
                                                                                                       16.0
      80                                                                                                                                                               14.1
                                                                                                                                    13.7
                                                                                         70            14.0                                                                                               12.9
      70
                                   60                        60                                        12.0
      60
                                                                                                       10.0
      50                                                                                                                                                                                7.9

                                                                                               years
                                                                                                        8.0      7.0                                   7.4

      40
%

                                                                                                        6.0                                                                                   5.4
                                                                                                                                                             4.9
                                                                                                                       4.5
      30                                                                                                4.0
                                                                                                                                                                                                    2.0
      20                      15                                                                        2.0
                                                     13 14                          12
                     10 11                       8                              9                                              -                                   -
      10                                                          4    5                                 -
             3   1                      2   3                               1                                          Aug-20                                Feb-20                           Aug-19
      -
                     Aug-20                     Feb-20                     Aug-19                                            South African logistics         South African industrial

                                                                                                                             South African commercial        United Kingdom logistics
                     Within 1 year          Within 2 years            Within 3 years

  •        60% of our leases expire beyond five years                                              •          WALE increased from 9.5 years at August 2019 to
                                                                                                              10.0 years at August 2020
  •        Three leases, with a combined GLA of 23,961m² are due
           to expire within the next 12 months – we are engaging                                   •          Developments completed in the six months ended
           with these tenants to extend/renew their agreements                                                31 August 2020 resulted in long dated leases
Results Presentation | August 2020
                                                                                                              expiring between 7 and 10 years                                                                    25
PROPERTY
                                                                                                                      FUNDAMENTALS

Geographical location and tenant profile
Geographical location                                                              Tenant grade

 Aug-20                                                                            Aug-20                             95                     3   2
                           39              14         2               45

                                                                                   Feb-20                            94                      4   2
 Feb-20                    40               16            2            42

                                                                                   Aug-19                             94                     3   3
 Aug-19                     43                   17           2         38
                                                                                            50        60        70                 80   90       100
                                                %                                                                          %

              Gauteng       Western Cape   Kwa-Zulu Natal         United Kingdom                                  A        B   C

  •     The majority of our assets are situated in key logistics                      •      As we build our portfolio for the future, we favor long-
        nodes                                                                                dated leases with low risk tenants

  •     55% and 45% of our portfolio (by value) is situated in SA                     •      Through targeted acquisitions, we have effectively
        and the UK, respectively                                                             reduced the exposure to C-grade tenants.
Results Presentation | August 2020                                                                                                                     26
SHOPRITE
TRANSACTION
   UPDATE
OUR APPROACH
                                                                           SHOPRITE
                                                                     TO ESG
                                                                         TRANSACTION

Shoprite transaction: acquisition of three distribution centres
 Centurion campus                                                                   Cilmor DC

                                                                                Brackenfell DC

 Results Presentation | August 2020                                                        28
OUR APPROACH
                                                                                                                 SHOPRITE
                                                                                                           TO ESG
                                                                                                               TRANSACTION

Shoprite transaction overview
                                                                                               Equites Property                                   Shoprite
 •       The JV creates a long-term relationship between                               50.1%                                       49.9%      Holdings Limited
                                                                                                Fund Limited
         Shoprite and Equites

 •       Further developments and extensions can be executed
         within this structure

 •       There is the potential for further Shoprite tenanted                                                         Retail Logistics
                                                                                                             JVCo
         properties to move into Retail Logistics Fund                                                                Fund (“RLF”)

           3.2bn                   7.5%                      20yr          5%
            portfolio                                          lease      escalation
                                   initial yield
             value                                            period*        rate
                                                                                                            Holds three SHP         Ability to
                                                                                                              DC’s: Cilmor,         develop
                                                                                                            Brackenfell and      additional bulk
                                                                                                             Centurion with       and acquire
*20-Yr lease period with three 10-year lease renewal options thereafter                                      combined GLA         further SHP
                                                                                                              of 400,000m²         DC’s in the
     Results Presentation | August 2020                                                                                               future             29
OUR APPROACH
                                                                                    SHOPRITE
                                                                              TO ESG
                                                                                  TRANSACTION

Shoprite transaction overview                                                    Expected LTV impact
                                                                     LTV ratio          Target: lower limit        Target: upper limit
•       The acquisition is in line with Equites’ robust
        investment criteria
                                                                                                                                35%
•       The transaction serves to further diversify the tenant                                                    30.7%
                                                                          29.5%
        base and increase exposure to the food sector &
        largest food retailer in Africa
                                                                                                                                25%

•       Increased predictability of cash flows with 20-year
        leases let to strong covenant

•       Assist superior NAV growth

•       Increase group WALE from 10.0 to 13.7 years

•       Expected return on equity: 14% - 15% (yield and          LTV ratio - 31 August 2020        LTV ratio - post Shoprite transaction

        geared capital growth)                                     Further debt capacity of R1.3bn before we reach a
                                                                   35% LTV ratio (including the Shoprite transaction)

    Results Presentation | August 2020                                                                                                     30
FINANCIAL
 REVIEW
74.44c ꜛ                 0.4% ꜛ               29.5%                      3.5                     R1.1
      DPS                    NAVPS                  LTV                      years                   billion

                                                    Conservative          Weighted average        Available cash and
DPS remained largely flat   NAVPS increase of
                                                financial profile and   debt maturity remains     facilities to execute
compared with 74.43c at     0.4% to R17.44 at
                                                   strong liquidity     in line with prior year   contracted pipeline
       Aug-19                   Aug-20

                                                                        FINANCIAL HIGHLIGHTS
DISTRIBUTION STATEMENT ANALYSIS
                                                                                                                    FINANCIAL PERFORMANCE

Distribution statement

                                                                                                                         Net property-related income
                                      Six months    Six months
                                                                 Year ended
                                         ended        ended                                           11.0% increase largely due to LFL net rental growth across the SA of 6.2%
                                      31 Aug 2020   31 Aug 2019 29 Feb 2020    Variance    Variance    and the impact of acquisitions and developments in SA (Federal-Mogul,
Distribution statement                   R'000         R’000        R'000       R'000         %               Digistics etc.) and the UK (Coloplast, Puma, DPD, Roche)
Gross property-related income           569 617       513 095     1 065 019     56 522      11.0%
Property-related expenses               ( 69 358)    ( 62 295)    ( 115 892)   ( 7 063)
                                                                                                                        Other administrative expenses
Net property-related income             500 259       450 800      949 127      49 459      11.0%
Other administrative expenses           ( 23 052)    ( 22 762)    ( 37 769)     ( 290)                  Marginal increase across administrative expenses which reflects cost
Distributable earnings before
                                        477 206       428 037      911 358      49 169      11.5%
                                                                                                         containment measures considering COVID-19 and the decrease in
financing activities
                                                                                                                             discretionary expenditure
Net finance costs                       ( 26 498)    ( 48 594)    ( 105 413)    22 096
Current tax expense                         -         ( 533)      ( 2 476)       533
                                                                                                                                Net finance costs
Antecedent dividend                      6 864        26 665       35 899      ( 19 802)
Distributable earnings                  457 572       405 577      839 368      51 995      12.8%       A lower all-in cost of debt, the impact of raising equity in March 2020
No. of shares outstanding               614 718       544 890      554 441      69 828      12.8%      and the capitalisation of interest, offset partially by incremental funding
Distribution per share (cents)           74.44         74.43       151.39        .01        0.0%                        on new acquisitions and developments

 Results Presentation | August 2020                                                                                                                                           33
RENTAL
                                                                                               DEFERRALS

Treatment of rental deferrals
                                                                      30
• Rental deferrals granted during the period amounted to
  R29m in SA and R7m in the UK
                                                                      25

• We anticipate to receive majority of these rentals over the
  next 12 months, with R3.8m already received as at 31                20

  August 2020
                                                                           26

                                                                R’m
                                                                      15
• Approximately R7m of these deferrals were lease
  modifications per IFRS 16, the impact of which was
  immaterial                                                          10

• Performed a detailed assessment of the expected credit              5
                                                                                                          6.2
  loss as a result of rental deferrals
                                                                           3
                                                                                                          0.8
                                                                      0
                                                                           SA                             UK
• Expected credit losses on the outstanding lease
  receivables were estimated to be R3.7m across the group                       Collected   Uncollected

 Results Presentation | August 2020                                                                             34
DISTRIBUTABLE EARNINGS - RECONCILIATION FROM CASH FLOW
                                                                             FINANCIAL PERFORMANCE

Reconciliation from CGFO to distributable earnings
                                                                         Cash generated from operations (“CGFO”)
R’000                                                 31 Aug 2020     Cash generated from operations continues to remain
Cash generated from operations (‘CGFO’)                346 337           robust despite the impact of COVID-19 on the
Net finance costs paid                                 (15 127)
                                                                                           operations
Current tax paid                                         (728)
                                                       330 482
                                                                                    Nature of adjustments
Working capital movements                              127 891
                                                                        The primary adjustment to cash generated from
Interest expense incurred not yet paid                 (10 418)        operations pertains to working capital movements.
Income tax paid relating to the prior period              728         These include the impact of rent deferrals, derivative
Timing and foreign exchange differences                 (9 690)
                                                                          instruments and the movement in accruals
Antecedent dividend                                      6 864
Adjustments to distributable earnings not in IFRS        6 864                      Antecedent dividend
Other adjustments                                        2 025
                                                                      Had DPS been calculated using a weighted average
                                                                      number of shares, the result would have substantially
Distributable earnings                                 457 572                           been the same

Results Presentation | August 2020                                                                                             35
FINANCIAL POSITION

Condensed consolidated statement of financial position
                                                                                                                Fair value of investment property
As at
                                                                                                      R2.7bn increase is primarily attributable to acquisitions
                                                                                                      and developments in SA (R0.7bn) and the UK (R0.9bn),
                                      Unaudited   Unaudited          Audited
                                                                                  Variance Variance
                                     31 Aug 2020 31 Aug 2019       29 Feb 2020
                                                                                   R’000      %
                                                                                                        fair value adjustments (-R0.1bn) and FX (R1.2bn)
                                        R’000       R’000             R’000

                                                                                                                        Deferred tax asset
Assets
Fair value of investment property      16 157 457   13 499 365       14 834 168 2 658 092    19.7%
                                                                                                      Increase pertains to UK capital allowances and tax losses
                                                                                                        which are expected to be realised in the next few years
Investment property held-for-sale         68 231               -         40 455     68 231      n/r

Property, plant and equipment             16 528       16 211            15 399        318    2.0%                 Trade and other receivables
Deferred tax asset                       181 973      104 938           159 870     77 035   73.4%
                                                                                                       Increase mainly due to rent deferrals granted over the
Other financial assets                   226 495       85 565            23 017    140 930 164.7%
                                                                                                                         past six months
Trade and other receivables              107 194       54 257            76 191     52 937   97.6%

Cash and cash equivalents                134 597       35 730            53 724     98 867 276.7%
                                                                                                                      Other financial assets
TOTAL ASSETS                           16 892 475   13 796 067       15 202 825 3 096 408    22.4%     R0.2bn was held in short-term deposits at 31 Aug 2020

Results Presentation | August 2020                                                                                                                                36
FINANCIAL POSITION

Condensed consolidated statement of financial position
                                                                                                                  Equity attributable to the parent
As at
                                                                                                        Increase due mainly to capital raise, the impact of FX
                                      Unaudited      Unaudited       Audited
                                     31 Aug 2020    31 Aug 2019    29 Feb 2020
                                                                                  Variance Variance            movements and fair value adjustments
                                                                                   R’000      %
                                        R’000          R’000          R’000

Equity and reserves                                                                                                     Loans and borrowings
Equity attributable to the parent      10 723 750      9 464 105      9 729 590   1 259 645   13.3%
Non-controlling interest                   38 062         35 390         40 434       2 672    7.5%
                                                                                                        Increase mainly due to UK funding (Aviva and HSBC),
TOTAL EQUITY                           10 761 812      9 499 495      9 770 024   1 262 317    13.3%      SA DMTN issuance (EQT004), additional SA bank
                                                                                                                    funding and FX movements
Liabilities
Loans and borrowings                    5 220 600      3 821 168      4 796 043   1 399 432   36.6%
Other financial liabilities               630 022        147 630        241 470     482 392   326.8%                   Other financial liabilities
Other liabilities                           4 479          4 481          4 462         (2)    0.0%
Current tax liability                        600           1 006          1 328       (406)      n/r     Increase is due to the LIBOR and JIBAR swap yield
Trade and other payables                  274 962        322 286        389 496     (47 323) (14.7)%   curves flattening as a result of falling global interest rates
TOTAL LIABILITIES                       6 130 663      4 296 570      5 432 799   1 834 093    42.7%            and the impact of the ZAR depreciation
TOTAL EQUITY AND LIABILITIES           16 892 475     13 796 065     15 202 823   3 096 410    22.4%

Results Presentation | August 2020                                                                                                                                  37
NAVPS PROGRESSION

Net asset value per share progression
                                      1.67

                                      Growth in operating
                                                                                    Increase in the
                                       income generated
                                                                                    spot GBP/ZAR
                                     during the year (net of     Negative fair                          Equity capital
                                                                                   exchange rate led
                                     the dividend paid) led          value                               raised at a
                                                                                   to 3.5% increase
                                        to 0.6% increase        adjustments on                         premium to net
                                                                                    in the NAV per
                                                                 portfolio and           share           asset value
                                                                 interest rate                          resulted in a
                                                                  derivatives                          0.3% increase
                                                               resulting in 3.9%                       on a per share
                                                                   decrease                                 basis

Results Presentation | August 2020                                                                                          38
VALUATIONS

Valuation policy

                                                                                               Externally and internally valued properties
We continue to maintain a robust external valuation policy.
                                                                                        90.0
Our policy is buttressed by the following three foundational
                                                                                                                                                    78.1
elements:                                                                               80.0
                                                                                                    68.3
                                                                                        70.0

                                                                                        60.0

    Expertise                     Independence               Frequency                  50.0

                                                                                    %
                                                                                        40.0
                                                                                                                31.7
                                                                                        30.0
                                                                                                                                          21.9
     • We prefer                      • We carefully         • We target
       specialists in                   evaluate threats       externally valuing       20.0
       logistics assets                 to independence        each property in
       who have local                   prior to our           our portfolio at         10.0
       knowledge                        appointment            least once every
                                        process                18 months
                                                                                          -
     • We consider a
       broad range of                 • We rotate            • Over 75% of the                      Feb 19 to Aug 19                     Feb 20 to Aug 20
       external valuers                 external valuers       portfolio was
       as part of the                   on a regular basis     valued between                           Internally valued   Externally valued
       selection criteria               to preserve            Feb-20 and Aug-
                                        independence           20

 Results Presentation | August 2020                                                                                                                         39
VALUATIONS

Valuation of investment property                                                                  We test the robustness of the valuations by:
  Creating value through the quality of our buildings
                                                                                                      Testing to comparable external valuations
                                                                                                      Assessing the reasonability of the implied cap
                                                % of income-   Average
  Region                 Type of property        producing      value
                                                                         Discount     Exit             rates and comparing to current build costs
                                                                           rate     cap rate
                                                  portfolio     (R/m²)
                                                                                                  The average value of our modern distribution
                   Modern distribution centre       46%        R11 109   13.64%      7.90%         centres in SA is R11 109/m² and this increases as
                                                                                                   the specification changes
                         Logistics campus           36%        R16 762   13.50%      7.96%
     SA
                   Cross-docking / Ultra-low                                                      High-quality logistics real estate continues to
                                                    11%        R13 925   13.69%      7.95%
                          coverage                                                                 demonstrate resilience
                                 Other              7%         R14 852   13.69%      8.47%
SA total                                           100%        R13 797   13.60%      7.98%        Both discount rates and exit capitalisation rates
                                                                                                   have remained relatively flat for prime logistics
                   Modern distribution centre       49%        R32 839    5.52%      4.90%
                                                                                                   assets
     UK
                   Cross-docking / Ultra-low
                          coverage
                                                    51%        R54 828    5.61%      4.88%        In SA, we have also noted flat to slight decreases in
UK total                                           100%        R43 961    5.57%      4.89%         market rental assumptions and the forecasts for
                                                                                                   rental growth
 Results Presentation | August 2020                                                                                                                  40
NET DEBT DASHBOARD

                                   Loan-to-value                                                                                              Expiration of debt facilities
     35.00

                                                               29.5                 LTV has                 Weighed average
     30.00             27.3                                                                                                                                              17.5%
                                                                                                           debt maturity is 3.5                              5.0%                   FY21
                                            26.1                                   remained
     25.00                                                                      below the mid-              years at Aug-20,          39.9%                                         FY22

                                                                                  point of the             largely in line with                                                     FY23
     20.00
                                                                                target range of               Aug-19 at 3.6                                                         FY24
                                                                                                                                                        16.2%            21.4%
     15.00                                                                        25% - 35%                       years                                                             FY25 and after
                     Aug-19                Feb-20             Aug-20
                                             %

                                                                                         Debt maturity profile
                         2,000

                         1,500
                   R'm

                                                                                                                                                                                 Undrawn facilities
                         1,000
                                                                                                                                                                                 Outstanding debt
                          500

                              -
                                  Aug-20            Aug-21             Aug-22            Aug-23           Aug-24             Aug-25            Aug-26               Aug-27

                                                    Debt maturities extend until FY27 with less than 25% of debt facilities expiring in the next two years
Results Presentation | August 2020                                                                                                                                                                    41
NET DEBT DASHBOARD

                                              All-in cost of debt                                      R1.1bn of                           Available liquidity
                        10.00                                                                          available                      (cash and undrawn facilities)
                                                         8.7                                        liquidity (cash            2.0
 All-in ZAR and           9.00                                                8.6                                                                                      1.6
   GBP cost of            8.00        7.6                                                            and undrawn
                                                                                                                                                                       0.5
 debt continues                                                                                   facilities) at Aug-

                                                                                                                        R'bn
                          7.00                                                                                                 1.0
    to fall with                                                                            5.9   20, increasing to                    1.4            1.4
                                                                     5.8                                                                                               1.1
                          6.00                    5.4                                                  R1.6bn in
   falling global
                                                                                                                               0.0
  interest rates          5.00                                                                          Sep-20
                                                                                                                                      Aug-19         Feb-20           Aug-20
 but also due to          4.00
      notable                               2.7                2.7                    2.7
                          3.00
  decreases in
 credit margins
                          2.00                                                                                                          Unencumbered properties
        due to            1.00                                                                       R3.2bn of                 25.0
                                                                                                                                                      19.3             20.3
improved credit                                                                                       portfolio                20.0     18.5
                            -
 metrics both in                        Aug-20              Aug-19                Feb-20          unencumbered                 15.0
 SA and in the                                                 %                                   at Aug-20, up

                                                                                                                        %
                                                                                                                               10.0
         UK                                                                                       from R2.9bn at
                                        All-in ZAR effective fixed cost of debt                                                 5.0
                                                                                                      Feb-20
                                        All-in GBP effective fixed cost of debt
                                                                                                                                0.0
                                        All-in effective average fixed cost of debt                                                   Feb-19         Feb-20           Aug-20

 Results Presentation | August 2020                                                                                                                                            42
FINANCIAL RISK MANAGEMENT

Foreign exchange rate risk                                                                                    CCIRS utilisation
  Hedging net investment in foreign operation                                                 50.0                                                    24.00

                                                                                              45.0                                                    23.00
   The group has continued to reduce its hedge cover over its net
                                                                                                                                                      22.00
    investment into the UK in anticipation of ZAR weakness                                    40.0

                                                                                                                                                              GBPZAR exchange rate
                                                                                                      36.3

                                                                      CCIRS utilisation (%)
                                                                                                                                                      21.00
   The sharp depreciation in the ZAR over the past six months                                35.0

    provided NAV upside which the group has benefited from                                    30.0                       29.0
                                                                                                                                                      20.00
                                                                                                                                            27.6
                                                                                                                                                      19.00
   Heightened levels of ZAR weakness can present an opportunity                              25.0
    to protect the group from NAV erosion in future                                                                                                   18.00

                                                                                              20.0
                                                                                                                                                      17.00
   Internal policy limit of 45% CCIRS utilisation as percentage of
                                                                                              15.0
    foreign denominated assets over time                                                                                                              16.00

                                                                                              10.0                                                    15.00
   CCIRS utilisation is 27.6% at Aug-20, down from 29.0% at                                         Feb-19            Feb-20              Aug-20

    Feb-20                                                                                               CCIRS hedged of foreign denominated assets
                                                                                                         Spot GBPZAR exchange rate

 Results Presentation | August 2020                                                                                                                                                  43
FINANCIAL RISK MANAGEMENT

Foreign exchange rate risk                                                                                                                   Hedging GBP distributable earnings
 Hedging distributable earnings and cash flow risk                                                                               R25.00                                                                            100.00

                                                                                                                                                                                                     R24.00
                                                                                                                                 R24.00                                                                            90.00
                                                                                                                                                85.00
  The group employs a FX hedging strategy for GBP distributable earnings
                                                                                                                                                                   80.00
                                                                                                                                 R23.00                                                                            80.00
  The FX hedging strategy ensures that shareholders obtain medium- and

                                                                                                          GBPZAR exchange rate
                                                                                                                                                                                R22.07
   long-term hard currency exposure over time

                                                                                                                                                                                                                            Hedging level (%)
                                                                                                                                 R22.00                                                   R22.04                   70.00
                                                                                                                                                                        R21.25
                                                                                                                                                        R20.95
  The group continues to utilise natural hedges to minimise its exposure                                                                                                            60.00
                                                                                                                                 R21.00                                    R20.95                                  60.00

  The group has therefore instituted a hedging policy for GBP distributable                                                                          R20.38
                                                                                                                                 R20.00                                                              47.50         50.00
   earnings to be earned as follows:
       Six-month period               Effective hedging   Blended participation   Blended participation                          R19.00                                                                            40.00
            ended                            level               floor                    cap

       28 February 2021                    85.0%                R20.38/£                R20.95/£                                 R18.00                                                                            30.00
        31 August 2021                     80.0%                R20.95/£                R21.25/£
       28 February 2022                    60.0%                R22.04/£                R22.07/£                                 R17.00                                                                            20.00
                                                                                                                                             28-Feb-21           31-Aug-21        28-Feb-22        31-Aug-22
        31 August 2022                     47.5%                R24.00/£                R24.00/£
                                                                                                                                     Effective hedging level        Blended participation floor     Blended participation cap

 Results Presentation | August 2020                                                                                                                                                                                         44
FINANCIAL RISK MANAGEMENT

Interest rate risk
                                                                                                        Interest rate hedging
 Hedging interest rate exposure

                                                                                                                                                                 105.6%
  The group has continued to use a combination of natural hedges        31-Aug-19
                                                                                                                                         77.8%
   and derivative financial instruments to hedge its exposure to
   interest rate risk
                                                                                                                                                     93.3%
  Hedged 95.6% and 86.9% of the interest rate risk associated with      29-Feb-20
                                                                                                                                                         96.6%
   existing term loan balances and total contracted net future capital
   floating debt respectively
  Above minimum target hedging levels of 80% and 70%                                                                                                 95.6%
   respectively                                                          31-Aug-20
                                                                                                                                                 86.9%

  Hedging levels remain well above minimum target levels to lock-in
   interest rates in South Africa and the UK at all-time lows                    0.0%         20.0%        40.0%       60.0%          80.0%         100.0%          120.0%

                                                                                Hedge cover of term loan balances   Total effective interest rate risk exposure hedged

 Results Presentation | August 2020                                                                                                                                       45
FOCUS ON
  ESG
ESG RISK RATING

ESG risk rating

 •     We embarked on a comprehensive process to assess
       our business across the ESG spectrum to focus our                                         Score    Negl     Low    Med   High   Severe
                                                                                                          0-2       2-4   4-6   6-8      8+
       sustainability efforts in various areas across the group
                                                                  Corporate Governance            3.5
 •     We obtained a risk rating from a leading global firm,
       Sustainalytics, who assessed our ESG performance in        ESG Integration - Financials    5.3
       five areas according to their verification:
                                                                  Product Governance              3.7
          •     Corporate Governance
          •     Integration in Financials                         Human Capital                   2.9
          •     Product Governance
          •     Human Capital                                     Business Ethics                 2.0
          •     Business Ethics
                                                                   Sustainalytics ESG risk rating – Equites 2020
 •     We managed to achieve a risk rating of “low risk”
       overall, relative to peers in the top third global REIT
       industry

 Results Presentation | August 2020                                                                                                             47
ESG FOCUS AREAS

Sustainability-linked funding
                                                                                       Ethics
                                                                                                                   Environmental
•     We secured our first sustainability-linked facility during the                                               consciousness
      period ended 31 August 2020 of R1.6bn, pioneering this
      type of funding in the REIT sector in South Africa               Community
                                                                       upliftment
•     Our all-in cost of debt on this facility will be reduced if we
      achieve certain predefined improvements to our                                            Equites ESG
      Sustainalytics ESG risk rating                                                            focus areas
                                                                                                                        Customer
•     The focus areas for the improvements are aligned to the 6                                                         centricity
      existing sustainability focus areas within the company and
      further supports our initiatives towards creating a                Educational
      meaningful impact in multiple aspects of the ESG                   initiatives
      spectrum                                                                                                Human
                                                                                                              capital

    Results Presentation | August 2020                                                                                         48
UK STRATEGY
OUR APPROACH
                                                                                   UK STRATEGY
                                                                               TO ESG

UK strategy
Our UK platform consists of two different, yet complementary businesses
    Direct property portfolio                                                 Newlands strategic partnership

    •     Portfolio of completed assets in the UK,       Direct portfolio     •   Joint venture established between
          curated through acquisitions between 2016                               Equites and Newlands with Equites
          and 2020                                                                holding 60% and Newlands holding 40%

    •     Direct property portfolio comprises 11                              •   Newland’s strength lies in their ability to
          assets with portfolio value of R6.3 billion                             unlock strategic land for development

    •     Combination of “Last-mile” and big-box                              •   Target pipeline of £400m in the next 19
                                                          Newlands JV
          logistics facilities                                                    months with further value to be unlocked
                                                                                  over the 7-year agreement
    •     Total GLA of portfolio is 178,000m2
                                                                              •   Focus on developments of big-box
    •     Portfolio initial yield of 5%                                           logistics and last-mile facilities in the UK

 Results Presentation | August 2020                                                                                      50
OUR APPROACH
                                                                                             NEWLANDS
                                                                                        TO ESGVENTURE

Newlands: Structure of relationship
                                                                                                                           Newlands
                                                                            Equites Property                   40%       Developments
•       The venture represents a strategic relationship between       60%    Fund Limited                                    LLP
        Equites and Newlands Developments

•       Equites will provide funding for land acquisitions (or
        options) and developments in the initial stages

•       Newlands will reinvest 50% of any development profits                                      Equites
                                                                                         ENGL      Newlands Group
        into the joint venture to ensure alignment of interests                                    Limited

•       ENGL will sell completed developments into an Equites
        SPV where Equites’ share of the development profit will
        be retained thereby ensuring a discount to open market
        value
                                                                                                                  Sell
•       ENGL will also undertake developments which may not be                                               developments
                                                                                         Sell completed
        retained (should it not meet Equites’ investment criteria),                       developments      in open market
        thereby enabling Equites to recycle capital efficiently                          to Equites SPV       and recycle
                                                                                                                capital

    Results Presentation | August 2020                                                                                            51
OUR APPROACH
                                                                                                                                NEWLANDS
                                                                                                                           TO ESGVENTURE

Equites will benefit from 60% of the development profit/fair value uplift

                                Gross yield                     Net yield
                                                                                                                     Gross capital uplift              Net capital uplift

          7.0%                                                                                         50%

          6.5%
                                                                                                       40%
          6.0%

                                                                                    Valuation uplift
                                                                                                       30%
 Yields

          5.5%
                                                                                                       20%
          5.0%

          4.5%                                                                                         10%

          4.0%                                                                                         0%
                  5.50%         5.75%        6.00%           6.25%          6.50%                               5.50%         5.75%       6.00%          6.25%              6.50%
                               Development yield on cost (rent / cost)                                                      Development yield on cost (rent / cost)

                 I.e., if ENGL develop at a 6.0% yield on cost, Equites will                                 I.e., post ENGL’s 40% share in the development margin
                   effectively take control of the asset at a 5.3% yield and                                   (net basis), if the development is executed at a 6.0%
                  can then either sell the asset or retain control of it. This                                  yield on cost, Equites will get a 20% uplift in capital
                   assumes that the asset will re-rate to a 4.5% cap rate                                    value upon completion assuming the asset will re-rate to
                                                                                                                                    a 4.5% cap rate

 Results Presentation | August 2020                                                                                                                                                 52
NEWLANDS
DEVELOPMENTS
OUR APPROACH
                                                                              NEWLANDS
                                                                         TO ESG
                                                                              DELIVERING

Peterborough Gateway - last mile fulfilment centre

•       E-commerce retailer last mile fulfilment centre with GLA of
        12 855m² (138 371 sq. ft.)

•       Includes 800 van multi-storey parking for HGV’s with
        focus on sustainability to future proof the facility

•       User is in the process of rolling out a programme of these
        facilities across the United Kingdom

•       Capital value of c.£ 45million

•       Terms have been agreed with counterparties, awaiting
        final signature

    Results Presentation | August 2020                                                     54
OUR APPROACH
                                                                       NEWLANDS
                                                                  TO ESG
                                                                       DELIVERING

Hoyland, South Yorkshire

•       Hermes – Transaction agreed in principle; legal
        agreements being finalised

•       Super hub for Hermes with a second plot for pre-let
        opportunity

•       Total GLA of facility at 31 570m² (339 821 sq. ft.)

•       Agreement with Hermes for 20-year lease

•       Capital value of c.£ 80 million on completion

•       Terms have been agreed with counterparties, awaiting
        final signature

    Results Presentation | August 2020                                              55
OUR APPROACH
                                                                            NEWLANDS
                                                                       TO ESG
                                                                            DELIVERING

Basingstoke Gateway

•       Basingstoke is ideally located to house “last-mile”
        fulfilment centers

•       In negotiations with an e-commerce retailer to develop a
        £200 million freehold facility (largest plot on the plan)

•       Terms have been agreed with counterparty for the largest
        plot, awaiting final signature

•       Initial discussion regarding logistics last-mile delivery
        facility taking 50% of the remaining land

    Results Presentation | August 2020                                                   56
OUR APPROACH
                                                                                                           OPERATING
                                                                                                      TO ESGCONTEXT

Key trends driving UK logistics market
                                       COVID 19                      Customer                            Green
                                        effect                       Experience                         Agenda

                                      • Acceleration of e-           • DPD is a market leader        • September 2020 was the
                                        commerce and logistics                                         first time more electric cars
                                        “swing” from retail          • Amazon’s latest strategy        (incl. PHEV) sold than
                                                                       with last-mile fulfilment       diesel
                                      • JLL report that by end of      facilities
                                        Q320, market take up had                                     • Planning focus
                                        met 2019 levels              • Parcel return hubs
                                                                                                     • Occupier focus e.g. electric
                                      • Rental growth and yield      • Newlands being                  van facilities
                                        compression is evident         approached to work with
                                                                       occupiers on accelerating
                                      • 20-year lease to Amazon is     pipeline
                                        trading at sub 4%

 Results Presentation | August 2020                                                                                                    57
PROSPECTS
Prospects

                      While the effects of COVID are still unfolding, we are
                      confident that we have effectively managed the first-
                      round impacts of the pandemic

                          We have amassed a portfolio which will continue to
                          be resilient in the face of adversity

                                               Collections remain robust, and the properties
                                               are testament to the defensiveness
                                               provided by the logistics asset class

                                   For this reason, the board expects the company to
                                   achieve full year distribution per share growth of
                                   2% - 4%*

*This guidance is based on the assumptions that a stable macro-economic environment will prevail, no major corporate
 failures will occur, the GBP/ZAR exchange rate remains materially unchanged and tenants will be able to absorb the
recovery of rising utility costs and municipal rates. This forecast has not been audited or reviewed by Equites’ auditors.
QUESTIONS
You can also read