Debt Investor Update Stable operating half-year results support higher risk provisioning - despite uncertainty from COVID-19, pbb confident to ...

 
CONTINUE READING
Debt Investor Update Stable operating half-year results support higher risk provisioning - despite uncertainty from COVID-19, pbb confident to ...
Debt Investor Update
Stable operating half-year results support higher risk provisioning
– despite uncertainty from COVID-19, pbb confident to achieve
solid full-year result
Disclaimer

 This presentation is not an offer or invitation to subscribe for or purchase any securities in any jurisdiction, including any jurisdiction of
  the United States. Securities may not be offered or sold in the United States absent registration or pursuant to an available exemption
  from registration under the U.S. Securities Act. Deutsche Pfandbriefbank AG (pbb) does not intend to conduct a public offering of
  securities in the United States.
 No warranty is given as to the accuracy or completeness of the information in this presentation. You must make your own
  independent investigation and appraisal of the business and financial condition of pbb and its direct and indirect subsidiaries and their
  securities. Nothing in this presentation shall form the basis of any contract or commitment whatsoever.
 This presentation may only be made available, distributed or passed on to persons in the United Kingdom in circumstances in which
  section 21(1) of the Financial Services and Markets Act 2000 does not apply.
 This presentation may only be made available, distributed or passed on to persons in Australia who qualify as 'wholesale clients' as
  defined in section 761G of the Australian Corporations Act.
 This presentation is furnished to you solely for your information. You may not reproduce it or redistribute to any other person.
 This presentation contains forward-looking statements based on calculations, estimates and assumptions made by the company’s top
  management and external advisors and are believed warranted. These statements may be identified by such words as ‘may’, ‘plans’,
  ‘expects’, ‘believes’ and similar expressions, or by their context and are made on the basis of current knowledge and assumptions.
  Various factors could cause actual future results, performance or events to differ materially from those described in these statements.
  Such factors include general economic conditions, the conditions of the financial markets in Germany, in Europe, in the United States
  and elsewhere, the performance of pbb’s core markets and changes in laws and regulations. No obligation is assumed to update any
  forward-looking statements.
 By participating in this presentation or by accepting any copy of the slides presented, you agree to be bound by the noted limitations.

Investor Update based on results Q2/H1 2020 (IFRS, pbb Group, unaudited, but reviewed), September 2020                                         2
Business Model & Strategy
pbb is a leading commercial real estate lender with a complementary
public investment finance business

                               USPs                                                                                  Key figures
                                                                                                                     (IFRS, 30/06/2020)
                                Specialised on-balance sheet lender with extensive placement capabilities
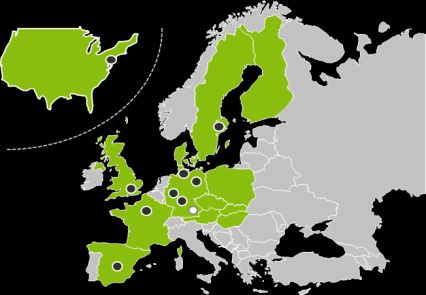
                                Strong franchise with long-standing client relationships and local presence         Total assets             € 60.7 bn
                                 with 10 branches/rep offices in Europe and the US
                                                                                                                     Total equity              € 3.7 bn
                                Conservative lending standards and focus on risk management                         RWA                      € 17.4 bn
                                Pfandbrief is main funding instrument                                               CET1 ratio1                 15.8%
                                                                                                                     Leverage ratio1              5.1%
                                                                                                                     RoE before taxes             1.6%
                                                                                                                     FTE                           763

               FUNDING                                                                   LENDING
                                                                                                                     Regional presence
   Stable, well diversified funding base                                        Pfandbrief-eligible senior loans
         Pfandbrief                                                             Structuring expertise for
         Senior unsecured bonds                                                  complex/large transactions
         Retail deposits (online)                                                   ~160 - 200 deals per year                   USA
   Strong capital markets presence                                                  Avg. deal size € ~40 - 60 mn
    (benchmarks/private placements)

                                           Value Proposition for Debt Investors
                                            Considerable MREL buffer
                                            Strong capital base
                                            High quality cover pools                                                                     Headquarter

                                            High portfolio quality and risk standards                                                    Branches/Rep. Offices

                                            Strong operating performance
 1 Excl. interim result, incl. full-year result 2019

Investor Update based on results Q2/H1 2020 (IFRS, pbb Group, unaudited, but reviewed), September 2020                                                            3
Operating and financial overview

  New business                                                                    Q4       Net interest and commission income                                              Q4       General and admin. expenses                                                     Q4
  € bn (commitments, incl. extensions >1 yr)                                      Q3       € mn (IFRS)                                                                     Q3       € mn (IFRS)                                                                     Q3
                                                                                  Q2                                                                                       Q2                             44%              43%                    46%               Q2
                                                                                  Q1                                                                                       Q1                 CIR1                                                                  Q1

                10.5                                                                                       456                    464                                                                                       202
                                                                                                                                                                                                     193
                                       9.3
                                                                                                           118                    119                                                                                        61
                 4.7                   2.1                                                                                                                                                            57

                                                                                                           115                    113                    231                                                                 48                      97
                                       2.6                                                                                                                                                            48
                 2.1
                                                              2.8                                          115                    115                    118                                          44                     47                      49
                 2.0                   2.6
                                                                 1.1
                 1.8                   2.0                 1.7                                             108                    117                    113                                          44                     46                      48

               2018                   2019                 H1/20                                          2018                   2019                  H1/20                                        2018                   2019                 H1/20

  Portfolio                                           VP            PIF         REF        Net income from risk provisioning                                     Stage 1&22         Pre-tax profit                                                                  Q4
  € bn (financing volumes)                                                                 € mn (IFRS)                                                                              € mn (IFRS)
                                                                                                                                                                 Stage 3                                                                                            Q3
                                                                                                                                                                                                     7.1%                 6.9%
               72%                    73%                    73%          Share of                                                                               Other3             RoE b.t.4                                                                       Q2
                                                                          strategic                                                                                                                                                              1.6%
                                                                          portfolio                                                                                                                                                                                 Q1
                46.4                  45.5                   44.5                                                                                                                                    215                    216
                                                                                                          4 1                          1                   1                                                                 29
                13.2                  12.1                                                               -19                   -17                                                                    44
                                                             11.8
                                                                                                            -14                                                                                       49                     70
                 6.4                   6.3                    6.0                                                                 -33                    -59

                                                                          Strategic                                                                                                                   74                     69
                                                                          portfolio
                                                                                                                                  -49                    -12
                26.8                  27.1                   26.7                                                                                                                                                                                    31
                                                                                                                                                         -70                                          48                     48                       29
                                                                                                                                                                                                                                                 2
                                                                                                          2018                   2019                  H1/20
               2018                   2019                  06/20                                                                                                                                   2018                   2019                 H1/20

Note: Figures may not add up due to rounding    1 New definition: CIR = (GAE + net income from write-downs and write-ups on non-financial assets)/operating income 2 Incl. provisions in off balance sheet lending business 3 Recoveries from written-off financial assets
4 After AT1 coupon (2018: pro-rata € 12 mn; 2019: € 17 mn; H1/20: pro-rata € 9 mn) assuming full payment of the discretionary coupon

Investor Update based on results Q2/H1 2020 (IFRS, pbb Group, unaudited, but reviewed), September 2020                                                                                                                                                                  4
New business
Lower REF new business volume in the light of COVID-19 pandemic, but significantly higher
gross interest margins

 REF New business                                                                                                                REF new business
 € bn (commitments, incl. extensions >1 yr)
                                                           27.1                                     26.7                                                                                                           H1/19             FY19               H1/20
                      26.8
 Financing                                                                                                                                             Total volume (€ bn)                                                4.4                 9.0                2.7
 volume                                                                                                                                                                  thereof:
                    9.5                                     9.0                                                                                                          Extensions >1 year                               0.9                 1.9                1.0
                                                            2.1                                                                                        No. of deals                                                        76                 155                59
   Q4               4.0
                                                                                                                                                       Avg. maturity                  (years)1                          ~4.9                ~4.6            ~3.7
                                                            2.5                                                                                        Avg. LTV (%)2                                                       57                  58                54
   Q3               1.9
                                                                                                    2.7                                                Avg. gross interest margin (bp)                                 >140                 ~155            >175
   Q2               1.9                                     2.5
                                                                                                          1.1
   Q1               1.7                                     1.9                               1.6                                                                                    Regions                                    Property types
                  2018                                     2019                                  H1/20
                                                                                                                                                                             H1/20: € 2.7 bn                       H1/20: € 2.7 bn
                                                                                                                                                                                                                            Mixed use/
 Key drivers Q2/H1 2020:                                                                                                                                                                   Other3                                other

                                                                                                                                                 (Commitments, incl.
                                                                                                                                                 extensions > 1year)
                                                                                                                                  New business
                                                                                                                                                                            Nordics 4%
                                                                                                                                                                                              9%
  Lower REF new business volume (Q2/20: € 1.1 bn; H1/20: € 2.7 bn) in the                                                                                                       UK                                       Hotel      11%
                                                                                                                                                                                      7%                                          10%
   light of COVID-19 pandemic, but at significantly higher gross interest
                                                                                                                                                                            France    9%            47% Germany                                 44% Office
   margins                                                                                                                                                                                                           Logistics/ 11%
                                                                                                                                                                                                                       storage
       Overall lower investment activity in Q2/20 – continued selective                                                                                                               11%                                       5%
                                                                                                                                                                               CEE            13%                    Residential    19%
        approach with focus on conservative risk positioning (avg. LTV 54%2)
       Only small prepayments in Q2/20, but higher share of extensions                                                                                                                    USA                                    Retail
        (H1/20: 36%; 2019: 21%)
         No forced extensions                                                                                                                                                30/06/20: € 29.2 bn                 30/06/20: € 29.2 bn
         No new loan commitments in property types Hotel and Retail
                                                                                                                                                                                           Other                            Hotel 5% Mixed use/other 4%
            in Q2/20 – only extensions at conservative conditions                                                                                     (EaD, Basel III)
                                                                                                                                                                            Nordics 5%                                 Logistics/
       Avg. REF gross interest margin up to >175 bp (Q2/20 >185 bp; Q1/20:
                                                                                                                                        Portfolio

                                                                                                                                                                                            9%
                                                                                                                                                                            CEE 6%                                       storage
                                                                                                                                                                                                                                   10%
        >170 bp; 2019: ~155 bp), reflects positive margin development since
        mid 2019 and pbb’s better negotiation position as a result of COVID-19                                                                                               USA     10%            48% Germany                                     47% Office
                                                                                                                                                                                                                    Residential 18%
       Good deal pipeline – higher new business volume expected for H2/20                                                                                                            11%
        vs. H1/20 at elevated margin level                                                                                                                                   France         11%                                         16%

  PIF new business remains low (H1/20: € 0.1 bn) in line with strategy                                                                                                                  UK                                        Retail

Note: Figures may not add up due to rounding   1 Legal maturities   2 New commitments; avg. LTV (extensions): H1/20: 52%; H1/19: 48%, 2019: 55%                               3 Netherlands

Investor Update based on results Q2/H1 2020 (IFRS, pbb Group, unaudited, but reviewed), September 2020                                                                                                                                                                 5
Markets
Sub-segments in special focus – unchanged conservative positioning, but recovery phase
will persist beyond 2021

   REF portfolio: Property types                                               pbb                                                                                Expectation of market development1
   30/06/2020: € 29.2 bn (EaD, Basel III)
                                                                               Hotel
                                                                                  Selective approach – focus on business hotels                                     Despite Hotels being allowed to reopen, the recovery of occupancy
                                               Industrial/                        Portfolio volume of € 1.4 bn
                            Others 4%                                                                                                                                 rates and RevPar3 will take time due to high hygiene standards, the
                                               Logistics                          Avg. LTV of 53%2 / avg. ISC >300%2                                                 continued implementation of travel restrictions and fear of regional
                                                                                  Key regions Germany (46%) and UK (42%)                                             outbreaks with regional lockdowns
                                         10%
                                                                                                                                                                     A recovery to previous year's level is not expected prior to 2022
              Office 47%                       16% Retail                                                                                                            Market values and lease/rentals expected to decrease

                                               5%                              Retail
                                         18%         Hotel                     Selective approach – long identified structural weakness of                        Declining consumer purchasing power leads to temporary reduction
                                                                                Shopping Centres and Retail Parks led to foresighted                                or partial loss of rents and allocable costs
                                          Residential                           reduction of sub-segment by >30% since 12/16                                       Mega trends (i.e. e-commerce) accelerating
                                                                               Portfolio volume of € 4.7 bn                                                         Increased pressure on shopping centers (decline in rents, shorter
                                                                               Avg. LTV of 51%2 / avg. ISC >300%2                                                    terms, etc.)
                                                                               Diversified portfolio with focus on Germany (29%), UK (24%)                          Largely stable development expected for discounters and retail
    REF portfolio: Loan types                                                   and CEE (18%)                                                                         parks with strong local demand
             Derivative < 1%                                                                                                                                         High street properties (prime locations in A-cities) expected to see
                                                                                                                                                                      moderate declines in rents and slight rise in yields
                                                    Development
                                      16%                                                                                                                            Downward trend in secondary locations and smaller cities
                                    1%                                                                                                                                expected to intensify

                                                                               Development
                                                                               Very selective approach, e.g. pre-letting/pre-sales with long                      In a few cases some delays observed, but no general standstill due
         Investment           83%                                               stop dates in lease and sales contracts which provide for                           to COVID-19
                                                                                comfortable buffers in terms of delays in construction
                                                                               Portfolio volume € 4.7 bn
                                                                               Focus on Office (53%) and Residential (24%) mainly in
                                                                                Germany (78%) and France (13%)
    REF portfolio: Countries
                                           UK                                  USA
                                                                               Specific COVID-19 situation observed                                               Sharp rise in unemployment expected to lead to increasing loss of
                                         11%        France                     Focus on Office (70%) and Residential (22%) properties in                           rental income and decline in prices for residential properties
                                           11%                                  NY, Boston, Washington, Chicago, Seattle, San Francisco                            Current job figures give hope that the impact of unemployment
         Germany 48%                                                            and Los Angeles                                                                     rates is only a short term effect and residential market is not that
                                             10% USA                           Only investment loans, no developments                                              strongly affected
                                         5% 6%                                 Portfolio volume of € 2.8 bn                                                       In general, US market expected to remain attractive for domestic
                                                                               Avg. LTV of 56%2 / avg. ISC >200%                                                   and foreign investors due to size and high liquidity
                                     9%          CEE
                                                                                                                                                                   Market value adjustments in the light of COVID-19
                                               Nordics
                                   Other
1 Source: pbb property market analysis     2 Based on performing investment loans only, COVID-19 effects not yet fully reflected   3 revenue per available room

Investor Update based on results Q2/H1 2020 (IFRS, pbb Group, unaudited, but reviewed), September 2020                                                                                                                                       6
Portfolio
pbb’s business approach reflected in stable risk parameters
NPL ratio remains on low level

 REF Portfolio: Avg. weighted LTVs                                                                                               Non-performing loans
 % (commitments)1                                                                                                                € mn (EaD, Basel III)                          0.9%                                               0.9
                                                                                                                                                                                                                                                   Workout2
                                                                                                                                                                                                        0.8%
                                                                                                                                                                                                                                                   Restructuring3
           64%                                                                                                                                            0.3
                                                                                                                                 NPL ratio4                                      510                                               500
                                                                                                                                                                                                         460
                                                                                                                                                                                  15                                               14
                                                                                                                                                                                                          15
                                   58%                                                                                                                   205
                                                                                                                                                              16                 495                     445                       486
                                                                                                                                                      189
                                                            53%
                                                                                     52%                                                                06/19                  12/19                   03/20                   06/20
                                                                                                                                 Key drivers Q2/H1 2020
         12/13                   12/155                    12/19                    06/20                                         Non-performing loans (NPLs) up by € 40 mn in Q2/20 (06/20: € 500 mn)
                                                                                                                                      Restructuring loans up to € 486 mn (03/20: € 445 mn)
                                                                                                                                            € 53 mn newly added UK loan (Hotel) triggered by performance
                                                           57% 56%                                                                           covenant breach, but no provisioning required due to sufficient
                                                                                       56% 56%             Avg. LTV:
                53% 53% 54% 52%                                          54% 53%                                                             collateral (cash trapped, loan amount well covered by current property
  52%
         50%                                 50% 51%                                                        03/20: 53%                       value even considering sale under pressure)
                                                                                                            06/20: 52%
                                                                                                                                            € 13 mn reduction from FX effects (GBP) and repayments
                                                                                                                                            € 67 mn ECA covered loan already successfully restructured, but still
                                                                                                                                             in probationary period (“Wohlverhaltensphase”)
  Germany           UK          France        Sweden         Poland        Rest of         USA                     03/20
                                                                           Europe
                                                                                                                   06/20
                                                                                                                                      Workout loans stable at only € 14 mn (03/20: € 15 mn)
                                                                                                                                      NPL ratio3 of 0.9% remains on low level (03/20: 0.8%)
                                                                         59% 58%
                                                                                                                                  In some cases forbearance measures agreed (= extensions of
54% 53%                                     55%
                             52% 51%               53% 53% 53%                               53%                                   amortisations) upon request of customers
                                                                                                            03/20: 53%
              50% 49%
                                                                                       48%                  06/20: 52%
                                                                                                                                    Waivers from COVID-19 mostly related to changes in covenant structures
                                                                                                                                       and delay ("Stundung") of amortisation
                                                                                                                                    Focus on individual solutions helping clients over present COVID-19
                                                                                                                                       situation – agreements often include support elements from sponsor side
  Office     Residential       Retail       Logistics/       Hotel      Mixed Use        Others                                     Strict adherence to pbb’s overall risk standards
                                             storage
Note: Figures may not add up due to rounding 1 Based on performing investment loans only, values not reflecting corona effects   2 Internal PD class 30: No signs that the deal will recover soon, compulsory measures necessary   3 Internal PD class 28+29:
Payments more than 90 days overdue or criteria acc. to respective policy apply 4 NPL ratio = NPL volume / total assets

Investor Update based on results Q2/H1 2020 (IFRS, pbb Group, unaudited, but reviewed), September 2020                                                                                                                                                          7
Funding
Strong funding activities pre COVID-19 pandemic at attractive levels – further optimised by
participation in TLTRO III

New long-term funding1
€ bn
                                                                                                                                                             Funding H1/2020

                        H1/19: € 4.2 bn                                                          H1/20: € 2.4 bn2                                             Strong funding activities at relatively stable avg. funding
                                                                                                                                                               spreads y-o-y – H1/20 funding targets fully met

Spread                                                                                                                                                             Pfandbrief volume optimised with respect to TLTRO III
                   16             21            74                                           13              5              76
(avg,   bp)3                                                                                                                                                        funding
                                                                                                                                                                        € 1.2 bn (one € 750 mn benchmark plus taps)
Tenor             6.9            16.1           5.3                                         6.9           15.2              5.7                                         SEK 400 mn Mortgage Pfandbrief issued in January
(avg, yrs)4                                                                                                                                                             € 1.4 bn “own use” issued as collateral for TLTRO III

                   2.1                                                                                                                                             Senior Unsecured issuance with strong focus on senior
                                                                                                                                                                    preferred bonds in both EUR and SEK
                                                1.8                                                                                                                     € 0.3 bn floater benchmark issued in January
                   0.7                                                                                                                                                  Strong private placement activities with € 0.7 bn
                                                                                                                                                                        SEK 1.3 bn issued in three bonds

                                                0.9                                          1.2
                                                                                             0.1                            1.1                               € 7.5 bn participation in TLTRO III to optimise funding costs

                                                                                                                                                              pbb direkt – total volume stable at € 2.8 bn (12/19:
                   1.4                                                                                                      0.8
                                                                                                                                                               € 2.8 bn); average maturity5 decreased slightly to 3.9 years
                                                                                             1.2
                                                0.9                                                                                                            (12/19: 4.2 yrs)
                                 0.3
                                                                                                             0.1
                                 0.3                                                                                        0.3
                                                                                                             0.1                                              ALM profile and liquidity position remain comfortable
                                                                                                                                                               (NSFR >100%; LCR >150%)
               Mortgage Public Unsecured                                                Mortgage Public Unsecured
                  Pfandbrief                                                               Pfandbrief

                                                                     Private placements
                                                                     Benchmark issuances

Note: Figures may not add up due to rounding   1 Excl. retail deposit business   2 Excl. “own use” Pfandbriefe issued as collateral for TLTRO III   3 vs. 3M Euribor   4 Initial weighted average maturity   5 Initial weighted average maturity of term deposits

Investor Update based on results Q2/H1 2020 (IFRS, pbb Group, unaudited, but reviewed), September 2020                                                                                                                                                              8
Funding
Strong buffers from pre- COVID-19 pandemic funding activities and new funding provide for
sufficient liquidity position into 2021 – attractive substitutes to wholesale funding available

New long-term funding1                                                                                                                 Strong liquidity buffers
€ bn                                                                                                                                    No major impact from credit lines – pbb’s business model
                                                                                                                                         not exposed to corporates drawing down liquidity
                                                                                                     Reduced need
  Funding surplus from                                     Strong funding                                                               LCR remains well above 150%
                                                                                                     for wholesale
  2019, esp. unsecured                                        in H1/202
                                                                                                     funding                            Liquidity reserve sufficient to cover even internal stress test
                                                                                                                                         well beyond 6 months
       Pfandbriefe
                                                                                                                                       Attractive funding sources available
       Unsecured
                                                                                                                                        Pfandbriefe being a resilient funding source – market is
                                                                                                                                         open and absorption of covered bonds by ECB (both,
                                 6.8                                                                                                     through QE and TLTRO) keeps costs down
                                                                                                          Pre-crisis                    Strong demand for Private Placements (focus on senior
                                                                                                        target range                     preferred)
         5.2                                                                                                                            Retail deposit funding channels established and scalable
                                 3.2
                                                                                                                                           In 2019, deposit volume reduced as wholesale senior
                                                                                                                                            unsecured funding was cheaper
                                                                                                                                           In 2020, wholesale funding need can be reduced by
         3.6                                                                                                                                increasing deposit base again
                                                                                                                   Ability to reduce
                                                                                                                   and/or substitute    TLTRO III provides an attractive (currently as low as
                                                                       2.4                                         wholesale funding     -1.00%) and flexible source of funding (maturities until March
                                 3.6                                                                                                     2024, flexible repayment possible after one year)
                                                                       1.3
                                                                                                                                        USD funding via ECB at attractive rates
         1.6
                                                                       1.1                                                             H2/20 funding plans depending on market conditions
       2018                    2019                                  H1/20                                  2020                        Limited Senior Preferred demand to be covered by Private
                                                                                                                                         Placements
                                                                                                                                        Euro-Pfandbriefe used as collateral for TLTRO III (possibly
                                                                                                                                         USD/GBP issues to match currencies)
                                                                                                                                        Framework in place for issuance of Green Bonds –
                                                                                                                                         inaugural Benchmark issuance depending on market
Note: Figures may not add up due to rounding      1 Wholesale funding only, excl. retail deposit business                                sentiment, in context of limited unsecured funding needs
2 Excl. “own used” Pfandbriefe issued as collateral for TLTRO III

Investor Update based on results Q2/H1 2020 (IFRS, pbb Group, unaudited, but reviewed), September 2020                                                                                                 9
Funding
Ambition level for Own Funds and Eligible Liabilities of more than 8 % TLOF
(in € as of 30/06/2020)1

                                                            Composition of
                     MREL2                                    Liabilities                                                       Rundown
                  (30/06/2020)                                   (30/06/2020)
                                                      € ~ 13.7 bn
                                                                                                                                                                                               Substantial buffer for Senior Preferred
                                                                                                                                                                                                (SP) investors due to high volume of
                                                                                                                                                                                                capital instruments and Senior Non-
                                                                                                                                                                                                Preferred (SNP) liabilities
                                                                               SP5                                                                                                             Existing Senior Non-Preferred liabilities
                                                                                                                                                                                                have long remaining terms
                                                                                                                                                                                               SP is expected to be the prevailing
                                                                                                                                                                                                senior product in the near-term, but
                                                       € ~ 8.3 bn                                                                                                                               SNP will remain an element of pbb´s
                                                                                                                                                                                                funding strategy
 € ~ 7.4 bn
                                                                                                                                                                                               pbb has a MREL-ambition level
                         SNP3                                                  SNP                                                                                                              of > 8 % TLOF
                         >1Y
                                                                                                                                                                                               Increase in TLOF due to participation
                                                                                                                                                                                                in TLTRO III
 € ~ 4.3 bn                             8 % TLOF                                                                                                                                               Regulatory requirements (SREP,
                                                                                                                                                                                                MREL etc.) are comfortably met
                                                        € ~ 3.7 bn
                         Other
                          T2                                                Subord.4
                         AT1                                                  AT1

                         CET1                                                 CET16

                Own Funds and                                            capital and                remaining
                Eligible Liabilities                                     bail-in stack             after 3 years                 ...5 years                ...10 years
1 Incl. full-year result 2019 2 pbb has set its ambition level at > 8% TLOF. As of 30 June 2020, MREL eligible items amounted to ~14% TLOF (based on estimated TLOF as 30. June 2020) / ~43% RWA            3 MREL-eligible Senior Non-Preferred Debt >1Y according
to legal maturities 4 Nominal amount of Tier 2 instruments; the capital stack includes € 300 mn AT1 issuance callable in 2023 and € 300 mn T2 issuance callable in 2022 5 Senior Preferred, structured unsecured and corporate deposits (excl. protected deposits)
6 CET1 assumed to be constant

Investor Update based on results Q2/H1 2020 (IFRS, pbb Group, unaudited, but reviewed), September 2020                                                                                                                                                           10
Funding
Investment opportunities

Pfandbrief Investments

   Mortgage Pfandbrief and Public Sector Pfandbrief
   One of the largest Pfandbrief issuers with 14 € benchmarks outstanding and a strong presence in the GBP, SEK and USD market
   Benchmarks issued with maturities up to 2035
   Very low weighted average LTV of 33.65% in the Mortgage Cover Pool (based on market value)
   Private Placements starting with € 1 mn and maturities up to 30 years
   Available currencies: EUR, GBP, SEK, USD

Unsecured Investments

   Senior “preferred” and “non preferred” products
   2 € senior preferred and 2 € senior non preferred benchmarks outstanding
   Private Placements starting with € 1 mn and maturities up to 30 years
   Available currencies (e.g. EUR, GBP, SEK, USD, CHF, NOK, YEN, CZK)

 Focus on the development of the funding franchise
        New debt product “Senior Preferred” opens the access to a larger investor base.
        Co-operation with Origin for the MTN placement and Deposit Solutions for our retail deposit brand pbb direkt in order to
         stream line internal processes.

Investor Update based on results Q2/H1 2020 (IFRS, pbb Group, unaudited, but reviewed), September 2020                              11
Capital
Capitalisation remains strong

Basel III: RWA                                                                                                                                           RWA development Q2/H1 2020:
€ bn (IFRS)
                                                                                                                                                            RWA slightly up by € 0.1 bn q-o-q, mainly due to technical effects
                                                                                                                                                             (e.g. regular reviews, reclassification effects)
                              17.7                                     17.3                                      17.4                                       Further slight increase of RWA expected till year-end due to
                                                                                                                                                             COVID-19 driven reclassification effects

                             12/19                                    03/20                                     06/20

Basel III: Equity and capital ratios                                                                                                                    Capital ratios:
(IFRS)
                                                                                                                                                         CET 1 ratio slightly down to 15.8%2 (03/20: 16.3%), mainly
                                                    12/19                                                                                                 reflecting decrease in regulatory CET 1 capital resulting from
Capital in € bn                                                  full profit                03/202                    06/202                              AT1 coupon payment and EL shortfall
                                      reported
                                                                retention1
CET 1                                           2.7                        2.8                        2.8                       2.7
AT 1                                            0.3                        0.3                        0.3                       0.3
                                                                                                                                                         SREP requirements 2020:
Tier 2                                          0.6                        0.6                        0.6                       0.6
Total Equity                                    3.6                        3.7                        3.7                       3.7                         SREP requirements:
                                                                                                                                                                 CET 1 ratio: 9.5%
                                                    12/19
Capital ratios
                                                                                            03/202                    06/202                                     Tier 1 ratio: 11.0%
                                                                 full profit
in %                                  reported
                                                                retention1
                                                                                                                                                                 Own funds ratio: 13.0%
CET 1                                         15.2                       15.9                       16.3                      15.8                          ECB’s Banking Supervisory Committee lowered requirements
Tier 1                                        16.9                       17.5                       18.0                      17.5                           due to COVID-19 as of 12.03.2020 with 1.09%-pts CET1-relief for
Own funds                                     20.4                       21.1                       21.6                      21.1                           pbb
Leverage ratio                                 5.4                        5.6                        5.6                       5.1                          Anticipated countercyclical buffer stable at 45bp

Note: Figures may not add up due to rounding
1 Retrospectively adjusted, incl. full-year result 2019, based on resolution of AGM to allocate the distributable profit 2019 to other revenue reserves on 28 May 2020   2 Excl. interim result, incl. full-year result 2019

Investor Update based on results Q2/H1 2020 (IFRS, pbb Group, unaudited, but reviewed), September 2020                                                                                                                            12
Summary & Outlook
pbb confident to achieve a solid positive full-year result 2020

                      Solid operating performance supported further risk provisioning in Q2/20
                            NII remains robust while operating costs are under control
                            Risk provisioning mainly driven by downwardly revised economic assumptions in the light of COVID-19
                             pandemic (stages 1&2)

                      pbb is confident to achieve a solid positive full-year result 2020, despite significant uncertainty from COVID-19

                      Following developments expected for H2/20:
                            New business to increase vs. H1/20 at continued higher margin levels – as prepayments are expected to
                             remain low, the strategic REF financing volume should slightly increase
                            NII to slightly increase – positive effects from slight increase of REF financing volume, lower refinancing
                             costs and income from ECB’s targeted longer-term refinancing operations (TLTRO III);
                             prepayment fees to stay low
                            GAE lower vs. H1/20, resulting in a slightly lower full-year level compared to prior year
                            Assuming no further significant overall economic deterioration, no substantial additions to risk
                             provisioning in stage 1&2 expected; currently, no evidence of any strong increase in stage 3, but overall
                             significant uncertainty persists
                                 In general, pbb conservatively positioned – good risk profile with low LTVs and high risk buffers as well
                                  as solid capitalisation
                                 Further anticipated risk provisioning manageable based on current assessment
                            pbb continues to work on cost efficiency and digitalisation – investments in digitalisation to be continued

                     pbb follows ECB recommendation to adjourn dividend decision – general dividend policy with 50% regular
                     plus 25% supplementary payout-ratio1 for 2020-2022 maintained, subject to ongoing review
1 Based on PAT after AT1 coupon

Investor Update based on results Q2/H1 2020 (IFRS, pbb Group, unaudited, but reviewed), September 2020                                        13
Contact details

Funding / Debt Investor Relations

   Götz Michl                                           +49 (0)6196 9990 2931
                                                         Goetz.Michl@pfandbriefbank.com

   Silvio Bardeschi                                     + 49 (0)6196 9990 2934
                                                         Silvio.Bardeschi@pfandbriefbank.com

   Funding Desk                                         Funding@pfandbriefbank.com

   Webpage:                                             www.pfandbriefbank.com/investors/debt-investors.html

                                                                                                                © Deutsche Pfandbriefbank AG
                                                                                                                                   Parkring 28
                                                                                                                      85748 Garching/Germany
                                                                                                                            +49 (0) 89 28 80-0
                                                                                                                       www.pfandbriefbank.com
Investor Update based on results Q2/H1 2020 (IFRS, pbb Group, unaudited, but reviewed), September 2020                                       14
Appendix

Investor Update based on results Q2/H1 2020 (IFRS, pbb Group, unaudited, but reviewed), September 2020   15
Key figures
pbb Group

      Income statement (€ mn)                                                                  2017                 2018                Q1/19                Q2/19                H1/19                2019                Q1/20                 Q2/20                 H1/20
      Net interest income                                                                           407                  450                  116                  113                  229                 458                  111                    117                  228
      Net fee and commission income                                                                    8                    6                    1                    2                    3                    6                   2                       1                   3
      Net income from fair value measurement                                                          -5                   -9                   -2                   -5                   -7                   -7                 -17                       1                -16
      Net income from realisations                                                                    45                   32                    6                   10                   16                   48                  14                       2                 16
      Net income from hedge accounting                                                                -1                   -1                   -1                    -                   -1                   -2                  -1                      -1                  -2
      Net other operating income                                                                      -1                   -7                   -1                   -1                   -2                    3                   1                       3                   4
      Operating Income                                                                              453                  471                  119                  119                  238                 506                  110                    123                  233
      Net income from risk provisioning                                                              -10                  -14                   -1                    1                    -                 -49                  -34                    -36                 -70
      General and administrative expenses                                                          -199                 -193                  -46                  -47                  -93                -202                   -48                    -49                 -97
      Expenses from bank levies and similar dues                                                     -28                  -25                 -21                    -1                 -22                  -24                  -21                      -4                -25
      Net income from write-downs and write-ups on non-financial
                                                                                                     -14                  -15                   -4                   -4                   -8                 -18                   -5                      -5                -10
      assets
      Net income from restructuring                                                                    2                   -9                    1                    1                    2                    3                    -                      -                   -
      Pre-tax profit                                                                                204                  215                    48                   69                 117                 216                     2                     29                  31
      Income taxes                                                                                   -22                  -36                   -8                 -10                  -18                  -37                     -                     -8                  -8
      Net income                                                                                    182                  179                    40                   59                   99                179                     2                     21                  23

      Key ratios (%)                                                                           2017                 2018                Q1/19                Q2/19                H1/19                2019                Q1/20                 Q2/20                 H1/20
      CIR1                                                                                         47.0                 44.2                 42.0                 42.9                 42.4                 43.5                48.2                    43.9                45.9
      RoE before tax                                                                                 7.3                  7.1                  6.0                  9.0                 7.6                  6.9                 -0.3                    3.4                 1.6
      RoE after tax                                                                                  6.5                  5.9                  4.9                  7.6                 6.3                  5.7                 -0.3                    2.3                 1.0

      Balance sheet (€ bn)                                                                    12/17                12/18                03/19                06/19                06/19                12/19               03/20                 06/20                 06/20
      Total assets                                                                                 58.0                 57.8                 60.3                 60.1                 60.1                 56.8                56.6                    60.7                60.7
      Equity                                                                                         2.9                  3.3                  3.3                  3.2                 3.2                  3.2                  3.2                    3.2                 3.2
      Financing volume                                                                             45.7                 46.4                 47.1                 46.4                 46.4                 45.5                45.0                    44.5                44.5

      Regulatory capital ratios2                                                              12/17                12/18                03/19                06/19                06/19                12/19               03/20                 06/20                 06/20
      RWA (€ bn)                                                                                   14.5                 14.6                 14.3                 13.6                 13.6                 17.7                17.3                    17.4                17.4
      CET 1 ratio – phase in (%)                                                                  17.63                18.53                18.84                19.45                19.47                15.96               16.37                   15.87               15.87

      Personnel                                                                               12/17                12/18                03/19                06/19                06/19                12/19               03/20                 06/20                 06/20
      Employees (FTE)                                                                               744                  750                  743                  746                  746                 752                  749                    763                  763
Note: annual results 2017, 2018 and 2019 audited, interim results Q1/19 and Q1/20 unaudited, interim results Q2/19 & Q2/20 reviewed 1 CIR = (GAE + net income from write-downs and write-ups on non-financial assets)/operating income                    2 Basel III transition rules
3 Incl. full-year result, post dividend     4 Excl. interim result, post dividend 2018 5 Excl. interim result 6 Adjusted, incl. full-year result 2019, based on resolution of AGM to allocate the distributable profit 2019 to other revenue reserves on 28 May 2020         7 Excl.
interim result, incl. full-year result 2019

Investor Update based on results Q2/H1 2020 (IFRS, pbb Group, unaudited, but reviewed), September 2020                                                                                                                                                                              16
Financials
Risk provisioning mainly driven by downwardly revised economic assumptions (stages 1&2)

Net income from risk provisioning                                                                                                Key drivers Q2/H1 2020:
€ mn
                                                                                                                                  Stages 1&2: € -24 mn net additions in Q2/20 (H1/20: € -54
                                                                       Q2/19 Q2/20 H1/19 H1/20                                     mn) account for downwardly revised economic assumptions
                                                                                                                                   in the light of COVID-19 pandemic
                Net income from risk                                                                                                Migration from stage 1 to 2 in Q2/20 (resulting from multi-
                                                                              1         -36               -         -70
                provisioning                                                                                                        year PD increases based on pbb definition) affects loans
                thereof                                                                                                             with a gross book value of € 4.1 bn (Q1/20: € 2.9 bn)
                   stage 1                                                   1          -10              -          -27
                   stage 2                                                   3          -14              3          -27           Stage 3: Net additions of € -8 mn in Q2/20 (H1/20: € -12 mn)
                   stage 3                                                  -4           -8             -4          -12            for one UK shopping centre; transfer of one loan from stage
                   Off balance sheet lending                                                                                       2 to 3 due to a covenant breach, but no provisioning required
                   business                                                   1           -4             1            -5
                   Recoveries                                                 -            -             -             1
                                                                                                                                  Provisions in off balance sheet lending business
                                                                                                                                   (H1/20: € -5 mn) also driven by revised economic forecasts
Balance sheet – loss allowances                                                                                Non-REF
                                                                                                                                   (attributable to stages 1&2)
€ mn                                                                                                           REF

                                                                                                                                  Coverage ratio: Stage 3 coverage ratio1 at 13% (03/20:
                                                                                                          65 bp                    13%, 12/19: 11%)
                                                                               51 bp
                                                                                            +14 bp                                  Additional collateral not taken into account – incl. these
                                                    39 bp                                                     201                   factors, REF coverage ratio at approx. 100%
                                                                 +12 bp
REF                     26 bp                                                     169
                                      +13 bp                                                                  28
coverage
                                                     135                          31
                         103                          30
                          33                                                                                  173
                                                                                  138
                                                     105
                          70

                        09/18                      12/19                       03/20                      06/20

1 Coverage ratio = credit loss allowances on financial assets in stage 3 / gross book values in stage 3 (loans and securities)

Investor Update based on results Q2/H1 2020 (IFRS, pbb Group, unaudited, but reviewed), September 2020                                                                                             17
Markets
COVID-19 impact becomes visible in Q2 market data

          European CRE Investment volume                                                                             Office vacancy
          (€ bn)                                                                                                     in %                                                                        European and US CRE investment volumes decreased
120                                                                                                      350    25,0
                                                                                                                                                                                                  in Q2/20 due to COVID-19
100                                                                                                      300
                                                                                                                20,0
                                                                                                         250
 80
                                                                                                         200    15,0                                                                             However, it is expected that these markets will recover
 60
                                                                                                         150    10,0
                                                                                                                                                                                                  but with different speed depending on the stringency of
 40
                                                                                                         100                                                                                      lockdown measures, market liquidity and dependence on
                                                                                                                 5,0
 20                                                                                                      50                                                                                       retail and tourism
  0                                                                                    0                         0,0
      2006 2007 2008 2009 2010 2011 2012 2013 2014 2015 2016 2017 2018 2019 2020                                       2002 2003 2005 2006 2008 2009 2011 2012 2014 2015 2017 2018 2020
       Q1 Q1 Q1 Q1 Q1 Q1 Q1 Q1 Q1 Q1 Q1 Q1 Q1 Q1 Q1Q2
                                                                                   2020
                                                                                                                        Q1   Q3   Q1      Q3   Q1 Q3  Q1    Q3  Q1   Q3   Q1     Q3
                                                                                                                                                                                         2020
                                                                                                                                                                                        Q1Q2     COVID-19 impact can meanwhile be observed in Q2/20
                       Quarter total (LHS)            12 month rolling total (RHS)                                              Paris: Central       Frankfurt          London: Central
                                                                                                                                                                                                  market data
             Office prime yields                                                                                     Retail prime yields                                                            Demand decreased – e.g. office letting figures
             in %                                                                                                    in %
  7,0
  6,5
                                                                                                               7,0                                                                                   decreased by around 1/3
                                                                                                                                                                                                    Office vacancy starts to increase slightly in all
                                                                                                               6,5
  6,0                                                                                                          6,0
  5,5                                                                                                          5,5
  5,0                                                                                                          5,0                                                                                   markets
                                                                                                                                                                                                    Declining rents (renegotiation of rent levels can be
  4,5                                                                                                          4,5
  4,0                                                                                                          4,0
                                                                                                               3,5
  3,5
  3,0
                                                                                                               3,0                                                                                   observed)
                                                                                                               2,5
  2,5                                                                                                          2,0
          2002 2003
           Q1   Q3
                        2005
                         Q1
                               2006
                                Q3
                                         2008 2009
                                          Q1   Q3
                                                       2011
                                                        Q1
                                                              2012 2014
                                                               Q3   Q1
                                                                            2015
                                                                             Q3
                                                                                    2017
                                                                                     Q1
                                                                                             2018 2020
                                                                                              Q3   Q1
                                                                                                                     2002 2003 2005 2006 2008 2009 2011 2012 2014 2015 2017 2018 2020
                                                                                                                      Q1   Q3   Q1   Q3   Q1   Q3   Q1   Q3   Q1   Q3   Q1   Q3   Q1
                                                                                                                                                                                                 COVID-19 likely to be a catalyst for trends affecting real
                        Paris: Central                  Frankfurt                   London: Central
                                                                                                                                       Paris             Berlin             London                estate like
                                                                                                                                                                                                    Digitalization & e-commerce
             Development office rents                                                                                Development retail rents
                                                                                                                                                                                                    ESG factors (Environmental, Social and Governance)
             EUR, psm, pa                                                                                            EUR, psm, pa                                                                   Home office / remote work
1.600                                                                                                          9.000
1.400                                                                                                          8.000

1.200                                                                                                          7.000                                                                             pbb remains highly selective on new business and runs
1.000
                                                                                                               6.000                                                                              intensified risk monitoring – special focus on
                                                                                                               5.000
 800

                                                                                                                                                                                                    Retail
                                                                                                               4.000
 600
                                                                                                               3.000
 400
                                                                                                               2.000                                                                                Hotel
                                                                                                                                                                                                    Developments
 200                                                                                                           1.000
      0                                                                                                              0
          2002   2003   2005    2006     2008   2009   2011   2012   2014    2015     2017    2018    2020
                                                                                                      2020
           Q1     Q3     Q1      Q3       Q1     Q3     Q1     Q3     Q1      Q3       Q1      Q3      Q1
                                                                                                       Q2
                        Paris: Central                  Frankfurt                   London: Central
                                                                                                                                       Paris                Berlin               London

Source: pbb property market analysis

Investor Update based on results Q2/H1 2020 (IFRS, pbb Group, unaudited, but reviewed), September 2020                                                                                                                                                         18
Markets
pbb’s macro-economic and sector-specific assumptions adjusted to downwardly revised
economic forecasts in Q2/20

pbb GDP assumptions – portfolio weighted                                                                   2020     pbb’s scenario assumptions aligned with revised GDP
%                                                                                                                    forecasts of economic institutes in Q2/20
                                                                                                           2021
                                                                                                                      base case assumption of -6.8% for 2020 within forecast
Q1/20                                                               Q2/20                                  CAGR         range of -6.2% (ifo) and -8.4% (IMF)
                                                                       5.6                                            Adverse case (-8.9%) even exceeds range
                                                                                          4.7
            3.6
                                         2.6                                                                        Good, base and adverse scenarios are now significantly
                   0.8                                                       0.7                          1.1        below the assumptions made at the end of Q1/20

                                                                                                                    No second wave of infection assumed that requires further
                                                -1.2                                        -1.2
    -2.0                                                                                                             measures
                                                                    -4.0                                    -4.0
                                -4.9
                                                                                    -6.8
                                                                                                    -8.9
          pbb                         pbb                             pbb             pbb                 pbb
          Base                      Adverse                           Good            Base              Adverse

pbb market value assumptions – portfolio weighted                                                                   Only small changes to market value assumptions vs. Q1/20
%
Q1/20                                                               Q2/20                                           Stronger recovery tendencies expected only by 2022 and
                                                                                                                     2023 – only partial recovery back to 2020-levels,
                                                                                                                     depending on country and property type

                                                          stable

YE 2020           2021          2022           2023                 YE 2020        2021         2022       2023
  80-90           72-92        76-98           83-99                 83-91     75-92            76-96    80-102
Source: pbb / Broker Research – pbb portfolio weighted, Bloomberg

Investor Update based on results Q2/H1 2020 (IFRS, pbb Group, unaudited, but reviewed), September 2020                                                                           19
REF Portfolio
Shift in composition

                    31/12/2013 / Total: € 22.2 bn1                                                             31/12/20152 / Total: € 25.8 bn1                    30/06/2020 / Total: € 29.2 bn1

Regions
                                  Other 6%                                                                                  Other 5%                     Czech Republic 1% Other Europe
                     Nordics                                                                                    Nordics
                                                                                                                                                               Austria 2%
                                                                                                                           7%                                               9%
                              6%                                                                               CEE                                          Sweden 3%
               France
                            8%                                                                                       9%                                     Poland 4%

                CEE 9%                                             Germany                                                                 47% Germany          USA 10%                   48% Germany
                                                       54%                                               France 12%
                                                                                                                                                                         11%
                              16%
                                                                                                                           19%                                  France
                         UK                                                                                                                                                    11%
                                                                                                                     UK
                                                                                                                                                                          UK

Property types

                         Hotel Other 5%                                                                           Hotel Other 4%                                    Mixed use 1% Other 3%
                 Mixed use                                                                               Mixed use                                                 Hotel 5%
           Logistics/                                        Office                                                4%                                        Logistics/     5%
                                  5%                                                                  Logistics/                    Office
            Storage          8%                      31%                                                               4%       33%                            storage 10% 1%
                                    2%                                                                 Storage 10%
                                                                                                                                                                                          47% Office
                          22%                                                                                        16%                                        Retail 16%
        Residential                                                                                 Residential

                                               28%                                                                               29%                                           18%

                                                Retail                                                                            Retail                           Residential

Note: Figures may not add up due to rounding    1 EaD, Basel III    2 prior to the Brexit referendum in 2016

Investor Update based on results Q2/H1 2020 (IFRS, pbb Group, unaudited, but reviewed), September 2020                                                                                                  20
REF portfolio
Special focus: Retail

     REF portfolio: Property types                                                   Retail: Countries
     30/06/2020: € 29.2 bn (EaD, Basel III)                                          30/06/2020: € 4.7 bn (EaD, Basel III)                             Structural changes to overall retail segment (e.g.
                                                                                                                                                        e-Commerce, Brexit) resulted in foresighted reduction
                                                                                                              USA 3%
                                                                                              Spain 3%                                                  of pbb’s retail exposure (06/20: 16%; 12/16: 26%);
                  Hotel Others 4%                                                                             Netherlands 1%                            current retail exposure almost completely comprises
  Industrial/                             Residential                                  Austria 3%
                                                                                                                                                        investments loans
   Logistics                                                               Switzerland 4%                                         Germany
                         5%        18%                                                                                                                 Main countries Germany, UK and Poland (major part
                  10%                                                               Nordics                               29%                           of CEE)
                                                                                                  7%
                                                                                                                                                            UK – Retail Parks, Shopping Centres and Outlet
                                            16% Retail                              France 7%                                                                Parks
                                                                                                                                                            Poland – Local and regional Shopping Malls in
                                                                                                     18%                                                     larger/mid sized cities
                      47%                                                                                             24%
                                                                                                                                                            Germany – Broad selection of Shopping Malls
                                                                                              CEE
                Office                                                                                                      UK                               (mostly owned / operated by market leaders),
                                                                                                                                                             High Street Shopping, Neighborhood Shopping
                                                                                                                                                             Centres and Retail Parks
                                                                                                                                                       Average LTV1 of 51%
     Retail portfolio:      LTV1    ratio                                                                                                              COVID-19 impact varies depending on asset class
     30/06/2020: € 4.7 bn (EaD, Basel III)                                                                                                              and country
                                                                                                                                                            in most countries official lockdown (which mostly
                                Avg.-LTV1                                                                                                                    have been lifted by now) lead inter alia to hold
        75%                        51%                                                                                                                       backs of rent
                                                                                                                                                            Shopping Centres most impacted as per today
                                                                                                                                                            recovery differing from country to country/sub-
                                                                                                                                                             asset class to sub-asset class
                                                                                                                                                            Food retailing less impacted, Retail Parks mostly
                    21%
                                                                                                                                                             with limited impact, Factory Outlet Centres with
                                  4%                                                                                                                         stronger than expected recovery
                                                0%         0%
                                                                                                                                                       In order to support borrowers in present environment,
       ≤60%         ≤70%        ≤85%           ≤100%     >100%
                                                                                                                                                        pbb agreed in some cases to temporary adapt
                                                                                                                                                        amortisation schedules and covenant structures
Note: Figures may not add up due to rounding      1 Based on performing investment loans only, values not reflecting corona effects, defaulted transactions excluded from this calculation

Investor Update based on results Q2/H1 2020 (IFRS, pbb Group, unaudited, but reviewed), September 2020                                                                                                           21
REF portfolio
Special focus: Hotel

     REF portfolio: Property types                                                   Hotel: Countries
     30/06/2020: € 29.2 bn (EaD, Basel III)                                          30/06/2020: € 1.4 bn (EaD, Basel III)

         Industrial/ Others 4%                                                                                                              Focus on business hotels in metropolitan regions of
                                                                                              Austria 5% Poland 3%                             Germany – Frankfurt, Hamburg, Munich,
          Logistics                       Residential                                     Benelux                                               Berlin, Stuttgart
                     10%           18%                                                                8%                                       Benelux – Luxembourg, Den Haag, Utrecht
                                                    Hotel                                                                                      London and Vienna
                                               5%
    Retail 16%                                                                                                               46% Germany    No holiday ressort hotels
                                                                                                                                            90% investment loans, only 10% developments
                                                                                                    42%                                     Typically good sponsor / brand background with
                                                                                                                                             established large brands / trademarks
                               47%                                                            UK
                                                                                                                                            Average LTV1 of 53%
                                 Office                                                                                                     By now, except in UK, most hotels financed by pbb
                                                                                                                                             have reopened recently
                                                                                                                                            Based on prime location / sponsor quality / well-
                                                                                                                                             known branding, we generally expect good
     Hotel portfolio:       LTV1   ratio
     30/06/2020: € 1.4 bn (EaD, Basel III)
                                                                                                                                             recovery and stabilisation post COVID-19
                                                                                                                                            However, further development of pandemic rather
        90%
                                                                                                                                             influental on timing of recovery, in particular to what
                                Avg.-LTV1                                                                                                    extent business travel starts again
                                  53%
                                                                                                                                            In order to support borrowers, pbb agreed in some
                                                                                                                                             cases to temporary adapt amortisation schedules
                                                                                                                                             and covenant structures

                    10%
                                  0%           0%           0%
        60%        70%         ≤85%          85%
REF portfolio
Special focus: Developments

     REF portfolio: Loan types                                         Developments: Countries
     30/06/2020: € 29.2 bn (EaD, Basel III)                            30/06/2020: € 4.7 bn (EaD, Basel III)          Portfolio share of 16% with focus on Office (53%) and
                                                                                                                       Residential (24%) mainly in Germany (78%) and France
                                                                                                                       (13%)
              Others < 1% Derivative 1%
                                                                                       UK Others 3%
                                               Development                                                            Strong risk-mitigating factors:
                                    16%
                                                                          France          6%                             Experienced sponsors
                                                                                    13%                                  1A locations
                                                                                                                         Excellent infrastructure
                                                                                                                         High pre letting / pre-sales
                                                                                                                         Long stop dates in lease and sales contracts,
                      83%                                                                            78%                  providing comfortable buffers in terms of construction
                                                                                                                          delays
         Investment                                                                                        Germany       Very extended long-stop dates
                                                                                                                         pbb is very strictly monitoring all our development
                                                                                                                          financings leading to a very high risk transparency on
                                                                                                                          our development exposure

                                                                                                                      Loan disbursements strictly linked to respective project
                                                                                                                       and corresponding construction/letting progress

                                                                                                                      Fundamental risks resulting from COVID-19:
                                                                                                                         Closure of construction sites
                                                                                                                         Entry restrictions for workers
                                                                                                                         Interruption of supply chain (building material is
                                                                                                                          however often in stock)
                                                                                                                         Tenant’s cancellation rights or renegotiation of rents
                                                                                                                          (in the event of a delay in completion)
                                                                                                                         Sales of condominium slowing down/pressure on price
                                                                                                                          level for condominiums
Note: Figures may not add up due to rounding

Investor Update based on results Q2/H1 2020 (IFRS, pbb Group, unaudited, but reviewed), September 2020                                                                             23
Pfandbrief refinancing
ISCR and the effect of the Mortgage Lending Value – very simplified example!

  Interest Service Cover Ratio                                                                              Loan - to - Value Ratio

                                                                                  Loan                    Valuation                        Refinancing

                                                         MV € 100 mn

                                                                                Borrower’s                Difference
                                                                                  Equity                   e.g. 35%

                                                                                  € 45 mn

 € 4.0 mn rent p.a. at 4% property yield
                   results in a market
                   value of € 100 mn
                                                                    55%
 minus
                                                                    LTV
 € 1.1 mn interest payment p.a.
                   for a € 55 mn loan                                                                                    max.
                   at 2% interest rate                                                                                   60%                        OC e.g. 15%
 € 2.9 mn excess cash

                                                                                   Loan                    Mortgage              Pfandbrief         Pfandbrief
                                                                                (Yield 7.3%)             Lending Value           Collateral           issued
 € 4.0 mn rent                                                                                            (Yield 6.2%)          (Coverpool)
                          = ~ 360% ISCR
 € 1.1 mn interest                                                                € 55 mn                  € 65 mn               € 39 mn              € 33 mn

Investor Update based on results Q2/H1 2020 (IFRS, pbb Group, unaudited, but reviewed), September 2020                                                            24
                                                                                                                                                                  24
Cover Pools
Mortgage Cover Pool

Cover Funds by Region                                                                         31/03/2020 Total: € 17.4 bn1                             Mortgage cover pool (Nominal)                                                30/06/2020
€ bn (nominal)
                                                                                              30/06/2020 Total: € 17.6                    bn1          Pfandbriefe outstanding                                                       € 16.0 bn
      8.0       8.0
                                                                                                                                                       Cover funds                                                                   € 18.3 bn
                                                                                                                                                       Over-collateralisation (Nominal / NPV)                                      14.1% / 13.2%
                                                                                                                                                       No. of loans                                                                    1,893
                                                                                                                                                       No. of properties                                                               3,329
                                                                                                                                                       Payments ≥90 days overdue                                                     € 0.2 mn
                                                                                                                                                       Weighted average LTV (based upon the market value)                             33.65%
                                2.1      2.0                          1.9               1.8       1.9
                                                            1.8                                                    1.5       1.4
                                                                                                                                               1.0       1.1
                                                                                                                                                                            0.5       0.6
                                                                                                                                                                                                    0.3   0.3        0.2     0.2     0.1   0.1

      Germany                        UK                        USA                        France                       CEE                      Nordic                      Benelux                 Austria            Spain        Switzerland
                                                                                                                                               countries

  Cover Funds By Region                                                                                                               Cover Funds By Property Type
  as of 30/06/2020                                                                                                                    as of 30/06/2020
                                             Austria Spain
                                        Benelux          Switzerland 1%
                           Nordic countries      1%                                                                                                                           Other2
                                            6% 3%                                                                                                                                       21%
                                   CEE 8%        1%
                                                                                                                                                                                                                    Office
                                                                                     46% Germany                                                                                                              43%
                                  France 11%
                                                                                                                                                                                  18%
                                                                                                                                                    Retail/Shopping
                                                     11%
                                               USA              12%                                                                                                                               18%
                                                                UK                                                                                                                  Residential

Note: Figures may not add up due to rounding    1 Excl. additional cover assets (substitute collateral)   2 Incl. logistics, hotels, other commercially used buildings as well as building land

Investor Update based on results Q2/H1 2020 (IFRS, pbb Group, unaudited, but reviewed), September 2020                                                                                                                                            25
Cover Pools
Public Sector Cover Pool

Cover Funds by Region                                                                                                 Public sector cover pool (Nominal)                 30/06/2020
€ bn (nominal)                                                                  31/03/2020 / Total: € 13.5 bn
                                                                                30/06/2020 / Total: € 12.6 bn         Pfandbriefe outstanding                            € 11.0 bn
                                                                                                                      Cover funds                                        € 12.6 bn
     4.9
                                                                                                                      Over-collateralisation (Nominal / NPV)          14.7% / 14.8%
            4.0                                                                                                       No. of loans / bonds                                  568
                         3.7 3.7
                                               3.1 3.0                                                                Payments ≥90 days overdue                              -

                                                         0.5 0.4    0.3 0.3       0.1 0.3     0.2 0.2       0.2 0.2      0.2 0.1      0.1 0.1       0.1 0.1    0.1 0.1      0.1 0.1

    Germany              Austria               France    Spain          Italy      Supra       Japan       Benelux       Portugal      Nordic       Canada       UK           CEE
                                                                                                                                      countries
 Cover Funds by Region                                                                         Cover Funds by Counterparty Type
 as of 30/06/2020                         Portugal 1% Nordic countries 1%                      as of 30/06/2020
                                           Benelux     Canada 1%
                                             Japan      UK 1%
                                            Supra            CEE
Ratings
Ratings unchanged – however Issuer and Senior Preferred Debt rating on CreditWatch

                                 Bank ratings                                                                                         S&P
                                 Long-term                                                                         A- / CreditWatch Negative4
                                 Outlook/Trend                                                                                     Negative
                                 Short-term                                                                                            A-2
                                                               1
                                 Stand-alone rating                                                                                    bbb
                                 Long Term Debt Ratings
                                 “Preferred” senior unsecured Debt2                                                  A- / CreditWatch Negative4
                                 “Non-preferred” senior unsecured Debt3                                                               BBB-
                                 Subordinated Debt                                                                                     BB+

                                 Pfandbrief ratings                                                                                                                                      Moody’s
                                 Public Sector Pfandbrief                                                                                                                                    Aa1
                                 Mortgage Pfandbrief                                                                                                                                         Aa1

                                 Disclaimer:

                                 The rating information published in this presentation and on our web site are a service for our investors. The information does not necessarily represent the opinion of Deutsche
                                 Pfandbriefbank AG. Ratings should not serve as a substitute for individual analysis. The information provided should not be seen as a recommendation to buy, hold or sell
                                 securities. Deutsche Pfandbriefbank AG does not assume any liability, including for the completeness, timeliness, accuracy and selection of such information, or for any potential
                                 damages which may occur in connection with this information.

                                 The rating agencies may alter or withdraw their ratings at any time. The rating of an individual security issued by Deutsche Pfandbriefbank AG may differ from the ratings shown
                                 above or an individual security might not be rated at all. For the evaluation and usage of the rating information (including the rating reports), please refer to the respective rating
                                 agencies’ pertinent criteria and explanations, terms of use, copyrights and disclaimers, which are to be considered.

Note: The above list does not include all ratings   1 Stand-alone credit profile   2 "Senior Unsecured Debt“   3 "Senior Subordinated Debt"   4 CreditWatch Negative on 15/09/2020

Investor Update based on results Q2/H1 2020 (IFRS, pbb Group, unaudited, but reviewed), September 2020                                                                                                                     27
You can also read