Investor Presentation - Q2 2021
←
→
Page content transcription
If your browser does not render page correctly, please read the page content below
Q2 2021
Investor Presentation
FORWARD-LOOKING STATEMENTS AND NON-IFRS FINANCIAL MEASURES
 This material may contain forward-looking statements, including those identified by the expressions “anticipate”, “believe”, “plan”, “estimate”, “expect”, “intend”
 and similar expressions to the extent they relate to First Capital REIT (“First Capital”) or its management. The forward-looking statements are not historical facts
 but reflect First Capital’s current beliefs and are based on information currently available to management. Certain material factors and assumptions were applied
 in providing these forward-looking statements, many of which are beyond our control.

 Management believes that the forward-looking statements are based upon reasonable assumptions; however, management can give no assurance that actual
 results will be consistent with those expressed or implied in these forward-looking statements. These forward-looking statements are subject to a number of
 risks and uncertainties that could cause actual results or events to differ materially from those expressed or implied in these forward-looking statements.
 Additional information about the risks and uncertainties that could cause actual results to differ materially, and the material factors or assumptions that were
 applied in providing these forward-looking statements, are contained in our various securities filings, including our quarter end results press release dated
 August 4, 2021, our Management’s Discussion and Analysis for the year ended December 31, 2020 and for the quarter ended June 30, 2021 (the “MD&As”)
 and our current Annual Information Form, all of which are available on SEDAR at www.sedar.com and on our website at www.fcr.ca.

 You should not place undue reliance on any such forward-looking statements. Further, a forward-looking statement speaks only as of the date on which such
 statement is made. These forward-looking statements are made as of August 4, 2021. Except as required by securities law, First Capital undertakes no
 obligation to publicly update or revise any such statements whether to reflect new information, the occurrence of future events or circumstances, or otherwise.
 Additionally, past performance, including the key operating metrics described in this presentation, is not indicative of future results given the risks and
 uncertainties described in detail in our MD&A, including with respect to COVID-19.

 This material references certain non-IFRS financial measures, including but not limited to FFO, FFO per unit, NOI and NAV. These non-IFRS measures are
 further defined and discussed in the MD&As, which should be read in conjunction with this material and the conference call. Since these non-IFRS measures do
 not have standardized meanings prescribed by IFRS, they may not be comparable to similar measures reported by other issuers. First Capital uses and presents
 the above non-IFRS measures as management believes they are commonly accepted and meaningful financial measures of operating performance.
 Reconciliations of certain non-IFRS measures to their nearest IFRS measures are included in the MD&As. These non-IFRS measures should not be construed as
 alternatives to net income or cash flow from operating activities determined in accordance with IFRS as measures of First Capital’s operating performance.

 All figures in this presentation are as of June 30, 2021 unless otherwise noted.

                                                                                                                                                           First Capital   2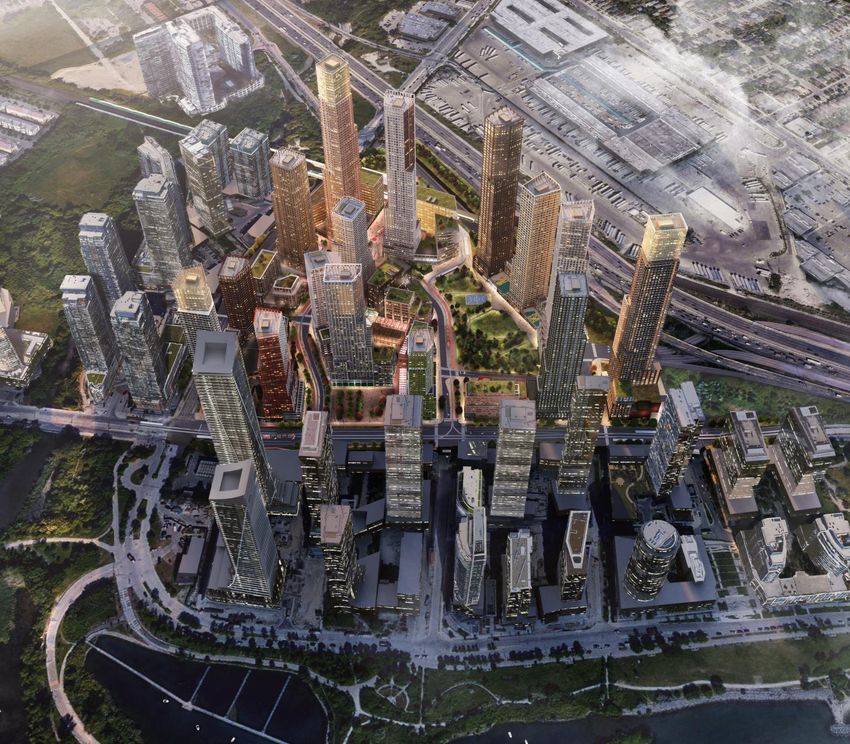
TABLE OF CONTENTS
 1.0
 1.0 Company Snapshot ....…………………………………………………………………………….........                 XX
                                                                                 4 – XX

 2.0 Highlights - Recent Financial and Operating Results ..….….….….….….……….…….   XX
                                                                                 5 – -7XX

 3.0 Super Urban Neighbourhoods …………………….……………………………………………….
 3.0                                                                             XX
                                                                                 8 – -20
                                                                                       XX

 4.0 Density Pipeline and Development ..………….…………………………………………………
 4.0                                                                             XX
                                                                                 21 –- XX
                                                                                       23

   4.1 Properties Under Construction (PUC)/Active Developments .…………………..
   4.1                                                                           XX
                                                                                 24 –- XX
                                                                                       30

   4.2 Near Term Developments ..…………..……………….…………………………………………
   4.2                                                                           XX
                                                                                 31 –- XX
                                                                                       34

   4.3 Medium & Long Term Developments ……………….……..………………………………
   4.3                                                                           35 –- XX
                                                                                 XX    39

 5.0 Environmental, Social and Governance (ESG) ……….……………………………………...            40 –- XX
                                                                                 XX    41

 6.0
 6.0 Financial Strength and Flexibility ……..………….……………………………………………….             42 –- XX
                                                                                 XX    52

 Appendix
 Appendix I - COVID-19 Update ……..………….……………………………………..……………….                   53 –- XX
                                                                                 XX    56

 Appendix
 Appendix III - Profiling Super Urban Neighbourhoods ………………………………………...          XX
                                                                                 57 – 67
                                                                                      XX
                                                                                      First Capital   3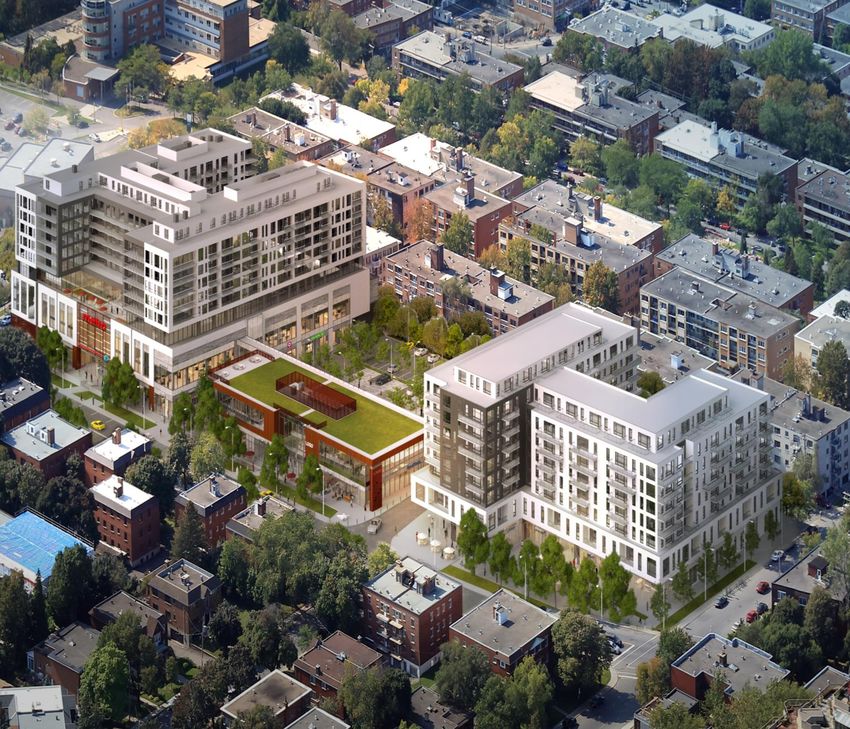
1.0 COMPANY SNAPSHOT (TSX: FCR.UN)

 First Capital is a leading owner, operator and developer of grocery anchored and mixed-use real estate
 located in Canada’s most densely populated cities. First Capital’s focus is on creating thriving urban
 neighbourhoods to generate value for businesses, residents, communities and our investors.

             150                                                              22.9m sf
          neighbourhoods                        Super                           of gross leasable area
                                                                               (20.1m sf at FCR share)

                                          urban
          $8.5b                      market focus across Canada
                                                                               24.2m sf
          enterprise value                                                   of future incremental density

 As of June 30, 2021

                                                                                                    First Capital   4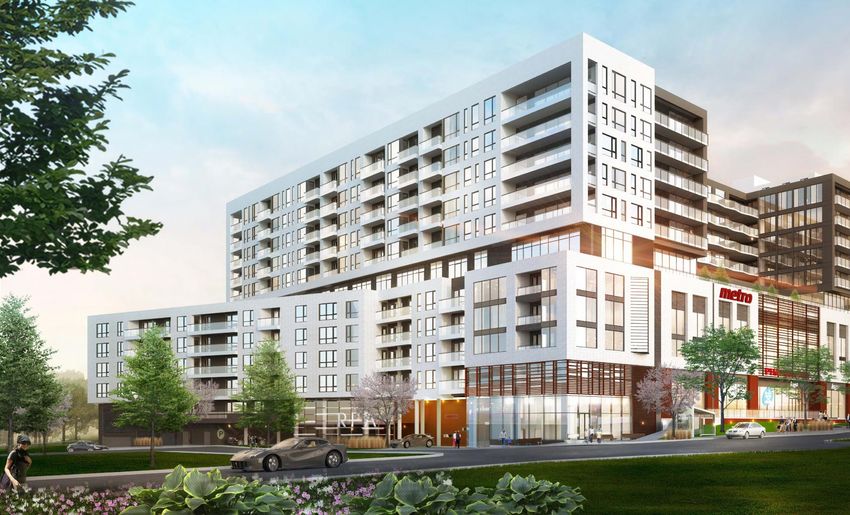
2.0 Highlights -
Recent Financial and
  Operating Results
2.0 HIGHLIGHTS – Q2 2021 FINANCIAL AND OPERATING RESULTS

$0.35 FFO per Unit +60% YoY
• +$0.13 per unit over Q2 2020’s $0.22 per unit
•        Primarily due to a $17.5m ($0.08 per unit) unrealized fair value gain on shares of a construction management software
         company which completed an IPO in the quarter (Originated from a US$5m VC investment made in May 2018).
•        Excluding the aforementioned gain, Q2 2021 FFO per unit of $0.27 was +23% year over year.
Q2 2021 Bad Debt Expense of $2.9m
• Reflecting mandated restrictions on business and social gatherings across the country through most of the second quarter
• Down 83% year over year from $16.9m in Q2 2020
• Gross rent collections was 95%(1) for Q2, and 96% for H1 2020

Same Property NOI Growth of 16.6%
•        Primarily due to a $13.1m decrease in bad debt expense (CECRA and other COVID-19 provisions) incurred in Q2 2020.
         Same Property NOI increased 0.3%, excluding bad debt expense and lease termination fees.

Leasing and Occupancy
•        $22.09 net rent psf: +1.8% or $0.39 psf YoY primarily due to rent escalations, renewal lifts. Highest net rent PSF ever
•        Leasing: 179k sf of Q2 2021 new leasing; 713k sf of renewals at average net rental rate increase of 8.0%
•        Occupancy of 95.9%: +0.1% from 95.8% at March 31, 2021. On a year-over-year basis, -0.4% from 96.3%

(1) As   of June 30, 2021 and prior to any deferral arrangements or rent abatements

                                                                                                                           First Capital   6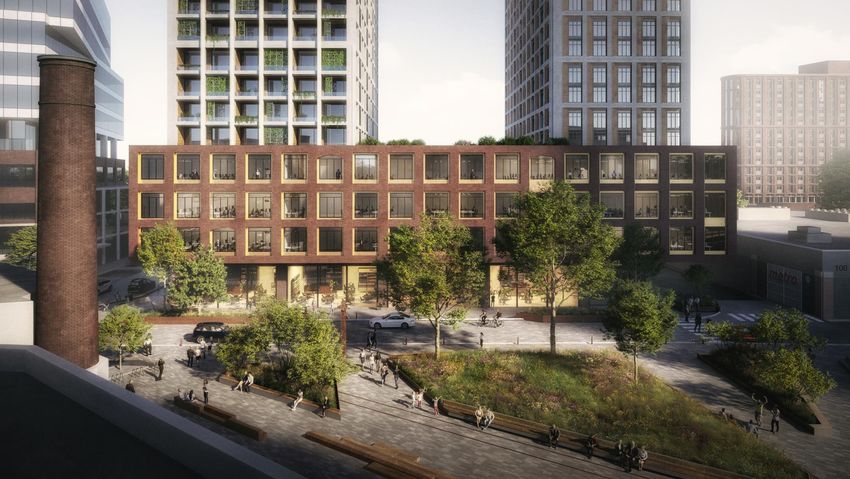
2.0 HIGHLIGHTS – Q2 2021 BALANCE SHEET, LIQUIDITY AND ASSET QUALITY

Maintaining a Strong Balance Sheet and Liquidity Position
• $723m of cash and undrawn credit facilities, as of June 30, 2021
• Unencumbered properties with an IFRS value of ~$7.0b (~70% of total assets)
• Invested $42m in development, redevelopment, and acquisitions during the second quarter primarily in super
  urban neighbourhoods in Toronto.
• Completed $9m of dispositions in Q2 2021; classified $377m of investment properties held for sale
      o $314m of assets under binding sale agreements (1)
• Remaining 2021 term debt maturities of $37m is less than 0.9% of total debt
Enhancing Asset Quality

• Asset quality has never been higher due to extensive disposition program and ongoing super urban
  investments
      o 5km population is 300k as of Q2 2021 meeting our YE 2021 objective. Leader amongst Canadian peers
      o 5km household income increased 16% from 2016 to $123k. Leader amongst Canadian peers
      o Average base rent increased ~14% from 2016 to $22.09 psf. Leader amongst Canadian peers
(1) As of August 4, 2021
                                                                                                     First Capital   7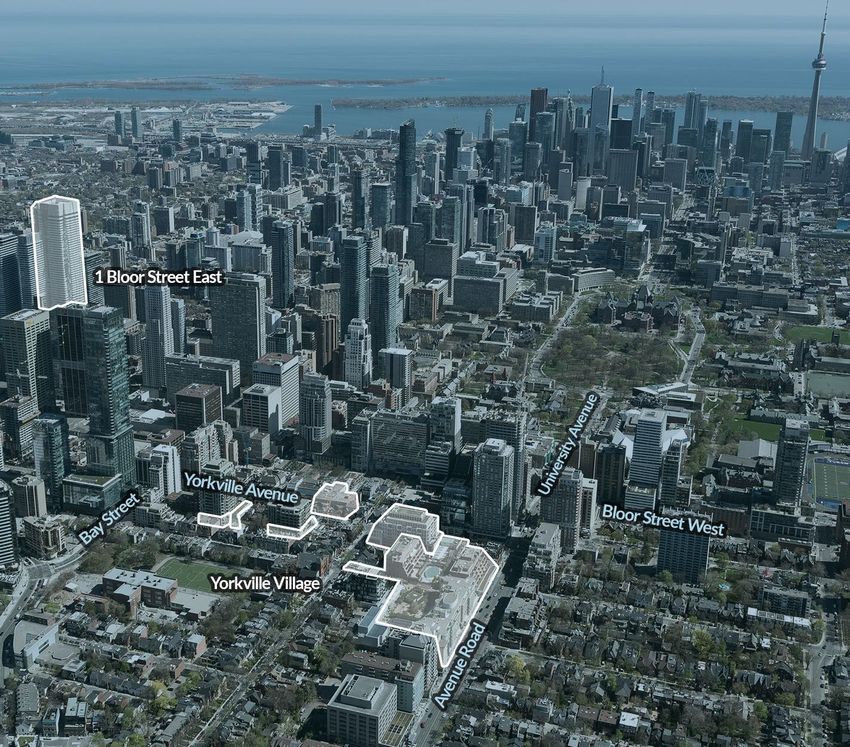
3.0 Super Urban
Neighbourhoods
                  First Capital   8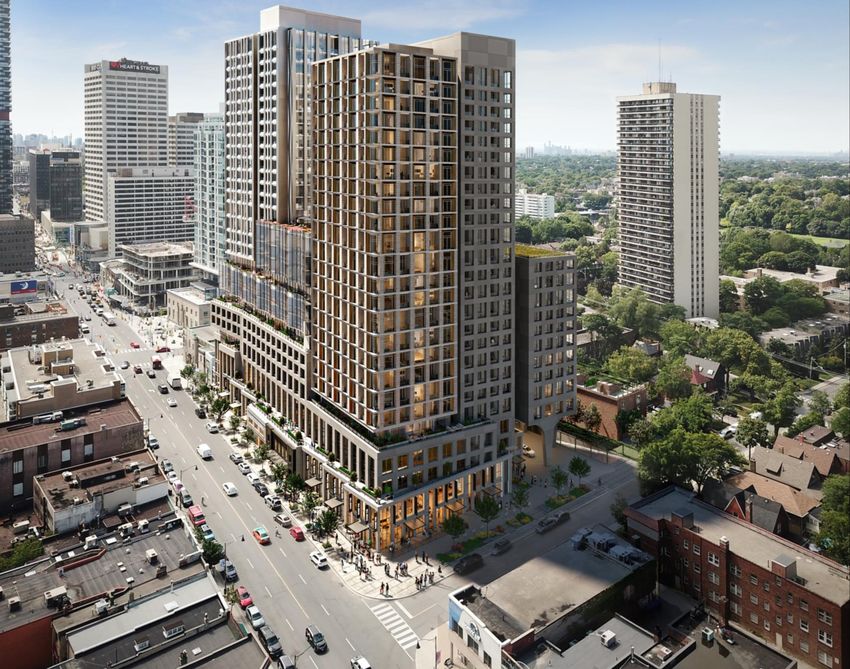
3.0 SUPER URBAN INVESTMENT STRATEGY

Creating thriving urban neighbourhoods to generate value for businesses, residents, communities and
our investors

• Investing in high-quality, mixed-use properties to build positions in targeted high growth areas

• Fully integrating retail with other uses to create thriving urban neighbourhoods

• Optimizing the portfolio through active asset management and by concentrating capital in dense, high
  growth neighbourhoods

• Surfacing substantial unrecognized value in our 24.2m sf of density pipeline through entitlements and
  development

• Actively managing our balance sheet to maintain financial strength and flexibility and a competitive cost of
  capital

                                                                                                     First Capital   9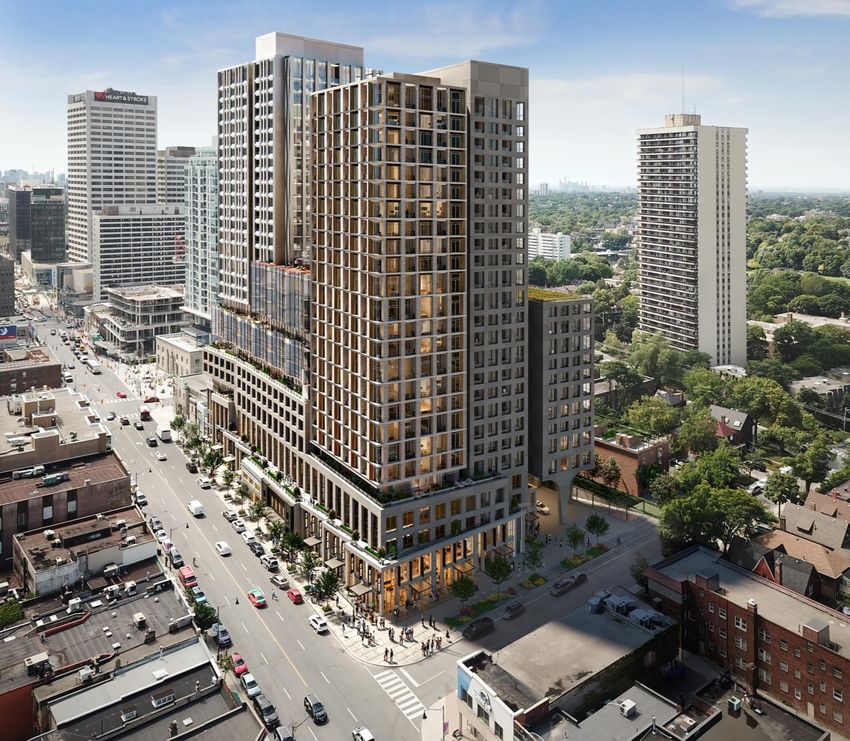
3.0 SUPER URBAN NEIGHBOURHOODS

We define a super urban property based on its proximity to transit, its “Walk Score”, and most importantly its
population density. We expect to continue to improve these metrics over time through our investment and
disposition activities.

  >99%
     Public Transit
                      Of portfolio within 5-minute walk of public transit

      72
      Walk Score
                      Average walk score for our portfolio = ‘Very Walkable’
                      2nd highest category of 5

   300k
      Population
                      Average population density within a 5-km radius of each of our properties

                                                                                                      First Capital   10
3.0 SUPER URBAN NEIGHBOURHOODS – FAIR VALUES ACROSS CANADA’S MAJOR CITIES
Vancouver, Calgary,
Western Canada Central Canada Toronto Eastern Canada Montreal, Ottawa
Edmonton
Neighbourhoods 44 Neighbourhoods 65 Neighbourhoods 41
GLA 6.7m GLA 8.6m GLA 4.8m
Fair Value % 31% Fair Value % 54% Fair Value % 15%
Edmonton 10%
Calgary 14%
Vancouver 10%
SW Ontario 3%
39%
14% Montreal
Toronto
5%
Ottawa
Kitchener/Waterloo/Guelph 5%
First Capital 113.0 SUPER URBAN NEIGHBOURHOODS - NORTH AMERICAN LEADER IN POPULATION DENSITY
FCR Portfolio Demographic Metrics versus Peer Group: Q2 2021 (1)
$123,000
US $114,000
300,000 $109,000
145,000 144,000
US Peers **
Q2 2021 US Peers (2) CDN Peers (3) Q2 2021 US Peers (2) CDN Peers (3)
5 km Population 5 km Average Household Income
As of June 30, 2021
(1) Source:Sitewise, Environics Analytics (2020 estimates)
(2) US Peers include: Federal Realty and Regency Centers – Source: Company Reports
(3) Canadian Peers include: Riocan, SmartCentres, Choice Properties (Retail only)
Property portfolio based on 2020 AIF for SmartCentres and Choice Properties, Source: Company Reports, Sitewise, Environics Analytics First Capital 123.0 SUPER URBAN NEIGHBOURHOODS - GROWTH IN 5KM POPULATION DENSITY
• Q2 2021 5km population of 300,000 people 300,000
• Up 93,000 or 45% from December +20%
304,000
2016 290,000
• Making FCR a leader amongst our North
American peer group (1)
250,000
+20%
215,000
Achieved long-term goal of 300k people by 207,000
2021 in Q3 2020
2016 2017 2018 2019 2020 Q2 2021
5 km Population
(1) North American Peer group includes: Riocan, SmartCentres, Choice Properties, Federal, and Regency Centres
First Capital 133.0 STRONG HISTORICAL GROWTH IN NAV PER UNIT
+4.6%
CAGR 2016 – Q2 2021
$24.00
$23.36
$23.00 $23.39
$22.59
$22.00 $22.34
$21.85
$21.00
$20.00
$19.53
$19.00
$18.00 $18.25
$17.00
2015 2016 2017 2018 2019 2020 Q2 2021
$16.00
First Capital 143.0 SOLID LONG TERM PERFORMANCE; RESILIENCY IN THE FACE OF SIGNIFICANT ADVERSITY
Total Same Property NOI Growth
7.8%
8.0%
2.9% 6.0%
4.0%
10 Year Average
(2010 - 2019) 2.0% 2.4% (2)
0.0%
2011 2012 2013 2014 2015 2016 2017 2018 2019 2020 H1 2021
-2.0% -1.3% (1)
-4.0%
-6.0%
-8.0%
-7.1%
(1) Ex-COVID Same Property NOI growth of (1.3%) adjusts for bad debt expense increase, wage subsidy, lower hotel NOI and lower parking revenue. Substantially lower lease termination fees in
_2020 accounted for ~1.2% decline in Same Property NOI growth.
(2) Ex-COVID Same Property NOI growth of 2.4% adjusts for bad debt expense decrease, wage subsidy decrease, higher hotel NOI and lower parking revenue. Higher lease termination fees in H1
2021 contributed ~0.3% increase in Same Property NOI growth.
First Capital 153.0 CONSISTENTLY HIGH PERFORMANCE
Lease Renewal Rate Increases (1)
12.0%
9.0% 10.0%
10 Year Average
(2011 – 2020) 8.1% (2)
8.0%
6.0%
4.0%
2.0%
0.0%
2011 2012 2013 2014 2015 2016 2017 2018 2019 2020 H1 2021
(1) Represents increase on total portfolio basis. Includes all renewals and contractual fixed rate renewals.
(2) The Trust achieved a 9.7% lease renewal rate increase in H1 2021 when comparing the net rental rate in the last year of the expiring term to the average net rental rate over the renewal term.
First Capital 163.0 PREMIER PORTFOLIO HIGHEST RENTS IN SECTOR
FCR’s Q2 2021 base rent per square foot is 33% higher than peer group average
$22.09
$20.14
3.4%
$18.97
Q2 2021 Peer Group Average $16.66
$15.43 Q2 2016 Peer Group Average $15.37
FCR Average rent growth 5 year CAGR $14.74
$14.00
1.6%
Peer Average rent growth 5 year CAGR
(1) (1) (2)
$ Growth since Q2 2016 Q2 2016 Base Rent FCR $ Growth since Q2 2016 FCR Q2 2016 Base Rent
(1) Rates for Crombie and Choice are average expiring rent as in-place rent is not disclosed.
(2) CT REIT $14.00 average rental as of Q1 2021 First Capital 173.0 STRATEGIC AND DIVERSIFIED RETAIL TENANT MIX
# of Stores % of Rent
Other Necessity-Based
497 18.1
Retailers
Grocery Stores 127 17.4
Medical, Professional &
1,356 15.3
Personal Services
QSR, Chains and Cafes 906 13.0
Pharmacies 121 9.4
Other Tenants 502 8.3
Banks & Credit Unions 191 8.3
Fitness Facilities 79 3.7
Liquor Stores 92 3.3
Other Restaurants 71 1.7
Daycare &
101 1.5
Learning Centres
18
As at June 30, 20213.0 TOP 20 RETAIL TENANTS
Contribute 46% of annualized minimum rent (AMR)
Investment Investment
Rank # Tenant AMR
Grade
Rank # Tenant AMR
Grade
(1)
1. 10.7% 11. 1.5%
2. 5.5% 12. 1.3%
3. 3.2% 13. 1.3%
4. 2.8% 14. 1.3%
5. 2.5% 15. 1.2% (2)
6. 2.0% 16. 1.1% (3) -
7. 1.8% 17. 1.0%
8. 1.8% - 18. 1.0% (4) -
9. 1.8% - 19. 1.0%
10. 1.7% 20. 1.0% -
(1) Includes Shoppers Drug Mart (3) As of May 2021, Empire Company Ltd., the parent of Sobeys Inc., owns 51% of Longo's
(2) Includes Rexall, Rexall Pharma Plus and Remedy’s Rx (4) Includes Tim Hortons, Burger King and Popeyes 193.0 PORTFOLIO QUALITY HAS NEVER BEEN HIGHER
$1.9b of investment activity in 2019 and 2020
2019-2020 5km Average 5km Average
$ Amount Population Household Income
Acquisitions $469m 560,000 $141,000
Development Spend $320m 395,000 $124,000
Investment Total $789m 487,000 $133,000
Dispositions $1,086m 137,000 $99,000
First Capital 204.0 Density Pipeline and
Development4.0 SIGNIFICANT FUTURE DENSITY PIPELINE
Total development pipeline of 24.2m
Included IFRS values are:
Future
incremental
7.9m sf; value of $476m
density
Properties Yonge & Roselawn Toronto, ON 2150 Lake Shore Blvd W Toronto, ON
under 166k sf; value of $102m
construction
Residential
inventory 535k sf; value of $160m
1071 King St West Toronto, ON Liberty Village Toronto, ON
First Capital 224.0 FUTURE INCREMENTAL DENSITY - ENTITLEMENTS PROGRAM
• FCR submitted entitlement applications for 14.8m sf or 62% of its incremental density pipeline
• FCR expects to recognize increased IFRS values as previously submitted and future submissions are approved
• In Q4 2020, FCR monetized Place Panama (Phase 1) which included 1.0m sf of previously zoned density
sf in millions Residential Commercial Total Incremental
Pre-2019 Entitlement Applications 3.0 0.7 3.7 3.5
2019 Entitlement Applications 8.1 1.0 9.1 8.6
2020 Entitlement Applications 2.5 0.3 2.8 2.7
Total Entitlement Applications 13.6 2.0 15.6 14.8
First Capital 234.1 Properties Under Construction
(PUC) & Active Developments4.1 PUC & ACTIVE DEVELOPMENTS- DEVELOPING IN SUPER URBAN NEIGHBOURHOODS
Properties under construction: 0.2m sf; Active Development = 0.5m sf
Dundas & Aukland (GLA 310k sf) Toronto, ON Leaside Village Expansion (GLA 72k sf) Toronto, ON
200 West Esplanade (GLA 57k sf) North Vancouver, BC First Capital 254.1 PUC & ACTIVE DEVELOPMENTS- DEVELOPING IN SUPER URBAN NEIGHBOURHOODS
Centre Commercial Wilderton (GLA 633k sf) Montreal, QC Edenbridge Kingsway (GFA 252k sf) Toronto, ON
First Capital 26Property Under Construction
Dundas & Aukland
Toronto, ON
Demographics
5KM AVG
(2020 Estimates)
Population 276,000
Average Household Income $138,000
Gross Leasable Area (at 100%)
Retail GLA 43,000 sf
Residential GLA (333 Rental Units) 267,000 sf
Total GLA 310,000 sf
FCR Interest 35%
50% Partner
Key Tenants
First Capital 27Property Under Construction
Future
Centre Commercial
Wilderton
Montreal, QC
Demographics
5KM AVG
2020 Estimates
Population 646,000
Average Household Income $95,000
Property Statistics
Acreage 5 acres
Pre-redevelopment GLA 112,000 sf
Post Redevelopment GLA
Retail GLA (FCR Interest 100%) 133,000 sf
Residential GLA (not owned by FCR) 500,000 sf
Total GLA 633,000 sf
Key Tenants
First Capital 28Future Active Development
200 West Esplanade
North Vancouver, BC
Demographics
5KM AVG
2020 Estimates
Population 258,000
Average Household Income $109,000
Gross Floor Area (at 100%)
Residential GLA (75 Rental Units) 48,000 sf
Retail GLA 9,000 sf
Total GLA 57,000 sf
FCR Interest 50%
50% Partner
Targeted Start 2021
First Capital 29Active Development
Edenbridge Kingsway
Humbertown, Toronto, ON
Demographics
5KM AVG
(2020 Estimates)
Population 352,000
Average Household Income $127,000
Phase 1
Size 1.8 acres (Phase 1)
Gross Floor Area (at 100%)
Future
Retail GFA 7,000 sf
Residential GFA 245,000 sf
Total Future GFA 252,000 sf
100% Commercial
FCR Interest
50% Residential
50% Residential Partner
Targeted Start 2021
First Capital 304.2 Near Term Developments
4.2 NEAR TERM DEVELOPMENTS

       400 King Street West (GFA 453k sf)   Toronto, ON   138 Yorkville (GFA 316k sf)   Toronto, ON

                                                                                                      First Capital   32
Future Near Term Development
400 King Street West
Toronto, ON
Demographics
5KM AVG
2020 Estimates
Population 581,000
Average Household Income $129,000
Gross Floor Area (at 100%)
Residential GFA 415,000 sf
Retail GFA 38,000 sf
Total GFA 453,000 sf
FCR Interest 35%
50% Partner
Targeted Start 2021/2022
33Future
Near Term Development
138 Yorkville Avenue
Toronto, ON
Demographics
5KM AVG
2020 Estimates
Population 775,000
Average Household Income $137,000
Gross Floor Area (at 100%)
Residential GFA 268,000 sf
Retail GFA 48,000 sf
Total GFA 316,000 sf
FCR Interest 33%
Targeted Start 2021/2022
First Capital 344.3 Medium & Long Term
Developments
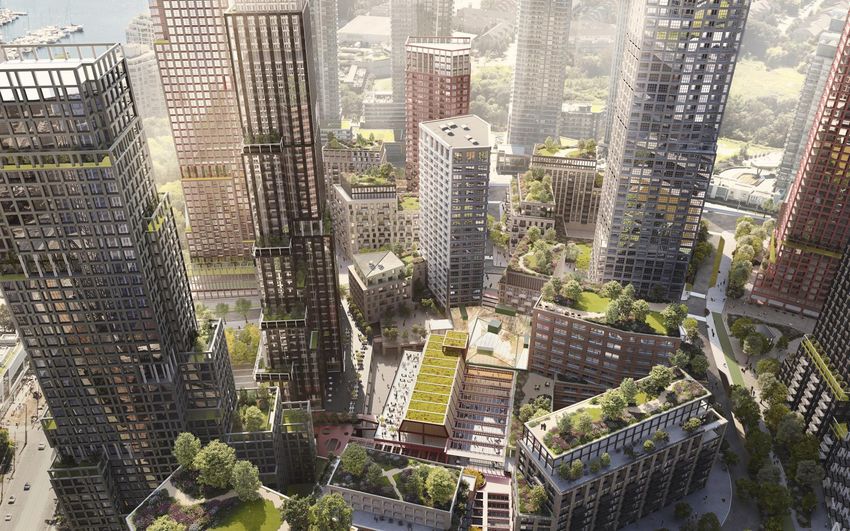
First Capital 354.2 MEDIUM & LONG TERM DEVELOPMENTS
1071 King - Liberty Village (GFA 196k sf) Toronto, ON Yonge & Roselawn (GFA 510k sf) Toronto, ON
2150 Lake Shore Blvd W (GFA 7,500k sf) Toronto, ON
First Capital 36Future Medium & Long Term Development
1071 King Street West
Toronto, ON
Demographics
5KM AVG
2020 Estimates
Population 561,000
Average Household Income $117,000
Gross Floor Area (at 100%)
Residential GFA (227 Rental Units) 191,000 sf
Retail GFA 5,000 sf
Total GFA 196,000 sf
FCR Interest 67%
33% Partner
Targeted Start 2022
First Capital 37Future Medium & Long Term Development
Yonge & Roselawn
Toronto, ON
Demographics
5KM AVG
2020 Estimates
Population 489,000
Average Household Income $194,000
Current Retail GLA 42,000 sf
Future Residential GFA (Rental Units) 445,000 sf
Future Retail GFA 65,000 sf
Total Future GFA 510,000 sf
FCR Interest 100%
Targeted Start 2022
First Capital 38Future Medium & Long Term Development
2150 Lake Shore Bvld W
Former Christie Cookie Site, Toronto, ON
Demographics
5KM AVG
2020 Estimates
Population 269,000
Average Household Income $119,000
Planned Gross Floor Area (at 100%)
Residential GFA ( ~7,500 Units) 6,300,000 sf
Non-Residential GFA 1,200,000 sf
Total GFA 7,500,000 sf
FCR interest 50%
50% Partner
Targeted Start 2023/2024
Note: Rendering is for illustrative purposes. Elements of the completed project may differ. First Capital 395.0 Environmental, Social
and Governance (ESG)
405.0 ESG INITIATIVES
170
Properties certified
120
79% of portfolio GLA LEED-certified projects
> 3.8m sf (2020)
(2020) 2020
Achieved 4-star rating
Score 78 (2020),
up from 46 (2014)
High 2021 ESG scores (1)
Environmental: 2
AAA
Social: 2 Highest rating possible
Governance: 2 (2020)
(2021)
(1) On a scale of 1-10, with 1 being the highest
First Capital 415.0 ESG INITIATIVES
Canada’s Top Small &
7.1m sf
Achieved WELL Health- 2021 Green Lease Leader
Medium Employers Safety Rating (35 properties) by Institute for Markey
Transformation
Recognized as one of First Canadian REIT to be a Honouree in the
Greater Toronto’s signatory in support of the Globe & Mail’s
Top 100 Employers Task Force on Climate- “2021 Women Lead Here” list
(2nd consecutive year) Related Financial (2nd consecutive year)
Disclosure
First Capital 425.0 ESG ROADMAP (2020-2024)
Environment Social Governance
• Develop emission and • Launch the FCR Thriving • Align disclosures with the
energy reduction targets for Neighbourhoods Task Force on Climate-
2025 and 2030, with the Foundation, with focus on 4 related Financial Disclosures
goal of carbon neutrality (net pillars: Food (TCFD) recommendations
zero emissions) by 2050 Insecurity/Poverty, Mental • Participate in sustainable
Health, Social Justice and
• Target a 50% average waste financing opportunities
Youth (achieved)
diversion rate by December • Assign a Board Trustee as
31, 2023 • Develop and implement a responsible for ESG strategy
Retail Tenant Guide to
• Install electric vehicle oversight (achieved)
charging stations at all Sustainable Operation
(achieved) • Employ ESG Taskforce to
properties by December 31, embed ESG Roadmap in
2024 • Strive to be in the Top 100 business planning, monitor
Employers ranking annually progress and assign
accountability
First Capital 435.0 ESG INITIATIVES
• 10% decrease in Greenhouse Gas (GHG) GHG Emissions
emissions since 2016
25,000
• FCR targets a 9% reduction in carbon 24,500
emissions by December 31, 2021, using 2018
as base year. By the 2020 year-end, we had 24,000
achieved an 8% reduction
23,500
• Completed our 5-year national commitment to 23,000
Emissions (tC02e)
convert all our exterior and parking lot lighting
22,500
to energy-efficient LED (2016-2020)
22,000
• 10% decrease in 2020 energy consumption,
21,500
relative to 2019
21,000
20,500
20,000
2016 2017 2018 2019 2020
First Capital 445.0 ENHANCING SUPER URBAN NEIGHBOURHOODS THROUGH PUBLIC ART
30 Public Art Installations commissioned across our portfolio
Supporting Public Art Competitions in partnership with
First Capital 455.0 STRONG GENDER DIVERSITY METRICS ACROSS THE ORGANIZATION
EXECUTIVE BOARD
MEMBERS MEMBERS
43% Women 57% Men 33% Women 67% Men
Honouree in the Globe and Mail’s
“2021 Women Lead Here” list MANAGEMENT TOTAL
ROLES EMPLOYEES
(2nd consecutive year)
Over 50% of management positions are held by females
55% Women 45% Men 59% Women 41% Men
As of June 30, 2021
First Capital 465.0 FCR SUPPORTS BLACKNORTH INITIATIVE
BlackNorth Initiative is a movement calling on Canadian
organizations to make a commitment to end systemic racism
FCR is among 300 Canadian companies who signed the pledge and committed to:
• Implement unconscious bias and anti-racism education
• Enhance diversity and inclusion strategies
• Hire at least 5% of black students by 2025
• Build a pipeline of talent with at least 3.5% of black leaders in the more senior ranks of the
company by 2025
First Capital 476.0 Financial Strength
andSuper
Flexibility
Urban
Neighbourhoods6.0 CAPITAL STRUCTURE (1)
Enterprise Value $8.6b
$b WAIR (2)
Mortgages 1.4 3.5%
17% Secured Facilities 0.1 2.1%
Total Secured 1.5 3.3%
Unsecured Debentures 2.3 4.0%
Unsecured Term Loans 0.8 2.8%
38%
Unsecured Revolving Facilities
0.1 1.2%
($800m total capacity)
Total Unsecured 3.2 3.6%
Total Debt 4.7 3.6%
Trust & Exchangeable Units 3.9
45%
(220m units)
(1) As of June 30, 2021
(2) Weighted average interest rate
First Capital 496.0 FINANCIAL STRENGTH AND FLEXIBILITY
As at Q2 2021 2020 2019 2018 2017
Unsecured revolving credit facilities
$800 $800 $800 $800 $800
(million)
69% Unencumbered assets (billion) $7.0 $7.0 $7.0 $7.3 $7.4
of Q2 2021 assets
Unencumbered assets to unsecured
2.2x 2.1x 2.2x 2.5x 2.4x
debt
Secured debt as % of total assets 14.8% 15.2% 14.6% 14.1% 12.7%
Net debt to total assets 46.3% 47.3% 46.7% 42.2% 43.8%
Net debt to EBITDA 11.8x 12.0x 10.0x 9.6x 9.8x
EBITDA interest coverage 2.2x 2.1x 2.4x 2.5x 2.5x
First Capital 506.0 WELL-STAGGERED TERM DEBT MATURITIES ($MILLIONS)
$800 5.5%
Weighted Average Interest Rate 3.8% Unsecured Term Loans
Millions
Mortgages
5.0%
Term to Maturity 4.4 years $700 Senior Unsecured Debentures
4.5%
95% of Term Debt is Fixed Rate 4.4%
Weighted Average Effective Interest %
4.3%
$600
4.0% 4.0%
3.9%
3.7% 3.6%
$500 3.5% 3.5% 3.5% 3.5%
3.3%
3.0%
2.9%
$400
2.5%
$300 2.0%
1.5%
$200
1.0%
$100
0.5%
$- 0.0%
2021 2022 2015 2023 2024 2016
2025 2026 2017
2027 2028 2018
2029 2030 2019
2031
As of June 30, 2021 % Due (1) 0.9% 13.0% 11.9% 16.8% 10.2% 14.3% 13.8% 8.2% 5.6% 4.0% 1.3%
(1) Not including principal amortization
First Capital 516.0 FFO PAYOUT RATIO: CREATING MEANINGFUL FLEXIBILITY TO ADVANCE OUR STRATEGIC OBJECTIVES
Enhancing Financial Strength and Flexibility through Temporary Distribution Cut
$350 90%
85%
82% $302
$300 78% $287
$284 80%
$250 $236 $261 $250 (2)
74% $225 70%
71%
70%
$200
60%
$150
50%
$100
$50 40%
40%
$0 30%
2015 2016 2017 2018 2019 2020 2021E
FFO excl OGLE/unit $1.05 $1.10 $1.16 $1.21 $1.24 $1.02 $1.15 (2)
Cash Distributions per unit $0.86 $0.86 $0.86 $0.86 $0.86 $0.86 $0.43 (3)
ACFO less Distributions $25m (1) $32m $34m $55m $49m $15m N/A 2019
2015 2016 2017 2018
(1) Annual retained operating cash
(2) 2021 Estimate Consensus FFO per unit and implied total FFO
(3) Reduced annualized distribution per unit (to $0.43) from $0.86 effective January 2021 distribution paid to unitholders in February 2021
First Capital 52Appendix I - COVID–19 Update
APPENDIX I – GOVERNMENT SUPPORT PROGRAMS AND COVID-19 UPDATE

 Canada Emergency Commercial Rental Assistance (“CECRA”) Program
 • Covered the months of April through September 2020
 • Property owner abated 75% of the qualifying tenant’s gross rent; government extended forgivable loan to
   the property owner for 50% of the gross rent; and tenant paid remaining 25% of gross rent
 Canada Emergency Rent Subsidy (“CERS”)

 • Commenced on September 27, 2020 in order to extend rent support by delivering direct, targeted and
   accessible rent support to qualifying tenants that have suffered a revenue drop. No requirement of
   landlords to abate rent, as was the case with CECRA
 • Program subsidizes up to 65% of eligible expenses (including rent, property insurance and property taxes)
   and provides an additional 25% top-up for tenants temporarily shut down to a maximum of $75,000 per
   location and an overall maximum of $300,000 for all locations per 4-week claim period
 • Program extended an additional 20 weeks to October 23, 2021
     o Effective July 3, 2021, only applicants with a minimum revenue decline of 10% can participate
     o After July 3, 2021, subsidy rate declines in each of the subsequent reporting periods (60%, 40% and
       20%, respectively) with the lockdown support rate remaining consistent at 25%.

                                                                                                    First Capital   54
APPENDIX I – SAFETY MEASURES AT FCR PROPERTIES
Provincial Restrictions + Guidelines: Hygiene: hand sanitizer in common Physical Distancing: encouraging
as directed by the Chief Medical areas, enhanced cleaning/disinfection distancing of 2 metres with signs &
Officer & Public Health Officials of high frequency touchpoints, public floor decals, use of alternate sinks &
awareness signage stalls in washrooms, queuing lines for
accessing retailers
Quick Pick-Up: designated parking Building Operations: dedicated PPE: by-law enforcement of mandatory
areas for contactless curbside access points as IN or OUT only, mask coverings in indoor common areas
pickup and in-mall customer pick- elevator & escalator passenger & retail businesses, PPE dedicated
up areas limits, promoting staircase use, waste disposal receptacles near
directing flow of movement with entrance points
floor decals
First Capital 55APPENDIX I – CANADIAN RETAIL SALES
Following June’s gains, retail spending recovered to above pre-crisis levels in 9 of the 11 retail
sub-sectors
Variation in Retail Sales
(June 2021 vs February 2020)
• Canada’s retail sales rose for fourteenth month in a row
in June 2021 Miscellaneous 24.9%
Building material 21.3%
• June 2021 retail sales exceeded February 2020 sales for
most retail categories, including those in which First Electronics/appliance 15.7%
Capital’s tenants operate:
Furniture/home furnishing 14.5%
• Food/beverage 8.5% Sporting goods/hobby 14.0%
• Health/personal care 4.5%
General merchandise 13.5%
• First Capital has minimal exposure to retail categories Food/beverages 8.5%
that continue to suffer from the pandemic, namely
Motor Vehicles and parts 5.0%
gasoline (-0.8%) and clothing (-11.6%)
Health/personal care 4.5%
Gasoline stations -0.8%
Clothing -11.6%
TOTAL 7.5%
Source: Statistics Canada (seasonally adjusted)
First Capital 56Appendix II –
Profiling Super Urban
Neighbourhoods
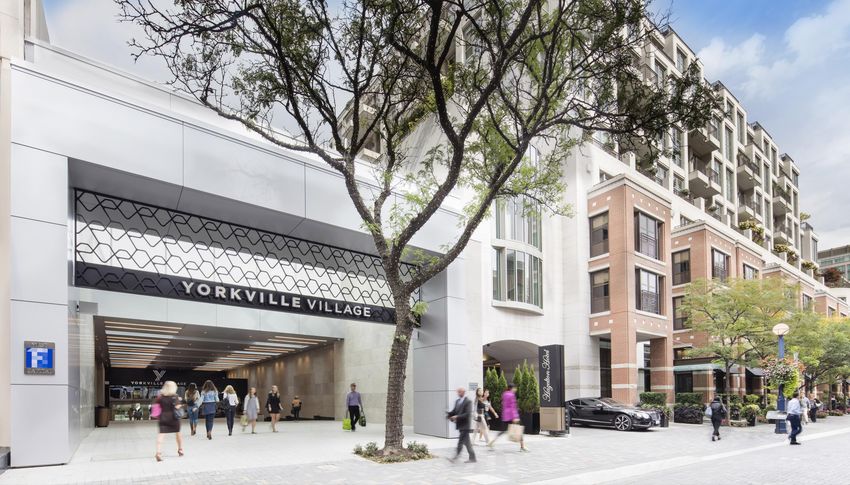
57Super Urban Neighbourhood
Bloor-Yorkville
Toronto, ON
Demographics
5KM AVG
2020 Estimates
Population 766,000
Average Household Income $138,000
Gross Leasable Area
Yorkville Village 315,000 sf
One Bloor East 85,000 sf
Hazelton Hotel 49,000 sf
Total Bloor/Yorkville 449,000 sf
Future Density 117,000 sf
Key Tenants
First Capital 58APPENDIX II - SUPER URBAN NEIGHBOURHOOD - BLOOR-YORKVILLE
Bloor-Yorkville
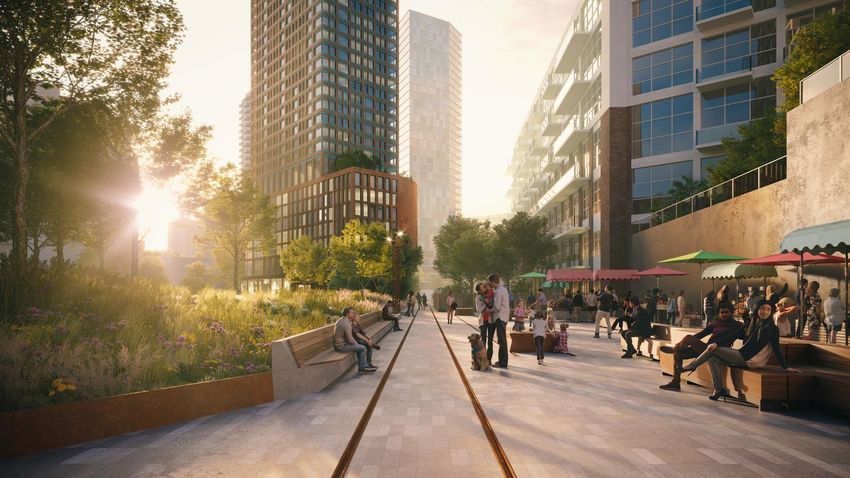
A 138 Yorkville Avenue
B Yorkville Village Mall C Hazelton Hotel
First Capital 59APPENDIX II - YORKVILLE VILLAGE ACHIEVES #1 DESTINATION STATUS FOR NEW RETAIL
Despite the pandemic, 13 international retailers entered the Canadian market in 2020
23% chose Yorkville Village for their first location, including:
Contemporary women’s Lab-grown, sustainable diamonds High performance
fashion brand and engagement rings electric car brand
(FRANCE) (USA) (SWEDEN)
Trend Continues In 2021
Multi-brand luxury retailer
(USA)
Source: Retail Insider (January 4, 2021)
First Capital 60Super Urban Neighbourhood
Liberty Village
Toronto, ON
Property Statistics
5KM AVG
2020 Estimates
Population 565,000
Average Household Income $118,000
Gross Leasable Area
Retail GLA 396,000 sf
Residential GLA 328,000 sf
Office GLA 103,000 sf
Total GLA 827,000 sf
Acreage 14.1
Future Density 755,000 sf
Key Tenants
First Capital 61Super Urban Neighbourhood
Liberty Village Burger Drops successfully opens during COVID September 2020 Opening
First Capital 62Super Urban Neighbourhood
King High Line
Liberty Village, Toronto, ON
Property Statistics
Acreage 2.8
Residential Units 506
Retail GLA 157,000 sf
100% Commercial
FCR Interest
67% Residential
Commercial Tenants
First Capital 63Super Urban Neighbourhood
Griffintown
Montreal, QC
Demographics
5KM AVG
2020 Estimates
Population 423,000
Average Household Income $101,000
Retail GLA 254,000 sf
Acreage 3.2
Key Tenants
First Capital 64Calgary's Premier Super Urban Neighbourhood
Mount Royal Village
Calgary, AB
Demographics
5KM AVG
2020 Estimates
Population 235,000
Average Household Income $148,000
Gross Leasable Area 380,000 sf
Acreage 4.1 .
Key Tenants
First Capital 65Super Urban Neighbourhood
The Brewery District
Edmonton, AB
Demographics
5KM AVG
2020 Estimates
Population 216,000
Average Household Income $95,000
Gross Leasable Area (at 100%)
Retail GLA 238,000 sf
Office GLA 37,000 sf
Total GLA 275,000 sf
FCR Interest 50%
Key Tenants
First Capital 66Super Urban Neighbourhood
False Creek Village
Vancouver, BC
Demographics
5KM AVG
2020 Estimates
Population 429,000
Average Household Income $108,000
Retail GLA 63,000 sf
Key Tenants
First Capital 67Adam Paul
President & CEO
Neil Downey
Executive VP, Enterprise Strategies & CFO
First Capital
Shops at King Liberty
85 Hanna Ave, Suite 400
Toronto, ON
Tel: 416-504-4114
fcr.ca
TSX: FCR.UN
68You can also read