Epidemiological Update Coronavirus disease - (COVID-19)
←
→
Page content transcription
If your browser does not render page correctly, please read the page content below
Epidemiological Update
                                                           Coronavirus disease
                                                                  (COVID-19)

                                                                                    26 August 2020

Context
On 31 December 2019, the People’s Republic of China reported a cluster of pneumonia
cases with unknown etiology, later identified on 9 January 2020 as a novel coronavirus by the
Chinese Center for Disease Control and Prevention. On 30 January 2020, the World Health
Organization (WHO) declared the new outbreak a Public Health Emergency of International
Concern (PHEIC). On 11 February 2020, WHO named the disease “coronavirus disease 2019
(COVID-19),” and the International Committee on Taxonomy of Viruses (ICTV) named the
virus “severe acute respiratory syndrome coronavirus 2 (SARS-CoV-2).” COVID-19 was
declared a pandemic by WHO in March 2020, and on 31 July 2020, the PHEIC was reaffirmed
at the fourth meeting of the Emergency Committee, convened by the WHO Director-General
under the International Health Regulations (IHR) (2005) regarding COVID-19.1 On 9 July 2020,
the co-chairs of the Independent Panel for Pandemic Preparedness and Response (IPPR)
were announced, to evaluate the world’s response to COVID-19, following a resolution
adopted in May 2020 by the World Health Assembly.2

Epidemiological Highlights - Region of the Americas
Since the last PAHO/WHO COVID-19 Epidemiological Update published on 23 June 2020, and
up to 22 August 2020, 14 million new cases of COVID-19, including over 300,000 deaths, have
been reported worldwide. Of the total, three countries account for 60% of the new cases:
The United States of America (24%), India (18%), and Brazil (17%). The majority of new deaths
were reported by Brazil (19%), the United States of America (16%), India (13% ), and Mexico
(12%). As of 22 August, the daily notifications of cases in the United States of America and
Brazil are trending downwards, whereas in India, a sustained increase has been observed
over the past two months.

1 Statement on the fourth meeting of the International Health Regulations (2005) Emergency Committee
regarding the outbreak of coronavirus disease (COVID-19). Available at: https://bit.ly/3li7iOx
2 Independent evaluation of global COVID-19 response announced. Available at: https://bit.ly/31hLJWp

Suggested citation: Pan American Health Organization / World Health Organization. Epidemiological
Update: Coronavirus disease (COVID-19). 26 August 2020, Washington, D.C.: PAHO/WHO; 2020

Pan American Health Organization • http://www.paho.org • © PAHO/WHO, 2020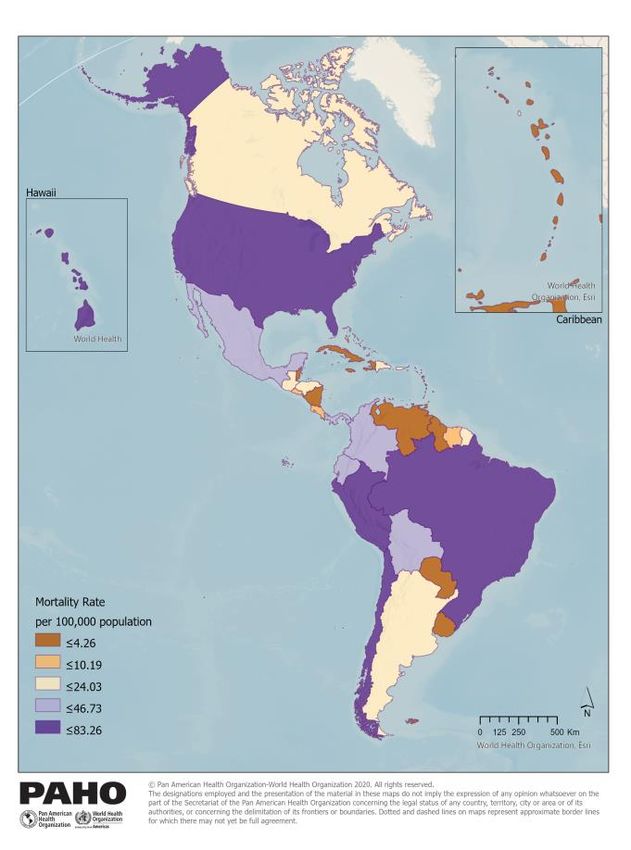
Global Situation Summary
As of 22 August 2020, close to 23 million cases of COVID-19, including approximately 795,000
deaths, were reported globally among 216 countries, territories, or areas (see Figure 1).3
Figure 1. Distribution of new cases of COVID-19 by date of report and WHO Region. 31
December 2019 - 22 August 2020.

Source: WHO Dashboard 23 August 2020.

Since the last PAHO/WHO COVID-19 Epidemiological Update published on 23 June 20204 and
up to 22 August 2020, the number of cases and deaths worldwide has increased by 158% (~14
million additional cases) and 72% (>300,000 additional deaths), respectively. The majority of
new cases reported over the prior two months were reported from the Region of the Americas
(56%) and the South-East Asia Region (SEARO) (20%). Three countries in those two Regions
contributed to approximately 60% of the new cases: The United States of America (24%, 3
million new cases), India (18%, 2.5 million new cases) and Brazil (17%, 2.4 million new cases).
As of 22 August, the daily notifications of cases in the United States of America and Brazil
appear to be trending downwards, whereas in India, a sustained increase has been observed
over the prior two months.
The Region of the Americas accounts for 64% of the new deaths reported globally over the
prior two months (~213,000 new deaths), though the Region only accounts for approximately
13% of the global population. The majority of the new deaths globally were reported by Brazil
(19%, ~62,000 new deaths), the United States of America (16%, ~54,000 new deaths), India
(13%, ~42,000 new deaths), and Mexico (12%, ~38,000 new deaths).

3WHO Coronavirus Disease (COVID-19) Dashboard. Available at: https://covid19.who.int
4PAHO/WHO Epidemiological Update on Coronavirus disease (COVID-19), 23 June 2020. Available at:
https://bit.ly/3kPH6um
                                                -2-

Pan American Health Organization • http://www.paho.org • © PAHO/WHO, 2020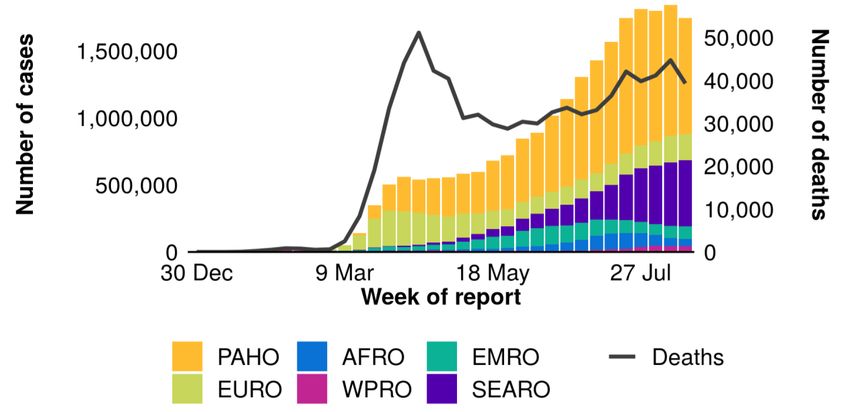
Situation Summary in the Region of the Americas5
All 54 countries and territories in the Region of the Americas have reported COVID-19 cases
and deaths. As of 22 August 2020, there are more than 12.3 million cases of COVID-19,
including approximately 439,000 deaths, which is nearly triple the number of reported cases
and almost twice the number of reported deaths since 22 June (4.4 million cases, including
224,000 deaths). Of the almost 8 million new cases reported in the prior two months, 73% were
reported by the United States of America (42%) and Brazil (31%). These two countries also
account for 54% of the new deaths reported; 29% of the new deaths were reported by Brazil
and 25% were reported by the United States of America, followed by 18% in Mexico and 9%
in Peru.
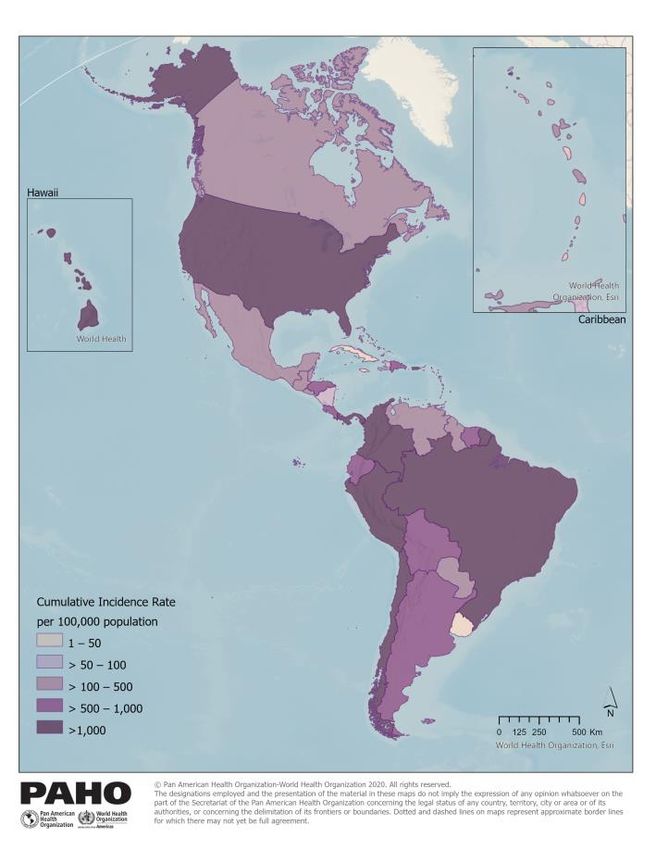
Map 1. Cumulative incidence rate of COVID-19 cases (A) and mortality rate (B) per 100,000
population in the Region of the Americas by country/territory. As of 23 August 2020.
A B
5 Up to date information on COVID-19, including Situation Reports, Weekly Press Briefings, and the COVID-19
Information System for the Region of the Americas can be accessed online from the Coronavirus Disease
(COVID-19) pandemic page.
-3-
Pan American Health Organization • http://www.paho.org • © PAHO/WHO, 2020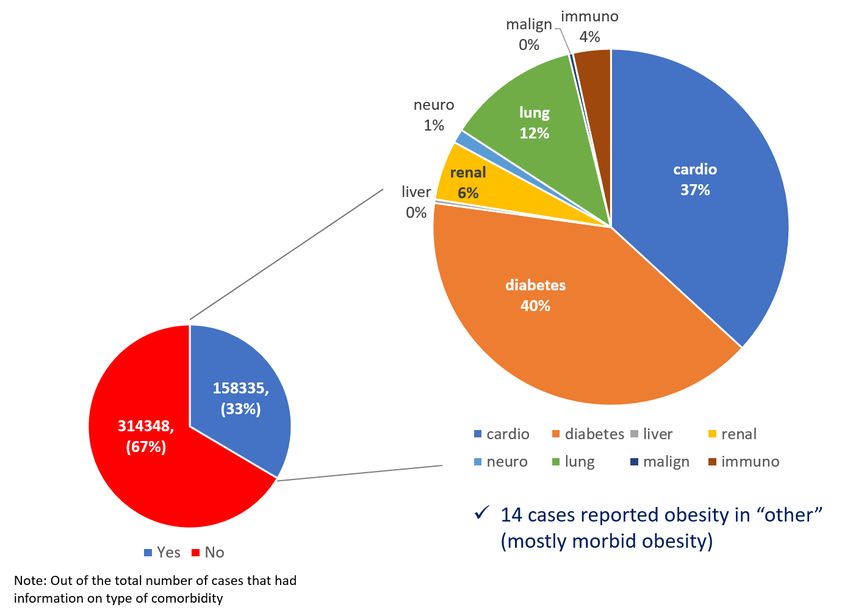
The countries and territories with the highest cumulative incidence rates are French Guiana
(2,945 cases per 100,000 population) and Chile (2,070 cases per 100,000 population), followed
by Panama, Peru, the United States of America, Brazil, and Aruba, which each reported a
cumulative incidence rate greater than 1,000 cases per 100,000 population (see Map 1A).
The countries with the highest cumulative per capita death rate as of 22 August are Peru (83
deaths per 100,000 population), Chile (56 deaths per 100,000 population), Brazil (53 deaths
per 100,000 population), and the United States of America (53 deaths per 100,000 population)
(see Map 1B).
In the Region of the Americas, while COVID-19 cases seem to have steadied in some
countries and territories at the national level (e.g. the United States and Canada), daily
notification rates are now accelerating in other countries and territories, many of which are
experiencing larger outbreaks for the first time since the onset of the pandemic in the Region
(e.g. countries and territories in the Caribbean subregion). A decreasing trend in the daily
incidence of cases is mainly from countries in the North America subregion, primarily the
United States of America (see Figure 2). Trends throughout this report should be interpreted
with caution as they are dependent on a number of factors which vary considerably
between countries and territories (e.g. testing rates, case definitions, time delays between
diagnosis, laboratory results, and official notification, etc.).
Figure 2. Distribution of new COVID-19 cases by epidemiological week (EW) of report and by
country/territory. Region of the Americas. EW 4 – EW 34, 2020.

Source: Data provided by the Ministries and Institutes of Health of the countries and territories of the Region
and reproduced by PAHO/WHO.

                                                     -4-

Pan American Health Organization • http://www.paho.org • © PAHO/WHO, 2020
North America
The North America subregion, which consists of Canada, Mexico, and the United States of
America, accounts for 50% of the total cases and 55% of the total deaths reported to date in
the Region of the Americas. Of the approximately 3.7 million new cases, including the almost
93,000 new deaths, reported in the subregion in the prior two months, the majority of the new
cases were reported by the United States of America (89%), followed by Mexico (10%) and
Canada (1%). With regards to the new deaths, approximately 58% were reported by the
United States of America, 41% by Mexico, and 1% by Canada. All three countries have
reported community transmission per the WHO classification for COVID-19 transmission
category.
Notification of daily COVID-19 cases began increasing in epidemiological week (EW) 11 of
2020 and reached a peak in EW 30 (19 - 25 July), when 516,070 new cases were reported,
primarily from the United States of America (see Figure 3). Since then, the daily notification of
cases has gradually declined, with a total of 349,737 cases reported during EW 34 (16 - 22
August), a 32% decrease compared to the peak shown in Figure 3.
Figure 3. Distribution of COVID-19 cases by epidemiological week (EW) of notification. North
America subregion. EW 11 – EW 34, 2020.

Source: Data provided by the Ministries and Institutes of Health of the countries and territories of the Region
and reproduced by PAHO/WHO.

                                                     -5-

Pan American Health Organization • http://www.paho.org • © PAHO/WHO, 2020
North America’s decrease in daily case notifications is due in large part to the decreasing
trend in daily cases in the United States of America, which had its second peak at the end of
July. Per the United States Centers for Disease Control and Prevention (US CDC), the
percentage of respiratory specimens testing positive for SARS-CoV-2 decreased from 6.9% in
EW 32 to 6.3% in EW 33, and decreased or remained the same in nine of ten Health and
Human Services regions.6
In Canada,7 average daily case counts at the national level have remained stable over the
past three weeks, and the number of hospitalizations and deaths remain low overall. In
Mexico, the daily notification of cases appears to be on a downward trend, with 5,481 cases
reported on 22 August (7-day moving average), compared to the 7-day average of 7,022
cases reported on 2 August, a 22% relative decrease.
Central America8
As of 22 August, the total confirmed cases (~266,000) and deaths (7,203) have each
increased by over 300% in the Central America8 subregion, compared to the totals (61,058
cases and 1,580 deaths) reported as of the last PAHO/WHO COVID-19 Epidemiological
Update on 23 June 2020. Of the almost 205,000 new cases reported in the prior two months,
the majority were reported by Panama (29%), Guatemala (27%), and Honduras (20%). The
same three countries also made up the majority (83%) of new deaths reported in the
subregion, with Guatemala accounting for the highest proportion (36%), followed by Panama
(24%) and Honduras (23%). Belize and Costa Rica experienced the highest relative increases
in cases compared to the total number of cases reported as of the last PAHO/WHO COVID-
19 Epidemiological Update on 23 June 2020: a 29-fold increase in Belize (626 new cases) and
a near 15-fold increase in Costa Rica (~30,000 new cases). Costa Rica also experienced a 28-
fold increase in deaths (328 new deaths) compared to the total number of deaths reported
as of 23 June 2020.
Notification of daily COVID-19 cases began increasing in EW 13 of 2020 and reached a peak
in EW 30 (19 - 25 July), when 29,795 new cases were reported, primarily from Guatemala,
Panama, and Honduras (see Figure 4). After a 15% decrease in cases during EW 31, the next
substantial difference in the weekly notification of cases occurred between EW 33 and EW
34, when an 8% decrease was observed (see Figure 4).
6 United States CDC. Key Updates for Week 33, ending August 15, 2020. Available at: https://bit.ly/3gtSzwf
7 Statement from the Chief Public Health Officer of Canada on August 24, 2020. Available at: PHAC
8 Belize, Costa Rica, El Salvador, Guatemala, Honduras, Nicaragua, and Panama.
-6-
Pan American Health Organization • http://www.paho.org • © PAHO/WHO, 2020Figure 4: Distribution of COVID-19 cases by epidemiological week (EW) of notification. Central
America subregion. EW 10 – EW 34. 2020.
Source: Data provided by Ministries and Institutes of Health of the countries and territories of the Region and
reproduced by PAHO/WHO.
In the Central America subregion, Panama has reported the highest cumulative incidence
of COVID-19 cases (1,913 cases per 100,000 population), followed by Costa Rica (571 cases
per 100,000 population) and Honduras (515 cases per 100,000 population). The highest rates
of cumulative deaths per capita were reported by Panama (41 deaths per 100,000
population), Honduras (16 deaths per 100,000 population), and Guatemala (14 deaths per
100,000 population).
To date, all seven countries in the Central America subregion have reported community
transmission per the WHO classification for COVID-19 transmission category. Belize was the
last country in the subregion to join that classification rank, when they declared community
transmission on 20 August with 553 confirmed cases including five deaths.
-7-
Pan American Health Organization • http://www.paho.org • © PAHO/WHO, 2020Caribbean and Atlantic Ocean Islands9
The Caribbean and Atlantic Ocean Islands subregion reported more than 100,000 new cases,
including 1,384 deaths, since the last PAHO/WHO COVID-19 Epidemiological Update on 23
June 2020, a 230% and 123% increase in cases and deaths, respectively. Eighty percent of
new cases reported in the prior two months were from the Dominican Republic (59%) and
Puerto Rico (21%). The Dominican Republic reported 64% of the new deaths, followed by
Puerto Rico (17%) and Haiti (8%). In addition to the Dominican Republic, Puerto Rico, French
Guiana, and Haiti, the countries and territories of Aruba, Sint Maarten, Suriname, Trinidad and
Tobago, and the U.S. Virgin Islands now also have community transmission.
In this subregion, the notification of daily COVID-19 cases began increasing in EW 12 of 2020
(15 – 21 March) and reached a high of 15,636 new cases reported in EW 31 (26 July - 1 August),
primarily from the Dominican Republic and Puerto Rico (see Figure 5).
Figure 5: Distribution of COVID-19 cases by epidemiological week (EW) of notification.
Caribbean and Atlantic Ocean Islands subregion. EW 10 – EW 34, 2020.
Source: Data provided by Ministries and Institutes of Health of the countries and territories of the Region and
reproduced by PAHO/WHO.
9 Anguilla, Antigua and Barbuda, Aruba, the Bahamas, Barbados, Bermuda, Bonaire, Sint Eustatius and
Saba, the British Virgin Islands, the Cayman Islands, Cuba, Curacao, Dominica, the Dominican Republic,
the Falkland Islands, Grenada, Guadeloupe, French Guiana, Guyana, Haiti, Jamaica, Martinique,
Montserrat, Puerto Rico, Saint Barthélemy, Saint Kitts and Nevis, Saint Lucia, Saint Martin, Saint Pierre and
Miquelon, Sint Maarten, Saint Vincent and the Grenadines, Suriname, Trinidad and Tobago, Turks and
Caicos, and the U.S. Virgin Islands.
-8-
Pan American Health Organization • http://www.paho.org • © PAHO/WHO, 2020The weekly number of new cases has been fluctuating since EW 31, with a 15% decrease in
EW 32, a 10% increase in EW 33, followed by a 10% decrease in EW 34, relative to the previous
weeks (see Figure 5). Countries and territories such as Aruba, the Bahamas, Sint Maarten,
Trinidad and Tobago, and Turks and Caicos generally began reporting an increase in the
daily number of cases since the last report, with an acceleration in cases reported in the prior
two weeks; all of which relaxed their social distancing and public health measures in July,
including the re-opening of airports.
South America10
Following North America, South America remains the subregion with the highest number of
confirmed cases and deaths reported to date. As of 22 August, the 10 countries in the
subregion have reported a combined total of more than 5.6 million cases, including close to
186,000 deaths, nearly three times the number of cases and more than twice the number of
deaths since the last report (~1,780,000 cases, including ~71,500 deaths). All of the countries
have reported community transmission except for Uruguay (Clusters of cases).
The shape of the epidemic curve in South America (see Figure 6) is largely attributed to the
situation in Brazil, which has the second highest number of cumulative cases and deaths
reported to date at both the global and regional levels. Of the 3.8 million new cases reported
in the prior two months, Brazil accounts for the highest proportion of cases (64%), followed by
Colombia (12%), Peru (8%), and Argentina (7%). Similarly, of the 106,000 new deaths, the
highest proportions were reported by Brazil (55%), Peru (17%), and Colombia (13%).
10 Argentina, Bolivia, Brazil, Colombia, Ecuador, Paraguay, Peru, and Venezuela.
-9-
Pan American Health Organization • http://www.paho.org • © PAHO/WHO, 2020Figure 6: Distribution of COVID-19 cases by epidemiological week (EW) of notification. South
America subregion. EW 10 - EW 34, 2020.
Source: Data provided by Ministries and Institutes of Health of the countries and territories of the Region and
reproduced by PAHO/WHO.
In South America, the weekly notification of COVID-19 cases began increasing in EW 13 of
2020 (22 – 28 March) and reached a high of more than 530,000 new cases reported in EW 33
(9 - 15 August), primarily from Brazil, Colombia, and Peru (see Figure 6). A 10% decrease in
cases was observed in EW 34 (16 - 22 August).
- 10 -
Pan American Health Organization • http://www.paho.org • © PAHO/WHO, 2020Highlight - Comorbidities and Age as Risk Factors for COVID-19
If an individual becomes infected, the risk of severe COVID-19 is known to be higher among
older adults and those with underlying health conditions. Understanding the number of
individuals at increased risk of severe COVID-19 can inform the design of strategies to protect,
manage chronic care conditions, and guide vaccine allocation for those at-risk.11,12
Populations at increased risk of severe COVID-19 are those with at least one underlying health
condition.§ The population at high risk is also estimated, and includes those who would require
hospitalization if infected.13 In the Americas, three out of ten people (29%), nearly 325 million
people, are at increased risk of developing severe COVID-19 due to underlying health
conditions, while there are 43 million people at high risk. A similar scenario is presented for
Latin America and the Caribbean, where about 186 million people (26%) are at increased
risk and 25 million (4%) are at high risk of severe COVID-19 (see Figure 8).18
Figure 8. Number (in millions) and percentage of population by number of underlying
conditions and increased risk – High prevalence estimates.
Sourceꓽ Adapted from Clark A. at al. Global, regional, and national estimates of the population at increased
risk of severe COVID-19 due to underlying health conditions in 2020: a modelling study. The Lancet Global
Health. 2020 Jun 15.
11 PAHO, 2020. COVID-19 and comorbidities in the Americas: Background information. Available at:
https://bit.ly/3goDtYT
12 PAHO, 2020. COVID-19 and comorbidities in the Americas: Frequently asked questions. Available at:
https://bit.ly/2FTtLkO
13 Clark A, Jit M, Warren-Gash C, Guthrie B, Wang HH, Mercer SW, Sanderson C, McKee M, Troeger C, Ong
KL, Checchi F. Global, regional, and national estimates of the population at increased risk of severe
COVID-19 due to underlying health conditions in 2020: a modelling study. The Lancet Global Health. 2020
Jun 15. https://bit.ly/2Yv6uvU
§ The 14 underlying health conditions are listed as “at increased risk” in public health agencies guides
(WHO, CDC, and PHE) and include: cardiovascular disease, chronic kidney disease, chronic respiratory
disease, chronic liver disease, diabetes, cancers with immunosuppression, cancer with possible
immunosuppression caused by treatment, HIV/AIDS, tuberculosis, chronic neurological disorders, sickle cell
disorders, tobacco smoking, severe obesity, and hypertension.
- 11 -
Pan American Health Organization • http://www.paho.org • © PAHO/WHO, 2020Persons over the age of 65 are at-risk of experiencing more severe disease, as the likelihood
of developing multiple health conditions increases with age. Working-age adults, i.e.,
individuals between 15 and 64 years, are also vulnerable, as many of them live with one or
more underlying health conditions (see Figure 9).3
Figure 9. Percentage of population at increased risk of severe COVID-19 by age, Latin
America and the Caribbean – High prevalence estimates.
Working age
population
Sourceꓽ Adapted from Clark A. at al. Global, regional, and national estimates of the population at increased
risk of severe COVID-19 due to underlying health conditions in 2020: a modelling study. The Lancet Global
Health. 2020 Jun 15.
These estimates provide information that may help countries tailor their response to better
protect vulnerable groups from risk and to implement innovative programs to help individuals
safely and more consistently manage their conditions.
Comorbidities and Outcomes among COVID-19 Reported Cases in Latin America and the
Caribbean
As part of the incident management system established to respond to the COVID-19
pandemic, countries of the Region of the Americas have reported individual-level data for
COVID-19 probable and confirmed cases, including demographic, clinical, and
epidemiological characteristics, as well as information on potential risk factors for both SARS-
CoV-2 infection and complications following infection.
Of 762,302 COVID-19 cases (probable or confirmed) from 36 countries and territories in Latin
America and the Caribbean (LAC), representing 28% of all confirmed and probable cases
reported in the Region of the Americas as of 17 June 2020, the majority were from South
America (588,225; 77%), while 159,930 (21%) were from Central America and 162,243 (2%)
were from the Caribbean and Atlantic Ocean Islands subregions. Of the total cases, 349,462
(54%) were male, 46,922 (6%) were agedOf the 393,742 COVID-19 cases (52%) with information regarding hospital admission, 174,252 (44%) were admitted to a hospital; fifty-eight percent of adults ≥60 years and 43% of adults 20-59 years compared to 24% of
Figure 10. Type of comorbidity reported among COVID-19 cases LAC, June 17, 2020

Source: Data provided by the Ministries and Institutes of Health of the countries and territories of the Region
and reproduced by PAHO/WHO.

Overall, the analysis showed that hospitalization and severe hospitalization were associated
with older age. One-third of COVID-19 cases reported at least one comorbidity. Among the
most frequently reported comorbidities were diabetes, heart disease, and lung disease. The
presence of at least one comorbidity, regardless of its severity, was associated with increased
hospitalization, severe hospitalization, and death. The association between comorbidities
and serious COVID-19 outcomes increased with the cumulative number of comorbidities.
Findings highlighted the importance of reinforcing risk communication messages for high-risk
groups, including the elderly and individuals with chronic conditions.

                                                    - 14 -

Pan American Health Organization • http://www.paho.org • © PAHO/WHO, 2020
Highlight - COVID-19 Among Indigenous populations
From the beginning of the COVID-19 pandemic in the Region of the Americas and until 22
August, 93,622 confirmed cases, including 1,893 deaths (2.0%), were reported among
indigenous peoples or communities in 11 countries for which information was available in the
Americas.
Comparing the current data with the data published in the PAHO/WHO Epidemiological
Update on 5 August,14 the highest relative increase in the number of cases has been observed
among the indigenous peoples of Colombia, followed by Ecuador and Brazil. With regards to
the number of deaths, the highest relative increase has been observed in Ecuador, followed
by Colombia (see Table 1).
Table 1. Number of confirmed cases and deaths of COVID-19 among indigenous peoples in
the Region of the Americas. 1 January to 21 August 2020.15
Relative Relative
Number of Number of
Country Indigenous nations or indigenous communities increase in increase in
confirmed cases deaths
casesǂ deathsǂ
Moxeño Trinitario, Movima, Mojeño ignaciano, Cabineño, Trinitario río
mamoré, Guarayos, Chiquitano, Cuyubaba, Esse ejja, Tacana
Bolivia 1,881 89 n/a n/a
cabineño, Guaraní, Yucaré, Baure, Itonama, Sirionó, Ayoreo, Mosetén,
Yuqui, Canichana, Leco de apolo, and Araona
Alagoas and Sergipe, Altamira, Alto Rio Juruá, Alto Rio Negro, Alto Rio
Purus, Alto Rio Solimões, Amapá e Norte do Pará, Araguaia, Bahia,
Ceará, Cuiabá, Guamá-Tocantins, Interior Sul, Kaiapó do Mato Grosso,
Kaiapó do Pará, Leste de Roraima, Litoral Sul, Manaus, Maranhão, Mato
Brazil* 21,142 352 50% 36%
Grosso do Sul, Médio Rio Purus, Médio Rio Solimões e Afluentes, Minas
Gerais e Espírito Santo, Parintins, Pernambuco, Porto Velho, Potiguara,
Rio Tapajós, Tocantins, Vale do Javari, Vilhen, Xavant, Xing, and
Yanomami
Canada** Alberta, British Columbia, Quebec, Ontario, and Saskatchewan 429 6 6% 0%
Ambaló, Andoque, Arhuaco, Awá, Bari, Bora, Cocama, Coconuco,
Coreguaje, Cubeo, Curripaco, Desano, Dujos (Tamas), Embera,
Embera Chami, Embera Katio, Esperara Siadipara, Guayabero, Inga,
Kamëntsa, Kankuamo, Kichwa, Kizgó, Kofán, Matapí, Miraña, Misak
Colombia (Guambiano), Mokana, Muinane, Muisca, Murui (Uitoto), Nasa (Paéz), 6,478 236 52% 56%
Pasto, Piapoco, Pijao, Piratapuyo, Polindara, Puinave, Quillacinga, Sáliva,
Sikuani (Guahibo), Siona, Tanimuca, Tariano, Tikuna, Totoró, Tubara,
Tucano, U'wa,Wayuu, Wiwa, Wounaan (Waunana), Yagua, Yanacona,
Yukpa, Yukuna, and Zenú
Achuar, Cofan, Kichwa, Secoya, Shiwiar, Shuar, Siona, Waorani and
Ecuador 2,113 86 45% 219%
Zapara
Guatemala Maya, Garífuna, and Xinca 2,675 131 n/a n/a
Mexico Persons that recognizes themselves as indigenous 6,072 877 12% 15%
Comarca Ngäbe-Bugle, Comarca Emberá Wounaan, Comarca Guna de
Panama Wargandí, Comarca Guna de Madungandí, Territorio Emberá Alto 2,415 47 n/a n/a
Bayano, and Tierras colectivas Emberá Wounaan
Awajun (aguaruna, aents), Quichua - Quichua Runa, Kichwa, Shipibo
- Conibo – Shetebo, Achuar , Achual, Ashaninka, Cacataibo (Uni),
Urarina (Itukale, Shimaco, Kacha), Cocama – Cocamilla, Yine - Yami
("Piro"), Yagua (Yawa, Nihamwo), Wampis (Huambisa), Mayoruna
(Matse), Bora (Miamuna), Huitoto (Incluye Murui, Meneca, Munaine),
Shawi (Chayahuita, Kanpunan, Kampu Piyaw, Ticuna (Duuxugu),
Candoshi – Murato, Asheninka,Yanesha ("Amuesha"), Secoya (Aido
Peru Pai), Ese`Eja ("Huarayo"), Amarakaeri, Jebero (Shiwilu, Sewelo), Otros 11,182 69 4% 23%
Grupos Indigenas Amazonicos, Amahuaca, Capanahua (Junikuin),
Huaorani (Tagaeri, Taromenane),Ocaina (Ivo`Tsa),Orejon (Mai Huna,
Maijuna), Pisabo (Mayo, Kanibo),Resigaro, Shapra, Toyoeri, Arasaire,
Isconahua (Icobakebo),Yaminahua,Sharanahua / Marinahua (Onikoin),
Yora ("Nahua", "Parquenahua"), Cashinahua (Junikuin),
Nomatsiguenga, Machiguenga (Matsigenka), Culina (Madija),
Mastanahua, Sapiteri, Iquito, and Harakmbut
United States of Alaska, Alburqueque, Bemidji, Billings, California, Great Plains,
39,051 n/a 20% n/a
América*** Nashville, Navajo, Oklahoma City, Phoenix, Portland, and Tucson
Venezuela Pemón, Kurripaco, Yeral, Yanomami, and Warao 184 n/a 3% n/a
14 Pan American Health Organization / World Health Organization. Epidemiological Update: COVID-19
among indigenous peoples in the Americas. 5 August 2020, Washington, D.C.: PAHO/WHO; 2020. Available
at: https://bit.ly/3hiD3EL
15 For Table 1. References, please see last page.
- 15 -
Pan American Health Organization • http://www.paho.org • © PAHO/WHO, 2020Table Notes:
n/a: Data not available
ǂ Relative increase in comparison with the data published in the PAHO/WHO Epidemiological update on 5
August 2020.
*Brazil: Data corresponds to the 34 Special Districts of Indigenous Health (DSEI, per the Portuguese
acronym).
**Canada: Data corresponds to provinces.
***United States of America: Data corresponds to 12 areas of the Indian Health Service (IHS).
Sourceꓽ Data provided by the International Health Regulations National Focal Points or published by the
Ministries of Health, Institutes of Health, indigenous organizations or similar and reproduced by PAHO / WHO.
Guidance and recommendations for national authorities
PAHO/WHO continues to reiterate and update recommendations to support all Member
States on measures to manage and protect against the disease. The latest interim guidance,
Public health surveillance for COVID-19: interim guidance,16 published 7 August 2020,
supersedes two earlier versions: Global surveillance guidance for COVID-19 caused by
human infection with COVID-19 virus: Interim guidance and Surveillance strategies for COVID-
19 human infection: Interim Guidance 10 May 2020. Additional information and updates since
the last PAHO/WHO COVID-19 Epidemiological Update published on 23 June 2020, which
have been provided in Public health surveillance for COVID-19: interim guidance, are
described in following sections.
1. Surveillance
Surveillance Strategies
PAHO/WHO recommends that Public health surveillance for COVID-19 be followed in
conjunction with Critical preparedness, readiness and response actions for COVID-1917 and
Contact tracing in the context of COVID-19.18
To interrupt COVID-19 transmission the following activities should be conducted:
• Early detection of suspected cases,
• Laboratory testing,
• Isolation,
• Contract tracing and quarantine of contacts.
The latest guidance includes the revision of suspected and probable case definitions, as
follows, to broaden the clinical spectrum of COVID-19 signs and symptoms.
16 Public health surveillance for COVID-19: interim guidance. Available at: https://bit.ly/3aRXUfP
17 Critical preparedness, readiness and response actions for COVID-19. Available at: https://bit.ly/2EnJ2Kb
18 Contact tracing in the context of COVID-19. Available at: https://bit.ly/3hq6Vis
- 16 -
Pan American Health Organization • http://www.paho.org • © PAHO/WHO, 2020Suspected COVID-19 case
A. A person who meets the clinical AND epidemiological criteria:
Clinical criteria: 1. Acute onset of fever AND cough; or 2. Acute onset of any three or more of
the following signs or symptoms: fever, cough, general weakness/fatigue, headache,
myalgia, sore throat, coryza, dyspnoea, anorexia/nausea/vomiting, diarrhoea, altered
mental status.
AND
Epidemiological criteria: 1. Residing or working in an area with high risk of transmission of the
virus: for example, closed residential settings and humanitarian settings, such as camp and
camp-like settings for displaced persons, any time within the 14 days prior to symptom onset;
or 2. Residing in or travel to an area with community transmission2 anytime within the 14 days
prior to symptom onset; or 3. Working in health setting, including within health facilities and
within households, anytime within the 14 days prior to symptom onset.
B. A patient with severe acute respiratory illness (SARI: acute respiratory infection with history
of fever or measured fever of ≥ 38 C°; and cough; with onset within the last 10 days; and who
requires hospitalization).
Probable COVID-19 case
A. A patient who meets clinical criteria above AND is a contact of a probable or confirmed
case, or epidemiologically linked to a cluster of cases which has had at least one confirmed
case identified within that cluster.
B. A suspected case (described above) with chest imaging showing findings suggestive of
COVID-19 disease.
Typical chest imaging findings suggestive of COVID-19 include the following (Manna
2020):
• chest radiography: hazy opacities, often rounded in morphology, with
peripheral and lower lung distribution
• chest CT: multiple bilateral ground glass opacities, often rounded in
morphology, with peripheral and lower lung distribution
• lung ultrasound: thickened pleural lines, B lines (multifocal, discrete, or
confluent), consolidative patterns with or without air bronchograms.
C. A person with recent onset of anosmia (loss of smell) or ageusia (loss of taste) in the
absence of any other identified cause.
D. Death, not otherwise explained, in an adult with respiratory distress preceding death AND
who was a contact of a probable or confirmed case or epidemiologically linked to a cluster
which has had at least one confirmed case identified within that cluster.
Excess Mortality
- 17 -
Pan American Health Organization • http://www.paho.org • © PAHO/WHO, 2020Public health intervention strategies to reduce the consequences of the COVID-19 pandemic
on mortality are cause-specific and require the input of accurate mortality data. Obtaining
accurate cause-specific data to measure mortality due to COVID-19 is challenging, mainly
because:
• the diagnostic uncertainty could lead to a miscount of COVID-19 deaths;
• categorical attribution of a COVID-19 infection does not necessarily tell the complete
public health story, as the infection increases mortality risk from other conditions;
• the increased stress on or saturation of health care services during the pandemic may
lead to increased mortality from other conditions; and
• the challenge of diagnosing COVID-19 deaths outside of hospitals presents a
significant barrier to obtaining accurate cause-specific mortality data.
All-cause excess mortality analysis is a sound and recommended analytic approach for
assessing the impact of COVID-19, as it captures the net effect of all factors that may increase
or decrease mortality and is readily measurable from existing Civil Registration and Vital
Statistics (CRVS) systems.
A Case Example – Peru
Excess mortality analysis was applied to the case of Peru using official data from the
Repositorio Único de Información de Salud, Mininsterio de Salud, including registered deaths
from 2017 to 2020 and deaths due to COVID-19.19,20 Data quality assessment and data
correction for under-registration (2017-2020) were carried out, and estimates of the expected
deaths and expected death rates and corresponding threshold based on previous years
(2017-2019) were obtained. Median (50 percentile) and third quartile (75 percentile) were
calculated. Absolute number of deaths, age- and sex-specific death rates, and age-
standardized death rates, accounting for the population size and age distribution in the
population, were computed by week to estimate the excess of deaths.
Between EW 12 and EW 21 of 2020 in Peru, a total of 55,477 deaths and an excess of 21,260
deaths compared to the median of previous years (2017-2019) was estimated. Of these
excess deaths, 4,510 (21%) deaths were due to COVID-19. Excess mortality was increasing
almost exponentially week by week during this time frame. Findings suggest that:
• there exists a high level of excess deaths as a consequence of the COVID-19
pandemic;
• there is a high number of excess deaths due to non-COVID-19 or other causes (79%)
that are indirectly attributed to the COVID-19 pandemic; and
• the higher than expected level of excess mortality due to non-COVID-19 suggests a
possible under-reporting of death due to COVID-19.
19 Repositorio Único de Información de Salud, Ministerio de Salud. Available at: https://bit.ly/3gs1xKx
20 Fallecidos por COVID-19 - [Ministerio de Salud - MINSA]. Available at: https://bit.ly/3j1PDbL
- 18 -
Pan American Health Organization • http://www.paho.org • © PAHO/WHO, 2020Detailed information and results from the study are available online.21
Excess mortality monitoring supports the mitigation of the COVID-19 pandemic by providing:
1. insights about the effectiveness of public health and health care interventions;
2. information to support decision-making, and formulate strategic actions and policy
development;
3. comprehensive information about factors impacting mortality and population health,
including specific causes and most affected populations; and
4. a highly comparable excess mortality index, useful for comparisons across population
groups and countries.
21 Case Study: Excess Mortality in Peru. Available at: https://bit.ly/32thg7h
- 19 -
Pan American Health Organization • http://www.paho.org • © PAHO/WHO, 2020Recent COVID-19 Resources Technical Guidance
Surveillance
• Interim guidance for Considerations for implementing mass treatment, active case‐
finding and population-based surveys for neglected tropical diseases in the context
of the COVID-19 pandemic (published 27 July)
• WHO COVID-19 preparedness and response progress report - 1 February to 30 June
2020 (published 3 August)
• Scientific brief on Estimating mortality from COVID-19 (published 4 August)
• Scientific brief on the Status of environmental surveillance for SARS-CoV-2 virus
(published 5 August)
• Interim guidance on Public health surveillance for COVID-19 (published 7 August)
Laboratory
• COVAX, the act-accelerator vaccines pillar (published 6 August)
• COVID-19: Essential resource planning - Emergency Global Supply Chain System
(COVID-19) catalogue (published 22 August)
Infection prevention and control
• Interim guidance on Infection prevention and control during health care when
coronavirus disease (COVID-19) is suspected or confirmed (published 29 June)
• Health advisory on Preparedness for Cyclones, Tropical Storms, Tornadoes, Floods
and Earthquakes during the COVID-19 pandemic (published 29 June)
• Interim guidance for WHO Member States on Investing in and building longer-term
health emergency preparedness during the COVID-19 pandemic (published 6 July)
• Scientific brief on Transmission of SARS-CoV-2: implications for infection prevention
precautions (published 9 July)
• WHO mass gathering COVID-19 risk assessment tool – Generic events, Guidance for
authorities and event organizers planning mass gatherings during the current COVID-
19 pandemic (published 10 July)
• An interim checklist for local authorities of Practical actions in cities to strengthen
preparedness for the COVID-19 pandemic and beyond (published 17 July)
• Guidance for conducting a Country Intra-Action Review (published 23 July)
• Public health considerations while resuming international travel (published 30 July)
• Interim guidance on Considerations for quarantine of contacts of COVID-19
(published 19 August)
• Advice on the use of masks for children in the community in the context of COVID-19
(published 21 August)
- 20 -
Pan American Health Organization • http://www.paho.org • © PAHO/WHO, 2020Clinical Management
• Updated scientific brief on Smoking and COVID-19 (published 30 June)
• Updated Guidance on maintaining a safe and adequate blood supply during the
coronavirus disease 2019 (COVID-19) pandemic and on the collection of COVID-19
convalescent plasma (published 10 July)
• Updated Global COVID-19 Clinical Platform: Pregnancy Case Report Form (CRF)
(published 13 July)
• Interim guidance on Water, sanitation, hygiene, and waste management for SARS-
CoV-2, the virus that causes COVID-19 (published 24 July)
Health Systems and Services
• Policy brief on Preventing and managing COVID-19 across long-term care
services (published 24 July)
• Considerations for the provision of essential oral health services in the context of
COVID-19 (published 3 August)
• Interim guidance on Home care for patients with suspected or confirmed COVID-19
and management of their contacts (published 12 August)
- 21 -
Pan American Health Organization • http://www.paho.org • © PAHO/WHO, 2020References for Table 1.
1. Coordinator of the Indigenous Organizations of the Amazon Basin (COICA per the Spanish
acronym), as of 11 August 2020. Available in Spanish at: https://coica.org.ec/
2. Special Secretary for Indigenous Health / Ministry of Health of Brazil. Available at:
www.saudeindigena.saude.gov.br
3. Government of Canada. Coronavirus (COVID-19) and Indigenous communities. Available
at: https://bit.ly/3efm1VI
4. Colombia International Health Regulations (IHR) National Focal Point (NFP) report,
received by PAHO/WHO via email.
5. Report from the PWR in Guatemala, received by PAHO/WHO via email.
6. Ecuador International Health Regulations (IHR) National Focal Point (NFP) report, received
by PAHO/WHO via email.
7. Mexico International Health Regulations (IHR) National Focal Point (NFP) report, received
by PAHO/WHO via email.
8. TV indigenous organization of Panama. Available at: https://bit.ly/3aJrLHf
9. Peru International Health Regulations (IHR) National Focal Point (NFP) report, received by
PAHO/WHO via email.
10. United States of America. U.S. Department of Health and Human Services. Indian Health
Service. Coronavirus (COVID-19). Available at: https://www.ihs.gov/coronavirus/
- 22 -
Pan American Health Organization • http://www.paho.org • © PAHO/WHO, 2020You can also read