Impact of mass distribution of long-lasting insecticidal nets (LLINs) in Mozambique, 2011 to 2025: Retrospective and prospective modeling of child ...
←
→
Page content transcription
If your browser does not render page correctly, please read the page content below
Impact of mass distribution of long-lasting
insecticidal nets (LLINs) in Mozambique, 2011 to
2025: Retrospective and prospective modeling of
child mortality and lives saved
Erica A Wetzler
World Vision US
Jorge A.H. Arroz
World Vision Mozambique
Chulwoo Park
San Jose State University
Marta Chande ( marta_chande@wvi.org )
World Vision Mozambique
Figueiredo Mussambala
World Vision Mozambique
Baltazar Candrinho
National Malaria Control Program
Research
Keywords: Long-lasting insecticidal net (LLIN), Mozambique, Lives Saved Tool (LiST), NetCALC
Posted Date: December 16th, 2020
DOI: https://doi.org/10.21203/rs.3.rs-126233/v1
License: This work is licensed under a Creative Commons Attribution 4.0 International License.
Read Full License
Page 1/23Abstract
Background
Malaria was the leading cause of post-neonatal deaths in Mozambique in 2017. The use of long-lasting
insecticidal nets (LLINs) is recognized as one of the most effective ways to reduce malaria morbidity and
mortality, especially in children. In 2015, Mozambique committed to the expansion of LLIN coverage
nationwide, culminating in the first countrywide campaign in 2017, reaching 95% of registered
households. Between 2012 and 2019, more than 34 million LLINs were distributed. No previous analyses
have estimated changes in mortality attributable to the scale-up of LLINs, accounting for provincial
differences in mortality rates and coverage of health interventions.
Methods
From 2012 to 2020, the population-based model NetCALC was used to predict provincial household LLIN
coverage based upon the number of LLINs distributed annually. NetCALC also projected how many LLINs
are needed to maintain universal coverage in 10 provinces from 2021 to 2025. Based upon the annual
provincial coverage of LLINs, the Lives Saved Tool (LiST), a multi-cause mathematical model, estimated
under-5 lives saved, and reductions in under-5 mortality attributable to LLIN expansion in 10 provinces of
Mozambique between 2012 and 2020, and projected lives saved from 2021 to 2025 if universal coverage
of LLINs is sustained.
Results
Results from the LiST models estimate that 64,470 child deaths were averted between 2012 and 2019. If
currently planned quantities of LLINs are distributed in 2020, and universal coverage is maintained from
2021 to 2025, an additional 68,695 child deaths could be averted. From 2011 to 2020, the percent
reduction in all-cause child mortality was 19.2%, from 114.5 per 1,000 to 93.2 per 1000 in the LLIN
distribution model compared to 9.5% in the baseline model. If universal coverage continues through 2025,
this reduction will be sustained.
Conclusions
LiST and NetCALC used together are useful in estimating lives saved and mortality in countries such as
Mozambique where vital registration data to measure changes in mortality are not consistently available.
Universal coverage of LLINs can save a substantial number of child lives and reduce child mortality in
Mozambique but will require resource mobilization. Without continued investment, thousands of
avoidable child deaths will occur.
Page 2/23Background
Malaria burden in Mozambique: Mozambique has the fourth highest burden of malaria worldwide, with
an estimated 9 million cases in 2018 [1]. There were 10,132 deaths due to malaria in children under 5
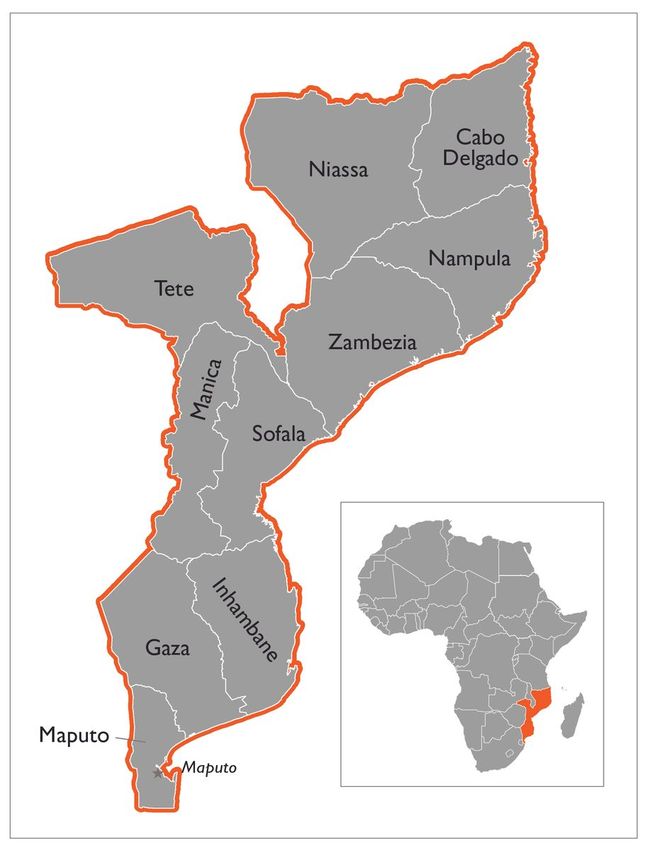
years in Mozambique in 2017, with malaria as the top cause of post-neonatal deaths [2]. The prevalence
of malaria has historically been higher in the northern provinces of the country, where there are more
humid climates and higher populations (Figure 1).
There is substantial evidence linking long lasting in long-lasting insecticidal nets (LLINs) with reduced
child mortality and morbidity. Universal coverage of LLINs is a core malaria prevention tool, and part of
the first pillar of World Health Organization’s (WHO) Global Technical Strategy for Malaria 2016–2030 [3-
5]. Globally, LLINs have become a core intervention of national control strategies with over 2.2 billion nets
distributed worldwide as of the second quarter of 2020 [6].
Mozambique’s National Strategic Plan for Malaria (2017–2022) focuses on reducing the burden in high
endemic areas while sustaining gains in low transmission areas to accelerate elimination. The plan
emphasizes strengthening case management, universal access to diagnosis and treatment,
strengthening malaria surveillance systems, and the continuation of universal coverage of LLINs as the
main vector control strategy, with the use of indoor residual spraying (IRS) as a mitigation method. The
National Malaria Control Program’s (NMCP) objectives relevant to LLIN distribution are to ensure that: 1)
at least 90% of registered households have sufficient LLINs (at least one for every two people), and 2) at
least 80% of LLIN owners sleep under their LLINs. The NMCP’s goal is to distribute one LLIN for every 1.8
people in the household every 3 years.
In Mozambique, the NMCP rolled out a national insecticide-treated nets (ITN) household ownership
strategy in 2011, aiming to achieve universal coverage of LLINs throughout the country. Subsequently,
through funding from the U.S. government’s President’s Malaria Initiative, and later from the Global Fund
for Malaria Tuberculosis and AIDS, the NMCP worked with partners to organize mass distributions in all
provinces. Between 2011 and 2019, 36,862,845 LLINs were distributed nationwide, starting in six
provinces, culminating in the first countrywide campaign that delivered over 16 million LLINs to 95% of
registered households in 2017 [7]. The 2020 campaign plans to deliver over 12 million LLINs to seven
provinces but has been delayed by the COVID-19 pandemic.
Vital registration data to measure changes in mortality are not available in Mozambique and in most sub-
Saharan Africa countries. Birth histories from national surveys are useful in measuring trends in all-cause
child mortality, but they do not typically assess cause of death. There have been no provincial level
mortality estimates in Mozambique since 2011. The Lives Saved Tool (LiST), developed by Johns
Hopkins University, is a modeling application available through the Spectrum software package that
estimates child mortality and “lives saved” for children under 5 years of age retrospectively and
prospectively using the age structure of the population, fertility rates, under-5 mortality rates, cause of
death structure, and changing coverage estimates of key child survival and maternal interventions [8].
Page 3/23The LiST child health intervention indicator related to LLINs is household ownership of an ITN and/or
protected by Indoor Residual Spraying (IRS).
In Mozambique, previous LiST analyses have modeled the direct effect of the scale-up of malaria
interventions (IRS, ITN household ownership, ITN use by pregnant women and IPTp during pregnancy) on
reducing malaria-specific mortality from 2007 to 2011, and between 1997 and 2011 [9, 10]. These
analyses linearly interpolated coverage between survey years to estimate ITN coverage while also
increasing coverage of other maternal and child health interventions.
Junior et al. used historical coverage data and mathematical modeling to project future coverage levels
for 22 interventions for 2015 to 2030, and then used LiST to estimate additional lives saved and changes
in the child mortality rate over time [11]. However, the estimates did not take into account the actual
number of LLINs distributed. Even so, the two interventions projected to save the most under-5 lives
between 2015 and 2030 are increased coverage of artemisinin-based combination therapies (ACTs) and
ITN ownership, contributing to an estimated 40.9% of the total lives saved if historical trends continue.
NetCALC is a tool that estimates how many bed nets are needed to reach a specified target for LLIN or
ITN household coverage, or conversely, estimates ITN or LLIN coverage based on distribution of nets each
year. The principal design of the NetCALC tool is a simple, compartmental model, and requires core
population information, including: 1) the starting year, 2) the target population size during that year, 3) the
average household size of the population, and 4) the average population growth rate [12-14]. The tool
includes parameters on timing and size of actual net distributions, population and household size
population growth, intra-household net accumulation, and net decay to project LLIN coverage at a given
point in time based on the number of nets available for use for the specified target population. The tool
has been used in previously published work [15-18].
In 2013, Paintain et al. used NetCALC and LiST together to estimate that the LLINs distributed between
2010 and 2012 in 40 countries in sub-Saharan Africa prevented about 350,000 malaria-attributable under-
5 deaths compared to the baseline in 2009.
No previous analyses have estimated changes in mortality attributable to the distribution and scale-up of
LLINs in Mozambique, accounting for heterogenous mortality rates, differences in disease patterns, and
coverage of maternal and child health interventions between provinces. Most reporting and analysis on
LLIN distribution has focused on outputs, such as the number of ITNs distributed by province or district.
However, data on outcomes including mortality and lives saved can help stakeholders advocate for
continued investment in LLINs as a cornerstone for driving and maintaining reductions in under-5 child
mortality in Mozambique.
Further, the Mozambique NMCP usually calculates the number of LLINs needed annually, comparing the
current method of calculating LLIN needs with provincial level evidence-based projections from NetCALC
can help planners and policy makers to anticipate investments needed in LLINs, in order to more
efficiently and effectively distribute them where most needed.
Page 4/23Methods
This study seeks to estimate deaths averted in children under-5 due to LLIN distributions in 10 provinces
of Mozambique between 2012 and 2020 and to project the number of lives that can be saved in children
under 5 from 2021 to 2025 if universal coverage is maintained. The study population is the population of
Mozambique, excluding the city of Maputo, estimated at about 22 million people in 2011 [19]. Maputo
City was excluded because LLIN distribution is not the primary malaria prevention effort there and no
LLIN has been distributed since 2017.
Additional outcomes are percent reductions in under-5 mortality nationally and by province for the same
time periods, and estimated number of LLINs needed by province from 2021 to 2025 to maintain
universal coverage.
Predicting LLIN coverage using NetCALC
Data from the 2011 Demographic and Health Survey (DHS) were used for baseline bed net coverage in
each province [20]. The provincial baseline population in NetCALC (version 3.2) was the total population
for that province in 2011, according to 2007 Mozambique census projections. For the core population
information required by NetCALC, household size was set using the 2011 DHS. The average population
growth rate was fixed at 2.86% for all provinces [21]. Median LLIN survival time was set to three years, in
line with NMCP guidance for the LLIN brands used in Mozambique.
To estimate trends in ITN and LLIN ownership coverage between 2012 and 2020, we entered the number
of LLINs distributed during that time, and NetCALC estimated coverage for each year. To create a
counterfactual to estimate the trend in ownership coverage had no LLINs been distributed, 2011 baseline
coverage from the DHS was used as a starting point, NetCALC modeled the rate at which coverage would
decline if no LLINs were distributed after 2011. Annual net replacement needs from 2021 to 2025 were
modeled using the ‘sustain uc’ function in NetCALC, assuming 100% as the target to be sustained.
Predicting deaths averted and percent reduction in all-cause under-5 mortality
The LiST model (Version 5.761) and accompanying documentation used in this analysis [22]. LiST
models were created for each of the 10 provinces in Mozambique using Spectrum’s Sub-National Wizard,
and then summed to estimate the total lives saved as a result of LLIN distribution. Separate models for
each province were needed because provinces have different cause of death structures and varying
coverage levels of the MCHN interventions that LiST uses to make projections. Using countrywide
estimates would have diluted the effect of these regional variations and the corresponding accuracy of
mortality and lives saved estimates. LiST requires a parameter on the “first-year” population, in this case
2011. We estimated the first-year population for each province using census projections for 2011, the
same population values entered in NetCALC [20]. With the exception of Inhambane and Nampula
provinces, provincial neonatal, infant, and under-5 mortality rates were based on the 2011 DHS. Under-5
Page 5/23mortality rates for Nampula and Inhambane provinces from the DHS were less than half of neighboring
provinces, so for these two provinces LiST estimates were deemed more realistic.
The intervention coverage indicator of interest in LiST is “ITN/IRS — household ownership of insecticide
treated bed net (ITN) and/or protected by indoor residual spraying (IRS)” [23]. This is the indicator for
which coverage estimates were changed in LiST based upon NetCALC projections. Coverage levels for all
other LiST interventions remained constant. For each province, we created three sets of models in LiST.
The first was the baseline or counterfactual, which assumed no distribution of LLINs after 2011, and
therefore a decline in ownership coverage. The second set of models used coverage estimates from
NetCALC based upon actual LLINs distributed through 2020 (and no LLINs after 2020). The third set of
models assumed universal coverage is maintained through 2025. For each model, LiST estimated lives
saved for children under 5.
For each province, all-cause under-5 mortality rates were projected in the baseline model (no LLIN
distribution) and in the LLIN distribution model. For each province and nationally, we estimated the
percent reduction in under-5 mortality between 2011 and 2020 and percent reduction in under-5 mortality
if universal coverage is sustained between 2021 and 2025 in the baseline and LLIN distribution models.
Results
Number of nets distributed by province
Between 2012 and 2019, 34,513,379 LLINs were distributed in 10 provinces of Mozambique. During the
initial years of distribution, LLINs were distributed in selected districts in each province. Nearly half of the
LLINs (16,558,818) were distributed during 2017. The program planned to distribute 12,014,149 LLINs in
2020. Distribution has been delayed due to the COVID-19 pandemic, but door-to-door distribution is now
planned in seven provinces during the latter part of the year.
Predictions in LLIN coverage (median and IQRs) by
province
In 2017, estimated LLIN coverage reached 100% in all 10 provinces, coinciding with the mass
countrywide LLIN distribution that year (Table 1). Universal coverage was sustained through 2019 in all
provinces except Zambezia, Sofala, Inhambane, Gaza, and Maputo. If LLINs are distributed as planned in
2020, all provinces except Maputo will be at 100% coverage. For the period from 2011 to 2019, median
coverage for each province was lowest in Gaza and Maputo province at 69.56% (IQR: 46.06%, 83.22%)
and 69.12% (IQR: 37.66%, 83.88%) respectively. These provinces have a lower burden of malaria. Median
coverage was highest in Nampula and Manica provinces at 83.70% (IQR: 60.56%, 100%) and 83.14%
(IQR: 53.96%, 100%) respectively.
Page 6/23Lives saved in children 0–59 months by province, 2012 to
2020
In total, LiST estimated that 64,470 lives of children under 5 were saved due to ownership of LLINs
between 2012 and 2019. If nets are distributed as planned in 2020, an additional 12,721 deaths will be
averted this year. The estimated number of under-5 lives saved nationwide increased every year starting
from 1,608 in 2012 to 8,981 in 2015, even as modest numbers of LLINs were distributed throughout the
country. There were no LLINs distributed in 2016 and 2018. However, after the mass distribution in 2017,
the estimated number of lives saved increased to 12,211 per year and is projected to remain stable at
about 12,000 per year until 2021 (Fig. 2).
Figure 2. Total LLINs distributed and estimated lives saved of children under-5 in Mozambique from
2012–2020
Key for Fig. 2. Between 2012 and 2020, the number of estimated under-5 lives saved increased as the
number of LLINs distributed increased, with a total of 64,470 lives saved between 2012 and 2019, and an
additional 12,721 projected for 2020 if the planned number of LLINs are distributed in the country. The
countrywide mass distribution of LLINs in 2017 helped to elevate household coverage to 100% in all
provinces in both 2017 and 2018, which in turn, resulted in a over 12,000 under-5 lives saved starting in
2017 and continuing in subsequent years.
If no nets are distributed in 2021, 10,769 child deaths will still be averted. Between 2020 and 2025, a total
of 20,322,378 LLINs are needed to achieve and maintain universal coverage, with 697,868 nets projected
in 2021 and 5,309,734 in 2025 (Additional Table 1 and Fig. 3). NetCALC projects that 81,942 LLINs are
Page 7/23needed in Maputo province in 2020, but no LLINs are scheduled for distribution there. If universal
coverage is maintained between 2021 and 2025, then an estimated 68,695 under-5 deaths will be
prevented (Fig. 3).
Figure 3. Total LLINs needed to maintain 100% coverage and projected under-5 lives saved, Mozambique,
2021–2025
Key for Fig. 3. To maintain universal household coverage at 100%, 697,868 LLINs are needed for
distribution in 2021, peaking at 5,596,708 in 2023 and decreasing slightly until 2025. During the same
time period, the estimated under-5 lives saved increased in a linear manner starting at 13,160 in 2021 and
reaching 14,333 by 2025.
At the provincial level, most lives saved were in the more populous provinces of Nampula and Zambezia,
which also correspond to the provinces with a higher malaria burden. From 2012 to 2019, we estimated
that 15,438 under-5 deaths were averted in Zambezia province alone, or about 23.95%.
Estimated percent reductions in under-5 mortality by
province
Overall, after scale-up of LLINs through mass distribution, estimated all-cause under-5 mortality
decreased from 114.51 per 1000 in 2011 to 93.24 per 1,000, a 18.58% reduction. This compares to a
7.84% reduction over the same period in the baseline model where no LLINs were distributed (Fig. 4). If
universal coverage is sustained through 2025, under-5 mortality is projected to be 92.48 per 1000. LiST
also projected changes in under-5 mortality by province attributable to the distribution of LLINs.
Figure 4. Estimated under-5 mortality rates (per 1,000) with and without LLIN distribution, and universal
coverage after 2020
Key to Fig. 4. Estimated reductions in all-cause under-5 mortality assuming no LLIN distribution and
assuming actual distribution of LLINs from 2011 to 2020 and sustaining universal coverage of LLINs
from 2021 to 2025. In 2011, the under-5 mortality rate was estimated at 114.51 per 1,000 live births in
both models. However, by 2020, the estimated under-5 mortality rate had dropped to 105.53 per 1,000 in
the baseline model (no LLINs), and to 93.24 per 1,000 in the LLIN distribution model. If universal coverage
is sustained until 2025, the mortality rate drops marginally to 91.95 per 1,000 by 2025. If no LLINs are
distributed, the mortality rate decreases from 105.53 per 1,000 in 2020 to a projected 104.45 per 1,000 in
2025.
Comparing baseline projections to those including actual mass scale-up of LLINs from 2011 to 2020,
reductions in under-5 mortality were lowest in Maputo province (from 96.06 per 1000 to 80.86 per 1000),
a 12.55% reduction, and greatest in Manica province (113.99 per 1000 to 91.49 per 1000), where it was
20.55% lower than 2011 (Additional Table 2). Under-5 mortality was also projected between 2021 and
2025 if universal coverage is sustained, dropping slightly from 93.23 per 1000 in 2020 to 92.48 per 1000
in 2025. In the baseline model, under-5 mortality is estimated at 105.53 per 1000 in 2020, dropping to
Page 8/23103.65 per 1000 in 2025. These mortality rate estimates do not reflect coverage changes in any other
maternal and child health interventions, so actual rates in 2020 and 2025 would likely be lower.
Discussion
The scale up of LLINs in Mozambique saved an additional 64,470 lives from 2012 to 2019, with an
estimated 12,721 more in 2020 if planned distributions are completed. Expanded coverage of LLINs has
contributed to reductions in all-cause child mortality, supported by under-5 mortality rate projections that
estimate a net reduction of about 10 per 1,000 deaths in each province between 2011 and 2020. To
sustain universal coverage, an estimated 20,420,436 LLINs are needed in Mozambique between 2021
and 2025. The NMCP has not yet made projections for the LLINs needed in 2021 through 2025, so these
projections can provide useful comparison points when projections are made and can assist with
budgeting and projections as Mozambique applies for funding for LLINs from the Global Fund in 2021.
If universal coverage is maintained through 2025, progress toward preventing deaths will continue with
over 66,000 lives saved. However, the COVID-19 pandemic and uncertainty regarding continued
investment in LLINs threaten sustained coverage, especially those in the north and central provinces of
the country.
Our results show greater number of lives saved due to LLIN distribution than other studies that used the
LiST model to estimate lives saved attributable to LLIN ownership in Mozambique. This is for a couple of
reasons: Because of the objective to determine the role of LLINs in preventing death and reducing
mortality, coverage levels for other interventions remained static. Secondly, coverage levels of LLIN
ownership steadily increased starting in 2012, while previous studies focused on time periods when LLIN
coverage had not yet been expanded through mass campaigns. Finally, to align with our research
question, the baseline model did not keep LLIN coverage constant, but modeled how coverage would
decrease over time had no LLINs been distributed after 2011.
This research adds to the body of evidence showing the relative importance of LLINs to prevent under-5
deaths in Mozambique. Though other studies have used slightly different approaches and did not
measure the effects of LLINs only, their findings also demonstrate the importance of LLINs in preventing
deaths of children in Mozambique. The President’s Malaria Initiative conducted an analysis estimating
deaths prevented due to the scale-up of malaria control interventions from 2007 to 2011 and estimated
that 13,198 (range: 9,231 to 17,231) deaths were prevented in children ages 1 to 59 months, due to the
scale-up of ITN and IRS [9]. In an analysis of 11 interventions, Macicame et al. estimated that 55,757
under-5 child lives were saved between 1997 and 2011 (15 years) through ITN and IRS. Compared to LLIN
ownership, wasting prevalence was the only intervention that saved more lives [10].
Junior et al. used historical coverage data and mathematical modeling to project future coverage for 22
child and maternal health interventions from 2015 to 2030, estimating 29,302 child lives saved
nationwide for the same period, second only to treatment with ACTs [11]. This was lower than projections
from our models because estimated LLIN coverage was lower than actual and other interventions were
Page 9/23not held constant. In 2019, Pothin and Winkel modeled the impact of various vector control and drug-
based interventions and the prevalence at the district level throughout the country, including the
distribution of piperonyl butoxide treated nets in 2020 and every three years through 2030 at 80%
coverage [24]. On their own, ITNs were the most impactful intervention at reducing prevalence compared
to IRS, case management, mass drug administration, seasonal malaria chemotherapy, and larval source
management.
The LiST and NetCALC tools used together are useful to estimate lives saved and mortality in countries
such as Mozambique where vital registration data to measure changes in mortality are not consistently
available. Both NetCALC and LiST models have been validated by their authors against observed field
data [25–27]. A strength of LiST is that it incorporates a comprehensive approach to mortality modeling,
calculating the increases in LLINs in this case against the backdrop of other intervention coverage
remaining static, while using evidence-based effectiveness values for each of the interventions it
incorporates.
However, this study had a few limitations. NetCALC is designed to predict the number of LLINs needed
annually to maintain a defined coverage level, based on population size, existing coverage from previous
LLIN or ITN distributions and median LLIN lifespan. When NetCALC calculates replacement need, it
assumes LLINs will reach those not covered in an equitable manner and does not consider how they will
be distributed. If there are additional nets planned for distribution beyond the replacement need, NetCALC
considers these “excess.” However, when the NMCP plans for distributions, it considers both mass
campaign mechanisms and continuous distribution channels, which results in double distribution for
some recipients and therefore a greater projected need for LLINs than the replacement need modeled in
NetCALC.
In addition, coverage by IRS was not included in this analysis. In 2019, the IRS program covered five
provinces, including an estimated 780,597 people in Maputo Province, where LLIN coverage was lower
than other provinces, which contributed to further reductions in mortality not included in this analysis.
The remaining provinces covered by IRS were also covered by LLINs. Furthermore, other malaria
interventions such as case management with ACTs and chemoprophylaxis for pregnant women were
considered static for this analysis. This analysis focused only on children under 5 years of age,
underestimating the full impact of LLIN distribution on the population of Mozambique, and not including
deaths where malaria may have been a secondary cause.
Conclusions
Multiple analyses have shown that continued investment in interventions to prevent childhood malaria,
especially LLINs, can result in substantial reductions in child mortality and an increase in saved lives. The
total estimated cost per LLIN in Mozambique was $1.22 (including procurement, logistics, training,
transport) in 2017, a relatively small investment given the number of lives that can be saved [7].
Sustaining universal coverage of LLINs may be more feasible than scaling and maintaining coverage of
Page 10/23other key child health interventions such as malaria treatment with ACTs and oral rehydration solution for
diarrhea. In an analysis of 69 countries, Walker et al. predicted that by 2035, the coverage of four
interventions all related to malaria prevention, including household ownership of insecticide treated nets,
will increase rapidly, while another 24 interventions will not see substantial scale-up by 2035, bolstering
the case for continued investment in mass distribution of LLINs [8].
Gaps in coverage of maternal and child health interventions need to be viewed through an equity lens,
which acknowledges the need for a multi-intervention approach, while strategically focusing on those
interventions known to be effective at reducing mortality, and whose distribution and delivery
mechanisms facilitate or promote equity (lower cost, less time for distribution and training). Mass LLINs
campaigns are last-mile solutions to help close the equity gap. In Mozambique, LLINs only need to be
delivered every three years, reaching the most remote areas, which are often the most vulnerable. In
contrast to other maternal and child health interventions, LLINs benefit the entire household. Logistical
burdens surrounding transport and handling are also less complex, depending on fewer intermediaries.
Mass distributions are one-off events rather than continuous, reducing the number of trips needed for
delivery. Over time, this makes mass distribution events less vulnerable to the effects of external events
such emergencies and political instability that undermine sustaining or increasing coverage of other
maternal and child health interventions. However, there are challenges associated with distribution,
access, and use of LLINs at the household level that should be considered during allocation of scarce
financial resources for child health. This analysis shows that child deaths are concentrated in provinces
in the north and central regions. If funding gaps continue, targeted selection of high burden, more
populous provinces and districts should be prioritized.
In 2019, an estimated 81,507 children under-5 died in Mozambique [28]. Maintaining universal coverage
of LLINs is clearly a strategic opportunity for maximizing the number of child lives saved; however,
sustaining universal coverage of LLINs will require substantial resource mobilization. Without continued
investment in sustaining coverage, thousands of avoidable child deaths will occur.
Abbreviations
ACTs: Artemisinin-based combination therapies, DHS:Demographic and Health Survey, IRS:Indoor
residual spraying, ITN:Insecticide-treated net, LiST:Lives Saved Tool, LLIN:Long-lasting insecticidal net,
NMCP:National Malaria Control Program
Declarations
Ethics approval and consent to participate
Not applicable. Human participants were not involved in the study. This research uses secondary data
and is not subject to ethics approval.
Consent for publication
Page 11/23Not applicable.
Availability of data and materials
The datasets used and/or analyzed during the current study are available from the corresponding author
on reasonable request.
Competing interests
The authors declare that they have no competing interests
Funding
The LLIN mass distribution campaigns in Mozambique were supported through a financial contribution
from the Global Fund to Fight AIDS, Tuberculosis, and Malaria.
Authors’ contributions
EAW led the study design, conducted the modeling and analysis, drafted the manuscript. JAHA
contributed to the study design and drafted the manuscript. CP advised on the modeling and analysis
and contributed to the manuscript. MC and FM provided baseline or initial data and contributed to the
manuscript. BC reviewed and contributed to the manuscript.
Acknowledgements
Doctor Jorge A.H. Arroz, who was instrumental in designing this study, passed away while the manuscript
and final analysis were underway. Dr. Arroz dedicated his life and career to improving the health of the
people of Mozambique. The authors would also like to acknowledge the contributions of communities in
Mozambique who help make the distribution of LLINs possible throughout the country, and the
contributions and dedication of the district and provincial health authorities, and the National Malaria
Control Program. The Director of the National Malaria Control program reviewed the manuscript prior to
submission.
Author’s information
This information is on the title page.
References
1. World Health Organization: World malaria report 2019.
https://www.who.int/publications/i/item/world-malaria-report-2019 (2019). Accessed 20 November
2020.
2. World Health Organization. MCEE-WHO methods and data sources for child causes of death 2000-
2017. Geneva: WHO. 2018.
Page 12/233. Lengeler C. Insecticide‐treated bed nets and curtains for preventing malaria. Cochrane database of
systematic reviews. 2004(2).
4. Pryce J, Richardson M, Lengeler C. Insecticide‐treated nets for preventing malaria. Cochrane
Database of Systematic Reviews. 2018(11).
5. World Health Organization. Global technical strategy for malaria 2016-2030. World Health
Organization; 2015. Report No.: 9241564997.
6. The Alliance for Malaria Prevention: Net Mapping Project.
https://netmappingproject.allianceformalariaprevention.com/ (2020). Accessed 23 October 2020.
7. Arroz JA, Candrinho B, Pedro S, Mathe G, da Silva M, Tsabete S, et al. Planning and implementation
of a countrywide campaign to deliver over 16 million long-lasting insecticidal nets in Mozambique.
Malaria Journal. 2018;17(1):254.
8. Walker N, Tam Y, Friberg IK. Overview of the lives saved tool (LiST). Springer; 2013.
9. USAID. Evaluation of the Impact of Malaria Control Interventions on All-Cause Mortality in Children
under Five Years of Age in Mozambique 2016.
10. Macicame I, Magaço A, Cassocera M, Amado C, Feriano A, Chicumbe S, et al. Intervention heroes of
Mozambique from 1997 to 2015: estimates of maternal and child lives saved using the Lives Saved
Tool. Journal of Global Health. 2018;8(2).
11. Júnior JM, Cane RM, Gonçalves MP, Sambo J, Konikoff J, Fernandes Q, et al. Projecting the lives
saved by continuing the historical scale-up of child and maternal health interventions in
Mozambique until 2030. Journal of global health. 2019;9(1).
12. Kilian A, Boulay M, Koenker H, Lynch M. How many mosquito nets are needed to achieve universal
coverage? Recommendations for the quantification and allocation of long-lasting insecticidal nets
for mass campaigns. Malaria Journal. 2010;9(1):330.
13. Briët OJ, Hardy D, Smith TA. Importance of factors determining the effective lifetime of a mass, long-
lasting, insecticidal net distribution: a sensitivity analysis. Malaria Journal. 2012;11(1):20.
14. Kilian A, Byamukama W, Pigeon O, Atieli F, Duchon S, Phan C. Long-term field performance of a
polyester-based long-lasting insecticidal mosquito net in rural Uganda. Malaria Journal.
2008;7(1):49.
15. Paintain LS, Kolaczinski J, Renshaw M, Filler S, Kilian A, Webster J, et al. Sustaining fragile gains: the
need to maintain coverage with long-lasting insecticidal nets for malaria control and likely
implications of not doing so. PloS one. 2013;8(12):e83816.
16. Koenker HM, Yukich JO, Mkindi A, Mandike R, Brown N, Kilian A, et al. Analysing and recommending
options for maintaining universal coverage with long-lasting insecticidal nets: the case of Tanzania
in 2011. Malaria Journal. 2013;12(1):1-16.
17. Ahogni IB, Salako AS, Akinro B, Sovi A, Gnanguenon V, Azondekon R, et al. Physical integrity and
survivorship of long-lasting insecticidal nets distributed to households of the same socio-cultural
community in Benin, West Africa. Malaria Journal. 2020;19(1):58.
Page 13/2318. Yukich J, Bennett A, Keating J, Yukich RK, Lynch M, Eisele TP, et al. Planning long lasting insecticide
treated net campaigns: should households’ existing nets be taken into account? Parasites & vectors.
2013;6(1):174.
19. Instituto Nacional de Estatística: Recenseamento Geral da População e Habitação [General Census
of Population and Housing]. Accessed 1 January 2019.
20. Ministerio da Saude - MISAU/Moçambique, Instituto Nacional de EstatÌstica - INE/Moçambique, ICF
International. Moçambique Inquérito Demográfico e de Saúde 2011. Calverton, Maryland, USA:
MISA/Moçambique, INE/Moçambique and ICF International; 2013.
21. United Nations: World Population Prospects.
https://population.un.org/wpp/Download/Standard/Population/ (2020). Accessed 12 January 2020.
22. Johns Hopkins Bloomberg School of Public Health: The Lives Saved Tool.
https://www.livessavedtool.org/listspectrum (2020). Accessed 20 November 2020.
23. Avenir Health, Johns Hopkins Bloomberg School of Public Health, Programs IfI. The Lives Saved
Tool: Spectrum Manual.
24. Winkel M dCE, Chico AR, Colborn J, Didier B, Lucero D, Guidon M, Roca-Feltrer A, Zulliger R,
Candrinho, B, Pothin E, editor Supporting strategic planning with malaria modelling in Mozambique.
American Society of Tropical Medicine and Hygiene Annual Meeting; 2020.
25. Friberg IK, Bhutta ZA, Darmstadt GL, Bang A, Cousens S, Baqui AH, et al. Comparing modelled
predictions of neonatal mortality impacts using LiST with observed results of community-based
intervention trials in South Asia. International journal of epidemiology. 2010;39(suppl_1):i11-i20.
26. Hazel E, Gilroy K, Friberg I, Black RE, Bryce J, Jones G. Comparing modelled to measured mortality
reductions: applying the Lives Saved Tool to evaluation data from the Accelerated Child Survival
Programme in West Africa. International journal of epidemiology. 2010;39(suppl_1):i32-i9.
27. Larsen DA, Friberg IK, Eisele TP. Comparison of Lives Saved Tool model child mortality estimates
against measured data from vector control studies in sub-Saharan Africa. BMC Public Health.
2011;11(S3):S34.
28. UNICEF: Child Mortality. https://data.unicef.org/topic/child-survival/under-five-mortality/ (2020).
Accessed 12 October 2020.
Figures
Page 14/23Figure 1
Provincial map of Mozambique. Note: The designations employed and the presentation of the material
on this map do not imply the expression of any opinion whatsoever on the part of Research Square
concerning the legal status of any country, territory, city or area or of its authorities, or concerning the
delimitation of its frontiers or boundaries. This map has been provided by the authors.
Page 15/23Figure 1
Provincial map of Mozambique. Note: The designations employed and the presentation of the material
on this map do not imply the expression of any opinion whatsoever on the part of Research Square
concerning the legal status of any country, territory, city or area or of its authorities, or concerning the
delimitation of its frontiers or boundaries. This map has been provided by the authors.
Page 16/23Figure 2
Total LLINs distributed and estimated lives saved of children under-5 in Mozambique from 2012–2020
Key for Figure 2. Between 2012 and 2020, the number of estimated under-5 lives saved increased as the
number of LLINs distributed increased, with a total of 64,470 lives saved between 2012 and 2019, and an
additional 12,721 projected for 2020 if the planned number of LLINs are distributed in the country. The
countrywide mass distribution of LLINs in 2017 helped to elevate household coverage to 100% in all
provinces in both 2017 and 2018, which in turn, resulted in a over 12,000 under-5 lives saved starting in
2017 and continuing in subsequent years.
Page 17/23Figure 2
Total LLINs distributed and estimated lives saved of children under-5 in Mozambique from 2012–2020
Key for Figure 2. Between 2012 and 2020, the number of estimated under-5 lives saved increased as the
number of LLINs distributed increased, with a total of 64,470 lives saved between 2012 and 2019, and an
additional 12,721 projected for 2020 if the planned number of LLINs are distributed in the country. The
countrywide mass distribution of LLINs in 2017 helped to elevate household coverage to 100% in all
provinces in both 2017 and 2018, which in turn, resulted in a over 12,000 under-5 lives saved starting in
2017 and continuing in subsequent years.
Page 18/23Figure 3
Total LLINs needed to maintain 100% coverage and projected under-5 lives saved, Mozambique, 2021–
2025 Key for Figure 3. To maintain universal household coverage at 100%, 697,868 LLINs are needed for
distribution in 2021, peaking at 5,596,708 in 2023 and decreasing slightly until 2025. During the same
time period, the estimated under-5 lives saved increased in a linear manner starting at 13,160 in 2021 and
reaching 14,333 by 2025.
Page 19/23Figure 3
Total LLINs needed to maintain 100% coverage and projected under-5 lives saved, Mozambique, 2021–
2025 Key for Figure 3. To maintain universal household coverage at 100%, 697,868 LLINs are needed for
distribution in 2021, peaking at 5,596,708 in 2023 and decreasing slightly until 2025. During the same
time period, the estimated under-5 lives saved increased in a linear manner starting at 13,160 in 2021 and
reaching 14,333 by 2025.
Page 20/23Figure 4
Estimated under-5 mortality rates (per 1,000) with and without LLIN distribution, and universal coverage
after 2020 Key to Figure 4. Estimated reductions in all-cause under-5 mortality assuming no LLIN
distribution and assuming actual distribution of LLINs from 2011 to 2020 and sustaining universal
coverage of LLINs from 2021 to 2025. In 2011, the under-5 mortality rate was estimated at 114.51 per
1,000 live births in both models. However, by 2020, the estimated under-5 mortality rate had dropped to
105.53 per 1,000 in the baseline model (no LLINs), and to 93.24 per 1,000 in the LLIN distribution model.
If universal coverage is sustained until 2025, the mortality rate drops marginally to 91.95 per 1,000 by
2025. If no LLINs are distributed, the mortality rate decreases from 105.53 per 1,000 in 2020 to a
projected 104.45 per 1,000 in 2025.
Page 21/23Figure 4
Estimated under-5 mortality rates (per 1,000) with and without LLIN distribution, and universal coverage
after 2020 Key to Figure 4. Estimated reductions in all-cause under-5 mortality assuming no LLIN
distribution and assuming actual distribution of LLINs from 2011 to 2020 and sustaining universal
coverage of LLINs from 2021 to 2025. In 2011, the under-5 mortality rate was estimated at 114.51 per
1,000 live births in both models. However, by 2020, the estimated under-5 mortality rate had dropped to
105.53 per 1,000 in the baseline model (no LLINs), and to 93.24 per 1,000 in the LLIN distribution model.
If universal coverage is sustained until 2025, the mortality rate drops marginally to 91.95 per 1,000 by
2025. If no LLINs are distributed, the mortality rate decreases from 105.53 per 1,000 in 2020 to a
projected 104.45 per 1,000 in 2025.
Supplementary Files
This is a list of supplementary files associated with this preprint. Click to download.
AdditionalFile1.xlsx
AdditionalFile1.xlsx
AdditionalFile2.xlsx
Page 22/23AdditionalFile2.xlsx
Page 23/23You can also read