Results Presentation 2018 - Coventry Building Society
←
→
Page content transcription
If your browser does not render page correctly, please read the page content below

2018
Results Presentation

Disclaimer
This presentation document is being made available on a confidential basis and the recipient acknowledges and agrees that it will not be
reproduced or passed on to a third party.

• In accessing the presentation materials, you agree to be bound by the following terms and conditions, including any variation to them anytime
  you receive any information from us as a result of such access.
• This presentation is the property of Coventry Building Society (the “Society”). The presentation is provided strictly for information only.
• This presentation does not constitute a prospectus or other offering document for the purposes of the Directive 2003/71/EC (as amended) and/or
  Part VI of the Financial Services and Markets Act 2000 (the "FSMA"). Information contained in this presentation is a summary only. Nothing in
  this presentation shall constitute an offer to sell or the solicitation of an offer to buy securities. Recipients of these presentation materials who
  intend to subscribe for or purchase any securities are reminded that any subscription or purchase may only be made on the basis of the
  information contained in any final prospectus or other offering document.
• This communication is made only to persons in the United Kingdom who (i) are "investment professionals" within Article 19(5) of the Financial
  Services and Markets Act 2000 (Financial Promotion) Order 2005 or (ii) are high net worth entities falling within Article 49(2)(a) to (d) of the
  Financial Services and Markets Act (Financial Promotion) Order 2005 or certified high net worth individuals within Article 48 of the Financial
  Services and Markets Act (Financial Promotion) Order 2005. This communication is not intended for retail investors.
• The information in this presentation is not intended to be relied on as advice for making investment decisions.
• The statements of fact in this presentation have been obtained from and are based on sources the Society believes to be reliable. The Society
  does not guarantee their accuracy, and any such information may be incomplete or condensed. All opinions and estimates constitute the
  Society’s judgement, as of the date of this presentation and are subject to change without notice. The presentation has not been independently
  verified.
• No representations or warranties, express or implied, are given in, or in respect of, this presentation. To the fullest extent permitted by law and in
  no circumstances will the Society, or its directors, officers, employees or subsidiaries be responsible or liable for any loss or loss of profit arising
  from the use of this presentation, its contents, its omissions, reliance on the information contained within it, or the opinions communicated in
  relation thereto or otherwise arising in connection therewith.
• Certain statements in this presentation may constitute "forward-looking statements". These statements reflect the Society’s expectations and are
  subject to risks and uncertainties that may cause actual results to differ materially and may adversely affect the outcome and financial effects of
  the plans described in these presentations. You are cautioned not to rely on such forward-looking statements. The Society disclaims any
  obligation to update its view of such risks and uncertainties or to publicly announce the result of any revisions to the forward-looking statements
  made in these presentation materials except where they would be required to do so under applicable law.
• If these presentation materials have been sent to you in an electronic form, you are reminded that documents transmitted via this medium may be
  altered or changed during the process of electronic transmission. Consequently, neither the Society nor any director, officer, employee nor agent
  of it or affiliate or any such person accepts any liability or responsibility whatsoever in respect of the contents.

1.   Introduction
2.   Full year 2018 Results
3.   Financial performance
4.   Asset Quality
5.   Asset Quality: Buy to Let
6.   Funding and Liquidity
7.   Capital
8.   Contacts
1. Introduction

Overview
                     Simple business model                                                                                                   Financial Strength
             Providing simple, transparent retail savings products which offer
              long term value.                                                                                                 Strong CET1 ratio highest reported by any top 20 lender.1                                      35.5%
             Helping customers own residential properties through low risk                                                    Management expense ratio lowest reported by any UK building
                                                                                                                                                                                                                              0.50%
              mortgage lending primarily through intermediaries.                                                               society – including 9bps for increase in strategic spend over 2017
             Delivering sustainable organic growth without taking on higher
                                                                                                                               Leverage ratio exceeds regulatory requirements.2                                               4.6%
              levels of risk to protect existing members during periods of
              economic stress, and to safeguard the Society’s future.                                                          The 2nd Largest Building Society in the UK
             Ensuring operations are cost efficient, allowing the society to pay
              above market interest rates to savers.
             Underpinned by our CARES values which shapes decision making                                                                             Long term              Short term             Last credit opinion
              and focuses on putting members first.                                                                                Moody’s                   A2                    P-1                      Sept 2018
             Strategically investing in the future whilst maintaining capital
              strength.                                                                                                               Fitch                  A-                     F1                      Apr 2019

                                   Low risk                                                                                                      Member Focus

             Low LTV lending and third party distribution provides resilience                                                  The Society returned £227m
              to the business model if the market deteriorates.                                                                  of value back to members in
             Strong margin management capability, with the capacity to                                                          2018 through competitive
              increase margin if needed.                                                                                         savings rates3.
             25% of mortgages and 67% of savings on administered rates at                                                      The Society still has a strong
              31 December 2018.                                                                                                  Branch network consisting of
             Mortgage and savings rates remain competitive with pricing                                                         70 branches to service our
              supported by low levels of operating costs, impairments and                                                        members.
              conduct provisions.                                                                                               Continuing to invest in the
             Nationwide distribution of savings and mortgage avoids                                                             branch network is a key part
              geographical concentration.                                                                                        of our strategic plan.                                    Branch                Agency

•   All figures as at 31 December 2018 unless otherwise stated
•   1. Source: CML Top 20 mortgage lenders (as published July 2018) - latest published CET 1 data As at 27/02/2019 2.Under the BoE modified calculation excluding Central bank exposure less than 3 months 3. The Society’s average month end savings
    rate (society mix of products) compared to BoE WA rate for household interest bearing deposit (society mix of products)
                                                                                                                                                                                                                                            5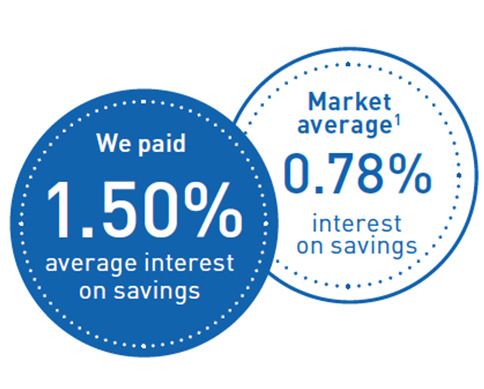
2. Full Year 2018 Results
Full year 2018 results
Growth in the Business
Mortgage assets have increased by £3.4bn
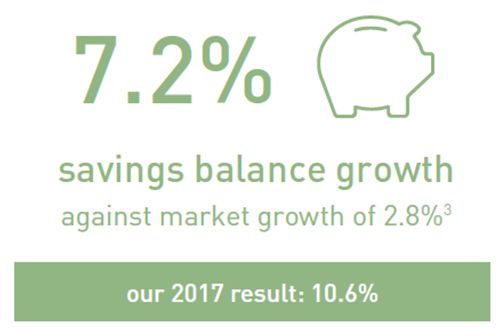
Savings balances increased by £2.2bn.
The Society has continually outperformed the growth of
the market.
Capital Strength with Low Risk Mortgages
Financially safe and strong institution maintaining CET1
ratio of 35.5%, the highest reported by a top 20 lender1
and a UK leverage ratio of 4.6%2.
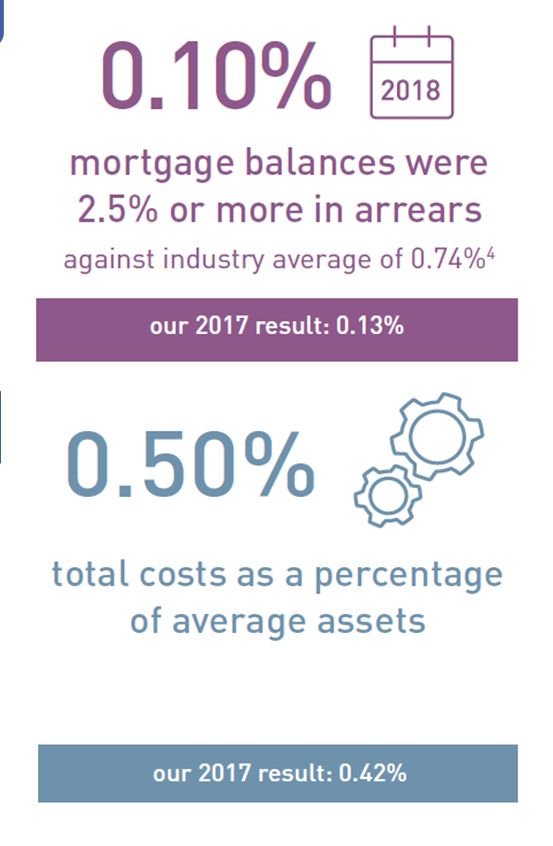
Consistently low risk business model, consistently low
arrears levels falling to 10 bps in 2018.
Cost Efficiency whilst Investing for the Long Term
The lowest cost to mean asset ratio of any UK building
society, whilst investing significantly in its technology
infrastructure and branch network.
Our underlying ratio remains low, at 0.41%, excluding the
increase in strategic investment compared to 2017.
1. Source: CML Top 20 mortgage lenders (as published July 2018) - latest published CET 1 data As at 27/02/2019 2.Under the BoE modified calculation excluding Central bank exposure less than 3 months. 3. Source: Bank of
England. 4. Source: Prudential Regulation Authority - latest available information at 30 September 2018. 5. Increase in strategic investment costs charged to the Income Statement compared to 2017. 7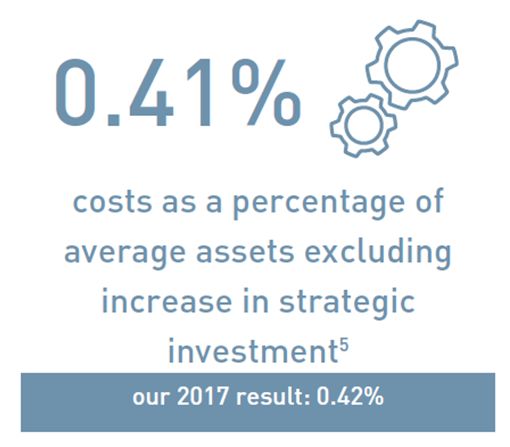
Full year 2018 results
                            Income statement                                                     Balance sheet
    £m                                         2018       2017      £m                                              2018       2017
    Interest receivable and similar income     976.3     895.1      Liquidity                                     6,401.9    6,209.5
    Interest payable and similar charges     (550.5)    (484.1)     Loans and advances to customers              39,264.6   35,930.9
    Net interest income                        425.8     411.0      Derivative financial instruments               275.4      323.7
    Other income                                (1.2)        5.1
                                                                    Intangible and tangible assets                  86.0       77.0
    Net gains/losses from derivatives           (0.3)       (0.3)
                                                                    Other assets                                    43.0       31.4
    Total income                               424.3     415.8
                                                                    Total assets                                 46,070.9   42,572.5
    Management expenses                      (180.7)    (167.9)
                                                                    Shares                                       33,281.6   31,035.7
    Strategic Investment Increase1             (41.0)
                                                                    Wholesale                                    10,313.7    9,127.3
    Impairment credit/charges                    0.4      (0.2)
                                                                    Derivative financial instruments               203.9      290.5
    Financial Services Compensation Scheme       1.0      (2.5)
                                                                    Other liabilities                               84.2       75.9
    Provisions for liabilities and charges      (1.0)       (1.0)
                                                                    Subordinated liabilities                        25.5       25.5
    Charitable donation (Poppy Appeal)          (1.4)       (1.5)
    Profit before tax                          201.6     242.7      PIBS                                            41.6       41.6

    Taxation                                   (45.5)    (57.9)     Members’ interests and equity                 2,120.4    1,976.0

    Profit for the period                      156.1     184.8      Total liabilities & equity                   46,070.9   42,572.5

                  Net interest income rose 3.6%
                                                                                        Mortgage growth of 9.3%
          Investment1 £41m higher, Profit before tax £41m
                              lower                                                      Savings growth of 7.2%
1. From 2017
                                                                                                                                       8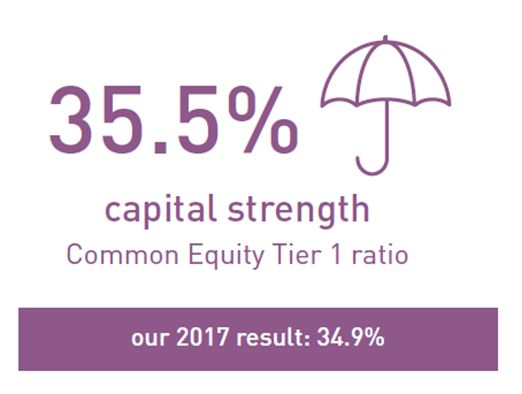
3. Financial performance
Financial performance
                                            %                                                              2014                   2015                     2016                       2017                       2018
Net interest margin / mean assets                                                                           1.15                   1.11                     1.06                       1.02                       0.96
Cost/ mean total assets (including Strategic Investment)                                                    0.42                   0.42                     0.41                       0.42                       0.50
Cost / income ratio (including Strategic Investment)                                                        35.7                   37.2                     37.9                       40.4                       52.3
Retained profit / mean assets                                                                               0.53                   0.52                     0.50                       0.46                       0.35
Liquidity (as percentage of SDL)                                                                            13.6                   13.8                     13.5                       15.5                       14.7
Wholesale funding                                                                                           19.4                   20.0                     21.6                       22.7                       23.7
Mortgage assets growth                                                                                      11.8                    9.1                     11.8                        9.3                        9.3
Common Equity Tier 1 ratio                                                                                  25.4                   29.4                     32.2                       34.9                       35.5
UK Leverage Ratio1                                                                                           4.2                    4.4                      4.4                        4.6                        4.6
Liquidity Coverage Ratio (LCR)                                                                             >100                    141                      151                         208                        202

          Financial Strength
  Net interest margin reflects member focused pricing, whilst being sufficient to support growth and maintain capital ratios. NIM
   includes 3bps uplift due to the sale of a £350m buy-to-let mortgage portfolio during 2018.
  The Society’s cost base remains low, with a cost to mean assets ratio of 0.41% excluding strategic expenditure on technology
   infrastructure and the branch network. This is a key advantage in an increasingly competitive mortgage market, and allows us to
   make strategic investment whilst costs remain the lowest in the sector.
  Wholesale has increased with issuance of inaugural 5 year SONIA covered bond and use of TFS.
  CET1 ratio the highest reported by any top 20 lender,2 Liquidity Coverage Ratio significantly in excess of regulatory minimum.
                                                                                                                                                                                                                           10
     1.Under the BoE modified calculation excluding Central bank exposure less than 3 months (2018 results) 2. Source: CML Top 20 mortgage lenders (as published July 18) - latest published CET 1 data As at 27/02/2019
Financial performance
Management expenses (%)
70%
Next best in peer group Coventry BS
60%
Strategic investment spend
50%
40%
30%
20%
10%
0%
2006 2007 2008 2009 2010 2011 2012 2013 2014 2015 2016 2017 2018
Low Cost Base
The Society’s low cost base gives a competitive advantage.
Cost efficiency is driven by the simple business model, efficient distribution channels and high average account balances, with growth
driving economies of scale.
The costs to mean assets ratio remains the lowest of the UK building societies,1 and is 2bps lower than the next best in the peer group2.
The underlying cost base of the Society, excluding increase in strategic investment spend over 2017, remains consistently low at 0.41%.
The Society expects cost growth to continue in 2019 as the strategic investment programmes progress. The Society is focused on
spending members’ money wisely and the cost to mean asset ratio is expected to remain amongst the lowest reported by any UK
building society.
1. Source: CML Top 20 mortgage lenders (as published July 2018) 2. Next best in peer group HY2018 release used 11Financial performance
Net Interest Income 2018: £426m (£411m 2017)
The Society delivered profit that maintains our strong capital position whilst providing superior returns to our
members and investing in our future. The Society is committed to providing long-term sustainable value to
members through competitively priced savings and mortgage products.
Profit Before Tax has decreased from the previous year, as expected. With increased strategic investment
spend (£41m) to update branches, enhance data infrastructure and progress detailed design and analysis to
upgrade our core technology platform.
In recent years net interest margin has benefited from the positive influence of government funding schemes
for retail and wholesale funding pricing. It remains elevated from the low 70bps area seen in the early post
crisis years due to lower retail savings rates. Mortgage margins have tightened, but spreads remain attractive
and even if margins reduce modestly, continued growth means the Society benefits from economies of scale.
Net interest income (£m) / Margin % Profit before tax
450 1.2 300
400
1 250
350
300 0.8 200
250
0.6 150
200 411 426
364 385 239 243
341 216
150 0.4 100 202 202
253
100 132
0.2 50
50
0 0 0
2013 2014 2015 2016 2017 2018 2013 2014 2015 2016 2017 2018
12
1.All figures as at 31 December 2018 unless otherwise statedFinancial performance
Low Risk Mortgages Retail Funding Focus
Gross lending of £8.9 billion and net lending of £3.3 billion in 2018. In 2018, the average savings rate we paid was 1.50%, nearly double the
The Society’s mortgage balance is expected to have grown by more market average of 0.78%1, a further increase on the premium provided
than three times the rate of the market in 2018. over many years.
Mortgage assets continue to be of very high quality with the balance This consistently good value has helped the Society to grow savings
weighted average indexed LTV of the mortgage book at just 54.6% as balances 7% in 2018. This is 2.5 times the market growth2.
at 31 December 2018. Net Promoter Score remained exceptionally high at +75 (+72: 2017)
Competition continues within the mortgage market and we have Additional products offered through Hargreaves Lansdown in 2018,
noticed changes in customer behaviour, with the re-mortgage sector with the first instant access product on the platform in January 2019.
particularly active, and a move away from variable mortgages to fixed
rate loans.
We remain committed to low risk, low LTV lending.
£ Bn Balance Sheet Growth
Savings Mortgages 45.0
40.0
Fixed
35.0
Administered
30.0
33% 25% 25.0
20.0 39.3
35.9 33.3
15.0 32.9 31.0
29.4 28.1
67% 24.1 21.3
27.0
23.4 25.4
75% 10.0
5.0
-
2013 2014 2015 2016 2017 2018
Mortgages Savings
13
1. The Society’s average month end savings rate compared with the Bank of England average rate for household interest bearing deposits on the Society’s mix of products. 2. Source: Bank of EnglandBuilding for the future – Strategic Investment
Investment for the Future to create competitive advantage
To sustain the Society’s great service record in the future, there is a need to invest in technology and infrastructure to meet the changing service
expectations of the customers.
Branch network re-design Operational Resilience Upgrading Banking Platform
Important face of the Society with the To enhance operational resilience we During 2018 we progressed detailed
membership which builds trust and are progressing a move to a co-located/ design and analysis for the work to
engages the community. cloud hybrid datacentre environment. upgrade our core technology platform.
Branches account for over 30% of Will provide dedicated and resilient The analysis has identified that if we want
retail savings acquisition each year and point to point connectivity. to maintain and increase the service and
manage around £10.5bn of the total Cloud technology adopted subject to flexibility desired this programme is likely
retail book. rigorous risk assessment. to be a bigger endeavour for the Society
70 branches concentrated in our Enable scalability of operation, and than originally indicated.
heartland with 10% of the network achieve economies of scale in a safe and We are now in a re-planning exercise to
already remodelled in line with plan. secure way. ensure we can meet our objectives and
Flexible design principles will future During 2019 we expect to complete the manage the execution, cost and related
proof our branches and better reflect majority of the remaining migrations. risks of the programme.
the future of branch engagement. Staying committed to doing the right
Great feedback from the community thing for our members, even if that
as we continue to roll out the design to means taking more time to assess at this
more branches in 2019. early stage and re-focus the project
rather than proceed with the original
plan.
Digital capabilities projects
The Society increased it’s technology capabilities across the business with great success in implementing print and telephony upgrades and
increasing the businesses digital competences.
144. Asset Quality
Asset quality
                                                                                            Gross lending ≤ 75% LTV
       Low Risk Loan-to-Value (LTV)
                                                                                                                           PRA     CBS
 76% of new lending in 2018 has been at LTVs of 75% or below, in       90%      84%                                         82%
                                                                                                            81%
  comparison to the market average of 62% (to end of Q3 2018).                                77%                                        76%
                                                                        80%
 Market lending above 90% in the first quarter of 2018 was 3.8%;
  Coventry lending above this LTV was nil.                              70%   64%         65%            66%           64%           62%
 No sub-prime, commercial or second charge lending (legacy             60%
  inherited commercial book currently £2.3m in run off).
 Negligible levels of unsecured lending (£23.9m: 2018, 31.8m: 2017).   50%
 The balance weighted average indexed LTV of the entire mortgage       40%
  book is 54.6%.
 96% of the overall book has an indexed LTV of 85% or less.            30%
 Two-thirds of all buy-to-let lending was originated at 65% LTV or     20%
  less.
                                                                        10%
                                                                        0%
                                                                              Q3 2017     Q4 2017        Q1 2018       Q2 2018       Q3 2018

                    Total book split by product                                                 Total book split by LTV
                                                                                      >85% and                     greater than
                                                                                        75% and
                                                                                65% and           50%,
                   Residential BTL                                                              50% and
                                    Occupied
Asset quality
Geographic Split Mortgage Book Performance
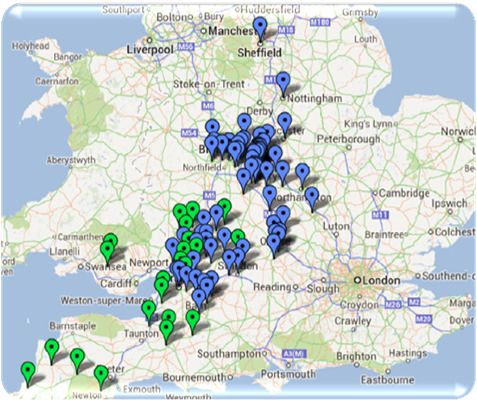
90% of the UK mortgage market is introduced via intermediaries The Society’s arrears performance continues to improve and to be
(e.g. independent financial advisors, mortgage brokers, estate significantly better than the industry as a whole.
agents). The value of loans in arrears by ≥ 2.5% of the mortgage balance at 31
Intermediaries give national coverage and support the geographic Dec 2018, as a proportion of the total book, has fallen to 0.10%.
diversification of the mortgage book. Arrears are very rarely capitalised. There was only 2 cases in 2018 for
Crucially, all underwriting and servicing is performed by Coventry. Coventry versus 5,900 for the industry as a whole in first 9 months of
There is no ‘packaging’; the intermediary acts solely as an 2018.
introducer. At 31 Dec 2018, only 34 properties were in possession.
IFRS 9 introduced in 2018, with a small decrease of impairment for
consumer loans and a negligible impact on regulatory capital.
Geographic distribution by value Dec 18 % of accounts >3 months in arrears1
0.60%
Scotland 3.5% Wales
and
South West Northern 0.50%
England 9.0% Ireland
2.4% 0.40%
East of London 27.1%
England 0.30%
11.5%
0.20%
Northern South East
England England 18.5%
13.4% 0.10%
Central
England
0.00%
14.6%
Coventry Skipton Nationwide Leeds Yorkshire Principality
Q3 HY
17
1. Source available results as at 28/02/19 for peers (Leeds using 1.5% of mortgage balance in arrears)Asset quality
Robust Origination and Monitoring Impairment charges as % of loans
Charges on products no longer originated
Coventry has strong and experienced central underwriting and Net UPL loan charges
collections teams, with no outsourcing. Charges on products still originated
The Credit Risk department analyses the performance of the mortgage 0.01
book and conducts quality assurance assessments.
We consistently target low risk areas of the mortgage market, primarily
low LTV owner occupier and buy-to-let. 0.01
No lending has been advanced at more than 90% LTV since 20091.
Arrears levels are consistently below industry averages at just 0.18% of Impairment charge release for
2015, 2016 and 2018
accounts being more than three months in arrears (Industry average
0.79%).2
At 31 Dec 2018, only 34 properties were in possession, of which 11 are
legacy products, 13 standard owner occupier and 10 Buy to Let out of a
total of c.290k properties.
2012 2013 2014 2015 2016 2017 2018
Average Society Possessions per month Very Low Impairments
20
Impairments are very low on a mortgage book of £39.2bn.
Impairment charges have fallen over the recent past with
15 releases reported in 2015, 2016 and 2018.
Special provisions fell significantly in December with the release
of one large case in particular (£1.3m).
10 Impairment charges in the last recession between 2008 and
2012 averaged c. 8 bps per year. A significant proportion (55%)
of the impairment charges seen in that period were on loan
5 products that are no longer offered e.g. unsecured personal
loans. Impairments have been consistently falling since exiting
such markets, with the continued focus being on high quality
0 lending.
2013 2014 2015 2016 2017 2018
18
1.Original advance excluding any product fees 2. Source UK FinanceProvisions under IFRS 9
Change in IFRS staging IFRS 9
4.00% Forward looking assessment of provisions given certain economic scenarios.
Increased weighting to downside scenario to 10% (1st Jan 2018: 2%)
3.50%
% of Total Customer Balances
96.6% of the Society’s loans and advances to customers were within Stage 1 ‘performing’
3.00% category
2.50% Staging informed by “Significant increase” in credit risk. This a relative measure, and there
are cure periods applied to each stage, loans can be recorded as Stage 2 or 3 despite
2.00% otherwise performing at the reporting period date.
1.50% Cure periods work to delay transition of loans to a lower credit risk classification (i.e. from
Stage 3 to Stage 2 or from Stage 2 to Stage 1) by requiring typically 12 months of sustained
1.00% performance before a loan is reassessed.
0.50% In Stage 2, all but £86m (0.2% of loans) were paid up to date at year end.
Only 0.05% of loans (£209m) are classified as Stage 3 ‘Default’. The definition of default in
0.00% IFRS9 is much wider than that used in IAS39. Only £68m would have been identified
Stage 2 Stage 3
31st December 2018In Arrears 31st December 2018 Not Past Due 1st January 2018 Total
impaired under IAS39.
Provisions represent 6.4 years of gross loss coverage.
Stage 1 Stage 2
Past due Stage 3 ‘Default’ Not past due Past due Total
2018 ‘Performing’ ‘Deteriorating’ Not past due £m
£m £m
£m £m £m
£m £m
Residential mortgages
Owner-occupier 22,530 685 630 54 130 49 80 23,344
Buy to let 15,237 374 352 23 38 14 24 15,650
Total traditional residential mortgages 37,767 1,059 982 77 168 64 104 38,993
Non-traditional mortgages
Residential near-prime 29 18 14 3 20 5 15 66
Residential self-certified 117 53 47 6 21 9 12 191
Commercial lending – 2 2 0 0 0 – 2
Total non-traditional mortgages 146 72 63 9 41 14 26 259
Unsecured loans 23 0 – 0 0 – 0 24
Total gross loans 37,936 1,131 1,045 86.3 209 78 131 39,276
Total gross loan % 96.6 2.9 2.7 0.2 0.5 0.2 0.3 100.0
195. Asset Quality: Buy-to-let
Asset quality – Buy-to-let
Coventry BTL Experience Coventry BTL Performance
Approximately two thirds of Coventry’s buy-to-let lending is on The focus on low LTV lending and on properties that are suitable for
houses, with one third on flats. the owner occupier market has led to low levels of arrears, and as at
Buy-to-let demographic is older than typical owner occupied 31 December 2018 the number of loans >3 months in arrears
demographic. (including possessions) reduced to 0.08% (0.10% Dec 17)
Arrears and impairment levels have been very low. On over £27.5bn Buy-to-let lending proved to be even more resilient than owner
of lending since entering the market in 2002, we have incurred total occupier lending during the crisis, with peak > 3 months arrears of
losses of £9.1m. 0.73% compared to 1.34% for the owner occupier book.
The balance weighted average LTV of the buy-to-let book is only 54% 85% of our borrowers have only one property with the Society and c.
as at 31 December 2018 4% have more than two with the Society (maximum 3 properties1).
There have been only 4 losses on all buy-to-let lending originated in
2010 or later (total losses £49k) and only 10 buy-to-let properties in
possession at FY 2018, from a book of c. 115,000 properties.
New mortgages by purpose of loan, non-seasonally adjusted, UK (CML) (£m) Coventry vs. CML >3mths buy-to-let arrears (incl. possessions)
8000 3.5
Remortgage
7000 Coventry
House purchase 3.0
6000 CML
Other 2.5
5000
% of Mortgages
2.0
4000
1.5
3000
2000 1.0
1000 0.5
0 0.0
Jan-14
Apr-14
Jul-14
Oct-14
Jan-15
Apr-15
Jul-15
Oct-15
Jan-16
Apr-16
Jul-16
Oct-16
Jan-17
Apr-17
Apr-18
Jul-17
Oct-17
Jan-18
Jul-18
Oct-18
21
1. Approval to increase to 5 properties in 2019Asset quality – Buy-to-let
Lending Criteria London Market
Interest Coverage Ratio 20181
Properties must be readily saleable into 44% of all BTL Balances are in London compared
200% >100% -
0.2%
12.9% 125% 100% subject to physical valuations. Coventry lending policy ensures any loan greater
5.4% Maximum of 3 properties2 with the than £1m to be less than 50% LTV, up to 75%
>175% -
200% Coventry and an aggregate loan limit of LTV loan size is capped at £500k and above 75%
10.6% £1,000,000. is capped at £350k.
50% maximum LTV on new build flats. Coventry does not lend on licensed HMO
Minimum rental coverage of 125% for properties.
basic tax payers and 145% for higher Severe stress testing carried out on our London
>150% - rate tax payers. BTL book, showed strong resilience.
175% >125% - The Society does not lend on Studio and Lower arrears than the rest of the country with
28.5% 150% High Rise Flats (above ten storeys) 3bps greater than 3 months in arrears (8bps
42.4%
national average).
Interest Coverage Ratio (ICR) Portfolio Landlords Balanced weighted average LTV
57%
For over 99.8% of accounts, rent Portfolio landlord regulation introduced
provides over 100% coverage of the in 2017. Rest of the UK
56% 56.4%
interest due on the loan. Buy-to-let criteria maintained and
The pay rate in this calculation was additional checks by dedicated portfolio London
floored at 5%. In actuality, the pay rate underwriters only. 55%
on many of these mortgages is Assessment of geographical
significantly lower, and as such true concentration and whole portfolio. 54%
interest cover is likely to be Portfolio maximum LTV of 65% across
considerably higher. all properties within the portfolio. 53%
Prudent assumptions regarding rental The whole portfolio minimum ICR of 53.0%
voids, rent increases etc .are included 125%. 52%
Coventry’s actual indexed ICR for 31 No individual property with ICR < 100%.
December 2018 was 175.7%. The proportion of portfolio landlords is
51%
c.26% of new business
22
1. Based on original rental at 5% stress rate - All data as at 31 December 2018 2. Approval to increase to 5 properties in 2019, increasing total loan limit to £2m6. Funding and Liquidity
Liquidity
                   Liquidity                                                                                                   LCR / NSFR
       The Society has its own liquidity risk appetite with a requirement to                                              The Society maintains liquidity considerably above regulatory
        survive a severe but plausible stress, a measure which is in excess                                                 requirements with LCR 202% as at 31st December 2018.
        of regulatory requirements                                                                                         The NSFR was 142% as at 31st December 2018.
       Over 99% of core liquidity is eligible as High Quality Liquidity Assets                                            The Loan to Deposit ratio was 118% reflecting the stable funding
        Buffer.                                                                                                             profile of the Society.
       Majority of liquid assets in UK Sovereigns with a small proportion in
        Supranational bonds.
       The UK authorities have placed increased emphasis on contingent
        liquidity, from central bank facilities via the pre-positioning of loan
        books.

                          Core Liquidity1                                                                                                                                          Contingent Liquidity2

                                            Supranational                                                                                                      Retained                          Offa RMBS 3%
           Gilts 4%                                                                                                                                          Covered Bonds
                                              Bonds 1%
                                                                                                                                                                  15%

                                                                                                                              £3.2bn
                                                                                           £5.2bn
                                                                                                                            Contingent
                                                                                        Core Liquidity
                                                                                                                             Liquidity2

                                                                                                                                                    Mercia RMBS
                                                                                                                                                                                                                Pre-positioned
                                                                                                                                                       26%
                                                                                                                                                                                                                  loans 56%
                                              BoE Reserves
                                                  94%
                                                                                                                                                                                                                 24
1.Showing value of unencumbered assets as at 31 December 2018 – The Society held £623m Gilts in repurchase agreements as at 31 December 2018. 2. including £1.8bn unencumbered prepositioned loans at the BoE
Retail funding
Retail Funding Prices vs. Market1 Retail Savings Focus
1.75% Lending is primarily funded through retail deposits.
CBS (average)
1.55% Coventry has a proven track record in acquiring and retaining
retail balances.
1.35% 1.50% Market (average) 1.49%
Savings book growth 7.2% in 2018.
1.15% Savings well diversified over distribution channels; Branch,
Internet and Telephone.
0.95% Coventry market share increased to 2.5% in 2018, with over
176,000 new accounts opened in the year.
0.75%
0.78% 0.77% The Society pays above market rates on savings, in line with our
0.55% continued strategy of returning value to members.
New partnership with Hargreaves Lansdown offering Society
0.35%
products on the platform to acquire new funding, initially with an
2018 2017
exclusive agreement to offer the only instant access product.
Funding Channels as at December 31 2018 Retail Product Breakdown as at 31 December 2018
Offset Savings Other Total
Total 0%
4%
34% of Accounts
opened through
our website Bond-ISA
19%
35% of Accounts 31% of Accounts
opened in our opened over the Instant access
branches telephone
savings Bond Non-ISA
34% 14%
Total
accounts Variable ISA
opened 26%
Current Account/
2018 MoneyManager
Total
3% 25
1. The Society’s average month end savings rate (society mix of products) compared to BoE WA rate for household interest bearing deposit (society mix of products)Wholesale funding
Funding Strategy Wholesale Funding as at 31 December 2018
Retail deposits are supplemented by a number of wholesale funding options. Deposits from
RMBS
Wholesale market access provides competitive advantage and diversification of funding Banks Inc Repo
1%
MTNs. 12%
Covered Bonds.
Securitisation. Covered Bonds
Continued move towards longer dated wholesale deals providing reliable long term 20%
funding.
Wholesale funding ratio 23.7% as at 31 December 2018.
TFS drawings
TFS drawings of £4.25bn as at 31 December 2018, No FLS remaining. Medium term
41%
The Society sold £351m mortgage book to 24AM and issued £500m 5 year SONIA-linked notes
Covered Bond, showing the capability to diversify funding channels using prime 21%
residential mortgage assets.
Wholesale funding maturity profile2
1800 Other Deposits
5%
1600
Senior
1400
350
1200
1000 EUR Senior
580
800 Senior
450
600 Securitsation
2841
400 Covered Bond
650 Covered Bond
Senior Covered Bond Senior Covered Bond
200 500
350 400 400 400
0
2019 2020 2021 2022 2023 2024
26
1. Current value after amortisation as at 31 December 2018 2. In GBP, excluding TFS7. Capital
Capital
                      CET1 and Total Capital Ratios                             Regulatory Capital
50%
                                                                               The Society was issued with Total Capital Requirement (TCR) of
45%                                                                             11.2% or £511m comprising Pillar 1 and Pillar 2A
40%
                                                                               Regulatory capital buffers must be met in addition to TCR and on
35%
                                                                                an end-point basis are as follows:
30%
25%                                                                                          Capital Conservation Buffer – 2.5%
20%                                                                                          Countercyclical Buffer – 1.0%
15%
                                                                               Coventry’s total capital ratio is 45.5% compared to an RWA-based
10%                                                                             capital requirement of 14.7% (TCR + Capital Conservation Buffer +
 5%                                                                             Countercyclical Buffer)
 0%
                                                                               The differential represents a significant 29.3% buffer over and
        2013      2014      2015      2016       2017       2018
                                                                                above total capital requirements on an RWA basis
                   CET1 %    Tier 1 %   Total Capital %

  Capital and Reserves
                                                                                                   End-point Risk Weighted Capital Requirement
                                                                         50
  The Society has been issued with a TCR by the regulator of 11.2% of   45
   RWAs, which is comfortably exceeded. This was a reduction of the
                                                                         40
   previous ICG of 12.8%
  Retained earnings from strong profitability are Coventry’s primary    35
   source of CET1 capital, currently c. £1.61bn.                         30
  Internally generated capital is augmented by £400m of AT1 issuance,   25
   providing 81bps uplift in leverage ratio.                             20
  The whole loan sale of non-member buy-to-let mortgages to a third
                                                                         15
   party in 2015 and 2018 provide further capital management options.
                                                                         10
                                                                         5
                                                                         -
                                                                                 Risk weighted capital requirement                                         Total capital
                                                                                                                                                                                     28
                                                                                 Pillar 1    Pillar 2A   Capital Conservation Buffer   Countercyclical Capital Buffer   CET1   AT1    Tier 2
Leverage & MREL
Leverage Ratio1
MREL
5.0% Under the rules the Society is required to meet an interim MREL
requirement of 18% of risk weighted assets by 1 January 2020. The
4.5% indicative end-state MREL requirement for all firms will be twice the
binding capital requirement, for the Society this is currently two
4.0% times Pillar 1 and Pillar 2a or 22.4% of risk weighted assets. The
Society currently exceeds this constraint. If leverage becomes the
3.5%
binding constraint for the Society, this will result in the need to raise
3.0% MREL eligible debt.
As at end of 2018, an additional requirement of £900m of MREL
2.5% would be required to meet 2x leverage constraint
This requirement will be expected to grow in the years leading up to
2.0% 2022, as the balance sheet grows, however, this equates to a
2013 2014 2015 2016 2017 2018 manageable 3 to 4 MREL transactions
UK Leverage - CET1 UK Leverage - AT1
Leverage Ratio Framework MREL
3,000
A binding UK leverage ratio applies to firms with retail deposits Tier 2 PIBS Additional
required
AT1 CET1
of £50bn or more. This is not expected to be binding until at 2,500 £900m
least 2020. MREL requirement is 2x Leverage
The components of the UK leverage ratio framework are a 2,000
+ Buffers
minimum ratio of 3.25% (excluding Central Bank exposures
below 3 months to maturity). The CCyB is set by the FPC and is 1,500
currently 1%. 2 Requirement
The modified leverage ratio on a UK basis at 31 December 2018 1,000
on a 3.25%
basis plus
is 4.6% (4.1% when Bank of England reserve account is buffer
included), comfortably above the 3.25% minimum level (3.6%
500
including the CCyB).
-
Leverage MREL 29
1.The BoE modified calculation excluding Central bank exposure less than 3 months 2.For Leverage Counter cyclical leverage buffer (CCLB) is calculated as 35% of 1% CCyBBasel IV Capital implications
Basel IV
BCBS Paper released in December 2017 outlining Standardised Risk Weights and output floors that seek to remove variability in internal models
(IRB).
Regulation and implications still need finalising and have national discretion (especially in the treatment of differing mortgage types).
Output floor phased in from 50% in 2022 to 72.5% in 2027.
Assuming the implementation of 50% output floor, the CET1 ratio reduces materially but remains above 25%, reflecting the impacts of the flooring
on a low risk business model.
Surplus to regulatory minima remains considerable, equal to over 13 times the actual credit losses experienced in the last 10 years, even after
transition.
Surplus over Basel IV Requirement1
CET1 Ratio: 35.5%
CET1 Ratio: c. 26%
18 x losses
incurred in CET1 Ratio: c. 17.9%
previous 10 16 x losses
years incurred in
previous 10 13 x losses
years incurred in
previous 10
years
Current Transition (50% Floor) End State (72.5% Floor)
30
1. Based on Portfolio Landlords (landlords with 4 or more properties) risk weighted as real estate exposures with repayment materially dependant on cash flows generated by property8. Contacts
Contact details

  Contacts
      Michele Faull                                            Lyndon Horwell
      Chief Financial Officer                                  Treasurer
      michele.faull@thecoventry.co.uk                          lyndon.horwell@thecoventry.co.uk
      02475 180311                                             02475 181333

      Philip Hemsley                                           Joanne Gaskin
      Head of Capital Markets                                  Treasury Dealer
      philip.hemsley@thecoventry.co.uk                         Joanne.gaskin@thecoventry.co.uk
      02475 181327                                             02475 181332

 Useful links
 • Main website                 http://www.coventrybuildingsociety.co.uk/
 • Financial results            http://www.coventrybuildingsociety.co.uk/your-society/financial-results.aspx

                                                                                                               32
You can also read